Genetic engineering of the skeletal muscle to counteract insulin resistance and obesity
191
0
0
Texto completo
(2) This PhD thesis has been carried out under the direction of Dr. Fàtima Bosch i Tubert at the Biochemistry and Molecular Biology Department of the Veterinary School of Medicine and at the Center of Animal Biotechnology and Gene Therapy (CBATEG).. CARLES ROCA LECHA BOSCH I TUBERT. FÀTIMA. JANUARY 2014 BELLATERRA.
(3) A vosaltres família.
(4) Són moltes les persones a les quals haig de donar les meves gràcies més sinceres. Per més paraules que escrigui no podré expressar la gratitud personal que us dec. En primer lloc vull donar les gràcies a la Dra. Fàtima Bosch i Tubert per haver-me donat l’oportunitat de realitzar aquesta tesi doctoral en el seu grup d’investigació. Gràcies per la teva energia, empenta i bon cor que et caracteritzen i que han fet possible aquest treball. Vull agrair també a totes les persones que durant tots aquests anys han anat passant per la meva vida científica al laboratori i amb qui he treballat més a prop. Vull donar unes gràcies especials a la Dra. Anna Pujol i a l’Anna Arboç per haver-me donat confiança i guiar-me durant els meus primers dies en el món del laboratori, sense vosaltres no seria on sóc. A la Tura per agafar el seu relleu i ensenyar-me tantes tècniques que després m’han servit per créixer. A la Mònica George per ensenyar-me les primeres pinzellades de com funciona la ciència. A tu Sabrina, en pau descansis, per la teva bona voluntat i dedicació per volguer fer el meu treball millor. Gràcies Ivet per estar al meu costat cada un d’aquests anys d’ençà que vam començar al laboratori. Moltíssimes gràcies per la teva dedicació i paciència, sobretot durant l’etapa final. Gràcies als “pardis”, Albert, Sergio i Xavier. Treballar al vostre costat ho ha fet tot més fàcil. Gràcies David per tantes hores compartides de feina. Gràcies Chris, Edu i Miquel, ha estat un plaer discutir i aprendre de mil qüestions amb vosaltres. Gràcies Laia per la teva ajuda quan la he necessitat. Gràcies Maria Molas, Xavier León i Luca per ser-hi sempre amb els vostres consells tècnics i bon companyerisme. Gràcies a la resta de companys del laboratori amb els que he compartit tants i tants moments. La vostra companyia tant en el camp professional com en el personal és impagable. A tu Estefania, Pilar, Sara, Albert Rivera, Sandra, Alba, Vicky, Cristina, Vero, Claudia, Meritxell, Joan, Sylvie i Efrén. Als que ja no hi son, a tu Iris, Judith, Tami, Albert, Joel, Mercé, Marc, Ricardo, Ariana i Antonio. Als més nous, Marisa, Cristian, Jordi, Víctor MPS, Víctor Adipós i Ivàn, ja ens anirem.
(5) coneixent. Gràcies Jeny i Lídia per tota la feina que feu. A la Marta per tota la histologia. Thank you Malcolm and Judy. Moltes gràcies a tot l’equip del SER-CBATEG. Gràcies Pedro per dirigir el servei. Gràcies Mireia per la teva ajuda sempre que l’he necessitat. Gràcies a la Unitat d’Animals Transgènics. Gràcies Sandra per completar una tant bona feina. Gràcies a l’equip d’anàlisi morfològica, amb el Doctor Jesús Ruberte al capdavant. Gràcies als que formeu un tant bon equip. Gràcies Carles Ros per tots aquests anys i per tants consells. Gràcies als companys de la cinquena planta. Gràcies Miguel i Assumpció. Al personal de l’SLIPI i seguretat. Finalment agrair als meus pares, germana, avis i a tota la família per no deixar mai de creure amb mi, donar-me suport i confiança durant tots aquests anys. Per fer-me la persona que sóc, gràcies. A tots els amics de Badalona I Barcelona per ser-hi. Aquesta tesi ha estat possible gràcies al finançament rebut del Plan Nacional I+D+I (SAF2005-01262, SAF2008-00962 i SAF2011-24698), de la Gestió d’Ajuts Universitaris i de Recerca (ajuts per a grups de recerça consolidats 2009SGR 224) i dels projectes europeus: Network of Excellence LIFESCIHEALTH (EUGENE2, Network of Functional Genomics of Type 2 Diabetes- LSHM-CT-2004-512013), European Network for the Advancement of Clinical Gene Transfer and Therapy (CLINIGENE, LSHB-CT-2006-018933)..
(6) ABREVIATIONS AACE Endocrinologists AAV1 AAVGck the AAVPGC the AAVPPAR the AAVPGC/Gck carrying associated vector glucokinase gene AAVPGC/PPAR carrying associated vector ADA ADA AKT AKT-P AKT-T AMPK Protein ATP BMI BSA CaN CaMK Cap CAT CD36 cDNA CMV CPT1 CPT2 CREB CsCl DAG DNA DTT ETC F-1-P F-6-P FABPpm FADH2. American Association of Clinical Adeno-associated vector serotype 1 Adeno-associated vector serotype 1 carrying rat glucokinase gene Adeno-associated vector serotype 1 carrying Pgc1α gene Adeno-associated vector serotype 1 carrying Pparδ gene Mixture of an adeno-associated vector 1 the Pgc1α gene and an adeno1 carrying the rat Mixture of an adeno-associated vector 1 the Pgc1α gene and an adeno1 carrying the Pparδ gene American Diabetes Association Adenosine diphosphate Protein kinase B Phosphorylated AKT Total AKT Adenosine Monophosphate-activated Kinase Adenosine triphosphate Body Mass Index Bovin Serum Albumin Calcineurin Ca-calmodulin dependent kinase Capside proteins Carnitine translocase Fatty acid translocase Complementary Deoxyribonucleic Acid Cytomegalovirus Carnitine palmitoyltransferase I Carnitine palmitoyltransferase II cAMP response element-binding protein Cesium Chloride Diacylglycerol Deoxyribonucleic Acid Dithiothreitol Electron transport chain Fructose-1-phosphate Fructose-6-phosphate Plasma membrane-bound fatty acid binding protein Flavin Adenine dinucleotide.
(7) FATP FFA G-6-P GCK Gck GDM GFP GIP GLP GLUT1 GLUT4 GWAS H+ HFD HK IgG ITR ITT LCACoA M MCAD dehydrogenase MEF2C MHC mM MOPS NADH NRF-1 NRF-2 ORF PBS PCR PGC1α gamma Poly A PKC PPARα PPARδ delta PPARγ gamma RB Rep RIA RNA ROS SDS SDS-PAGE UCP3 WAT WHO T2DM TBS TBS-T. Fatty acid transport protein Free Fatty Acids Glucose 6-phosphate Human glucokinase Murine glucokinase Gestational Diabetes Mellitus Green fluorescence protein Gastric inhibitory peptide Glucagon-like peptide-1 Glucose transporter 1 Glucose transporter 4 Genome Wide Association Studies Protons High Fat Diet Hexokinase Immunoglobulin G Inverted Terminal Repeat Insulin Tolerance Test Long Chain Acil Coa Molar Medium-chain acyl-coenzyme A Myocyte-specific enhancer factor 2C Myosin heavy chain milimolar 3-(N-morpholino)propanesulfonic acid Nicotinamide adenine dinucleotide Nuclear Respiratory Factor 1 Nuclear Respiratory Factor 2 Open reading frame Phosphate Buffered Saline Polymerase Chain Reaction Peroxisome proliferator-activated receptorcoactivator 1 alpha Simian Virus 40 Polyadenylation Signal Protein kinase C Peroxisome proliferator activated receptor-alpha Peroxisome proliferator activated receptorPeroxisome proliferator activated receptorRoller Bottle Replication proteins Radio immunoassay Ribonucleic Acid Reactive oxygen species Sodium Dodecyl Sulphate Sodium Dodecyl Sulphate Polyacrylamide Gel Electroforesis Uncoupling Protein 3 White adipose tissue World Health Organization Type 2 Diabetes Mellitus Triss-buffered Saline Triss Buffered Saline-Tween.
(8) TCA Tfam TG TZD. Tricarboxylic acid cycle Mitochondrial transcription factor A Triglycerides Thiazolidinediones.
(9) I. SUMMARY .......................................................................... 1 II. INTRODUCTION ........................................................... 4 1. GLUCOSE HOMEOSTASIS ................................................................. 4 2. TYPE 2 DIABETES MELLITUS .......................................................... 6 2.1. Introduction ................................................................................... 6 2.2. Epidemiology of type 2 diabetes .................................................. 7 2.3. Risk Factors for type 2 diabetes ................................................... 9 2.3.1. Obesity .................................................................................. 9 2.3.2. Environmental factors .......................................................... 10 2.3.3. Genetic Susceptibility .......................................................... 11 2.3.4. Another risk factors ............................................................. 12 2.4. Etiopathology of type 2 diabetes ............................................... 12 2.5. Current treatments for type 2 diabetes ..................................... 14 2.5.1 Lifestyle interventions .......................................................... 14 2.5.2. Pharmacological treatments ................................................ 15 2.5.3. Bariatric Surgery .................................................................. 18 3. THE SKELETAL MUSCLE ................................................................ 19 3.1. Fibre types .................................................................................. 20 3.2. Skeletal muscle metabolism ........................................................ 21 3.2.1. Glucose metabolism in the skeletal muscle ......................... 22 3.2.2. Lipid metabolism in the skeletal muscle .............................. 24 3.2.3. Oxidative phosphorylation and mitochondrial uncoupling.... 25 3.3. Skeletal muscle and type 2 diabetes .......................................... 27 3.3.1. Role of reduced glucose phosphorylation in type 2 diabetes ....................................................................................................... 28 3.3.2. Role of reduced oxidative capacity of the skeletal muscle in type 2 diabetes ...................................................................... 29 3.3.3. Molecular mechanisms of lipid-induced insulin resistance in the skeletal muscle ............................................................ 29 3.4. Novel strategies to counteract type 2 diabetes by the genetic modification of the skeletal muscle.............................................. 30 4. GLUCOKINASE ................................................................................. 32 4.1. Metabolic role of glucokinase ...................................................... 33 4.2. Regulation of glucokinase activity ............................................... 33 4.3. Transgenic expression of glucokinase in the skeletal muscle...... 34.
(10) 5. ROLE OF THE PEROXISOME PROLIFERATOR -ACTIVATED RECEPTOR-GAMMA COACTIVATOR 1 ALPHA IN THE SKELETAL MUSCLE ................................................................................................. 35 5.1. Regulation of PGC1α transcription in the skeletal muscle ........... 36.
(11) 5.2. PGC1α and skeletal muscle fibre type conversion ...................... 37 5.3. PGC1α, respiration and mitochondrial biogenesis ....................... 37 5.4. PGC1α and lipid metabolism ........................................................ 38 5.5. PGC1α and muscular glucose uptake .......................................... 39 5.6. PGC1α and type 2 diabetes ........................................................ 39 6. ROLE OF THE PEROXISOME PROLIFERATOR -ACTIVATED RECEPTOR-DELTA IN THE SKELETAL MUSCLE .............................. 41 6.1. PPARδ transcription in the skeletal muscle ................................. 43 6.2. PPARδ and fibre type conversion ................................................ 43 6.3. PPARδ, lipid metabolism and oxidation ........................................ 44 6.4. PPARδ and type 2 diabetes ......................................................... 44 7. GENE THERAPY ............................................................................... 46 7.1. Introduction to gene therapy ...................................................... 46 7.2. Non-Viral vectors ........................................................................ 47 7.3. Viral vectors ................................................................................ 48 7.4. Adeno-associated vectors (AAV) ............................................... 49 7.4.1. Biology of wild-type adeno-associated viruses .................... 49 7.4.2. Recombinant adeno-associated viral vectors ...................... 50. III. OBJECTIVES ............................................................. 53 IV. RESULTS .................................................................. 54 1. GENETIC MODIFICATION OF THE SKELETAL MUSCLE AND EXPERIMENTAL DESIGN ...................................................................... 54 1.1. Transduction of the skeletal muscle with AAV vectors .............. 54 1.2. Experimental design .................................................................... 55 2. GENETIC MODIFICATION OF THE SKELETAL MUSCLE TO OVEREXPRESS GLUCOKINASE ........................................................... 57 2.1. Design of an AAV1 vector carrying the Gck gene ...................... 57 2.2. Metabolic effects of the Gck expression in the skeletal muscle of High-fat fed mice .................................................................... 58 2.2.1. Glucokinase expression in the skeletal muscle ..................... 58 2.2.2. Body weight gain and adiposity ........................................... 59 2.2.3. Hepatic triglyceride content ................................................ 60 2.2.4. Study of glucose homeostasis ............................................. 61 2.2.5. Insulin signalling in the skeletal muscle ................................ 63 2.2.6. Determination of circulating metabolites ............................ 65.
(12) 2.3. Metabolic effects of the expression of high levels of Gck in the skeletal muscle ......................................................................... 66 2.3.1. Glucokinase expression in the skeletal muscle ..................... 66 2.3.2. Body weight gain and adiposity ........................................... 67 2.3.3. Hepatic triglyceride content ................................................ 68 2.3.4. Triglyceride content and fatty acid oxidation in the skeletal muscle ..................................................................... 70 2.3.5. Study of glucose homeostasis ............................................. 71 2.3.6. Insulin signalling in the skeletal muscle ................................ 72 2.3.7. Determination of circulating metabolite .............................. 73 3. GENETIC MODIFICATION OF THE SKELETAL MUSCLE TO OVEREXPRESS Gck AND Pgc1α ........................................................ 75 3.1. Design of an AAV1 with the Pgc1α gene.................................... 75 3.2. Metabolic effects of the Pgc1α expression in the skeletal muscle of high-fat fed mice ................................................................ 76 3.2.1. Pgc1α expression in the skeletal muscle ............................. 76 3.2.2. Body weight gain and adiposity ........................................... 77 3.2.3. Hepatic triglyceride content ................................................ 78 3.2.4. Triglyceride content and fatty acid oxidation in the skeletal muscle ..................................................................... 80 3.2.5. Study of glucose homeostasis ............................................. 81 3.2.6. Insulin signalling in the skeletal muscle ................................ 82 3.2.7. Determination of circulating metabolites ............................ 83 3.3. Metabolic effects of Gck and Pgc1α overexpression in the skeletal muscle of high-fat fed mice ................................................................ 85 3.3.1. Pgc1α and Gck expression in the skeletal muscle ............... 85 3.3.2. Body weight gain and adiposity ........................................... 86 3.3.3. Hepatic triglyceride content ................................................ 87 3.3.4. Triglyceride content and fatty acid oxidation in the skeletal muscle ..................................................................... 89 3.3.5. Study of glucose homeostasis ............................................. 90 3.3.7. Determination of circulating metabolites ............................ 91 4. GENETIC MODIFICATION OF THE SKELETAL MUSCLE TO OVEREXPRESS Pgc1α AND Pparδ ..................................................... 93 4.1. Design of an AAV1 with the Pparδ gene ..................................... 93.
(13) 4.2. Metabolic effects of Pparδ overexpression in the skeletal muscle of high-fat fed mice ........................................................................... 94 4.2.1. Pparδ expression in the skeletal muscle............................... 94 4.2.2. Body weight gain and adiposity ........................................... 95 4.2.3. Hepatic triglyceride content ................................................ 96 4.2.4. Triglyceride content and fatty acid oxidation in the skeletal muscle ..................................................................... 98 4.2.5. Study of glucose homeostasis ............................................. 99 4.2.6. Insulin signalling in the skeletal muscle ............................... 100 4.2.7. Determination of circulating metabolites ........................... 101 4.3. Metabolic effects of Pparδ and Pgc1α overexpression in the skeletal muscle of high-fat fed mice .............................................................. 102 4.3.1. Pparδ and Pgc1α expression in the skeletal muscle............ 102 4.3.2. Body weight gain and adiposity .......................................... 103 4.3.3. Hepatic triglyceride content ............................................... 104 4.3.4. Triglyceride content and fatty acid oxidation in the skeletal muscle .................................................................... 106 4.3.5. Study of glucose homeostasis ............................................ 107 4.3.6. Insulin signalling in the skeletal muscle ............................... 108 4.3.7. Determination of circulating metabolites ........................... 109. V. DISCUSSION ............................................................. 111 VI. CONCLUSIONS ......................................................... 124 VII. MATERIALS AND METHODS ...................................... 125 1. MATERIALS ..................................................................................... 126 1.1. Bacterial Strains ......................................................................... 126 1.2. Animals ....................................................................................... 126 1.3. Anaesthetics .............................................................................. 126 1.4. Antibodies .................................................................................. 127 1.5. Plasmids ..................................................................................... 128 1.6. Probes ........................................................................................ 128 1.7. Reagents .................................................................................... 129 2. METHODS ........................................................................................ 129 2.1. Basic DNA techniques ................................................................ 129 2.1.1. Plasmid DNA preparation .................................................... 129 2.1.2. DNA digestion with restriction enzymes ............................ 129 2.1.3. Dephosphorylation of DNA fragments ................................ 130.
(14) 2.1.4. Ligation of DNA fragments ................................................. 130 2.1.5. DNA resolution and purification .......................................... 130 2.1.6. Transformation of competent E.Coli ................................... 131 2.2. RNA analysis ............................................................................... 131 2.2.1. Total RNA isolation ............................................................. 131 2.2.2. Analysis of RNA expression by Northern Blot ..................... 132. 2.2.2.1. RNA electrophoresis in agarose/formaldehyde denaturing .................................................................................................. 132. gels 2.2.2.2. Transference of RNA from gel to membrane .............. 132 2.2.2.3. Prehybridization and hybridization of membrane ........ 133 2.2.2.4. Radioactive labelling of DNA probes ............................ 133 2.2.2.5. Membrane washes and developing .............................. 133 2.2.3. Analysis of RNA expression by RT-PCR ............................... 134. 2.2.3.1. DNAse treatment of RNA ............................................ 134 2.2.3.2. cDNA synthesis ........................................................... 134 2.2.3.3. Quantitative PCR ......................................................... 134 2.3. Production, purification, titration and administration of AAV vectors ........................................................................................................... 135 2.3.1. Production of AAV vectors ................................................. 135 2.3.2. AAV purification ................................................................. 136 2.3.3. AAV titration ...................................................................... 138 2.3.4. AAV injection in the skeletal muscle .................................. 139 2.4. Western Blot .............................................................................. 139 2.4.1. Protein extraction ............................................................... 139 2.4.2. Bradford method for protein quantification ....................... 140 2.4.3. Electroforesis in polyacrylamine gels (SDS-PAGE) .............. 140 2.4.4. Protein transference to membranes and immunodetection 141 2.5. Histological Analysis ................................................................... 142 2.5.1. Haematoxylin/eosin staining ............................................... 142 2.5.2. Immunohistochemistry ....................................................... 142 2.6. In vivo techniques ...................................................................... 142 2.6.1. Food intake determination .................................................. 142 2.6.2. Insulin tolerance test .......................................................... 143 2.6.3. Insulin induced AKT-phosphorylation studies in the skeletal muscle ........................................................................................... 143 2.6.4. Measurement of serum parameters .................................... 143.
(15) 2.6.4.1. Glucose ........................................................................ 144 2.6.4.2. Insulin .......................................................................... 144 2.6.4.3. Free fatty acids ........................................................... 144 2.6.4.4. Triglycerides ................................................................ 144 2.6.4.5. Leptin .......................................................................... 145 2.6.4.6. Skeletal muscle triglyceride content ........................... 145 2.7. Statistical analysis ...................................................................... 146. VII. BIBLIOGRAPHY ........................................................ 147.
(16) Summary Type 2 diabetes is the most common metabolic disease worldwide. Despitedrug treatments are useful in the first stages of the disease, none of them have proven to prevent the glycaemic control loss in a long-term basis. Furthermore, all treatments present undesirable secondary effects. Thus, the development of new treatments for type 2 diabetes is nowadays an important cornerstone in scientific research. The development of Gene Therapy has provided a new tool to treat human diseases. However, successful gene therapy approaches for the treatment of type 2 diabetes have not been developed to date.. About 90% of type 2 diabetes is attributable to excessive body weight. The accumulation of triglycerides in peripheral tissues is linked to the appearance of insulin resistance and reduced glucose uptake. This leads to βcell failure and ultimately to type 2 diabetes. Thus, promoting glucose uptake or fatty acid oxidation may prevent the development of type 2 diabetes. The skeletal muscle plays a key role in glucose homeostasis and possesses a big capacity to use fatty acids for energy production. It is also an ideal tissue for gene transfer since it is easily accessible and can be transduced by a diversity of gene therapy vectors. In this study, with the aim of finding a new gene therapy approach for type 2 diabetes, we transferred several genes with the ability to increase glucose uptake or bust the oxidative capacity of the skeletal muscle in a model of diet-induced diabetes by using AAV vectors. These vectors are safe and allow a long-term expression of the transgene in the skeletal muscle.. We previously demonstrated in transgenic mice that increasing glucose phosphorylation by the muscular overexpression of Glucokinasse (Gck), can prevent obesity and insulin resistance induced by a high fat diet. Here, as a. 1.
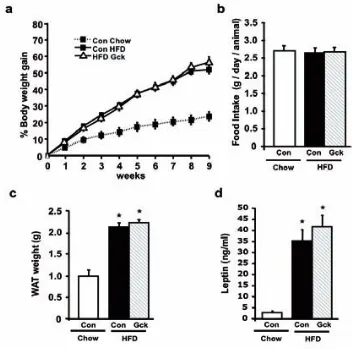
(17) Summary first approach, we overexpressed Gck in the skeletal muscles of high fat dietfed adult mice. This led to a 10% reduction in body weight gain during the diet along with normoinsulinemia and a prevention of high fat diet-induced insulin resistance. PGC1α is a master regulator of mitochondrial biogenesis and the oxidative function in the skeletal muscle. The muscular expression of this gene is reduced in type 2 diabetic patients, suggesting that it is involved in the pathogenesis of insulin resistance in this tissue. Additionally, the expression of PGC1α increased glucose uptake in skeletal muscle cells. Thus, in the second part of this study, we overexpressed Pgc1α in the skeletal muscles of high fat diet-fed adult mice alone or in combination with Gck. The overexpression of. Pgc1α led to a reduction of a 10% of the body weight gained during the diet. However it did not prevent the development of insulin resistance and worsened insulin sensitivity in the skeletal muscle. The co-overexpression of Pgc1α and. Gck did not prevent obesity or the development of insulin resistance, thus abolishing the beneficial effects observed when Gck was overexpressed alone.. In the skeletal muscle, PPARδ is a ligand-inducible transcription factor that promotes fatty acid oxidation. Upon ligand binding, PPARδ recruits coactivators which allow the transcription of its target genes. PGC1α is one of these coactivators. Much of the actions of PPARδ activation in the skeletal muscle resemble those observed by PGC1α, suggesting that these actions are orchestrated by the interaction of both proteins. Thus, in the third part of this study, we overexpressed Pparδ alone or in combination with Pgc1α in the skeletal muscles of high fat diet-fed adult mice. The overexpression of Pparδ during the diet did not prevent the development of obesity or insulin resistance. In contrast, the co-overexpression of Pparδ and Pgc1α led to a 10%. 2.
(18) Summary reduction in body weight gain along and with a prevention of the development of insulin resistance during the diet. Furthermore, muscles overexpressing both genes presented increased in insulin sensitivity and reduced accumulation of fatty acids.. Therefore, the muscular overexpression of Gck or the co-overexpression of Pparδ and Pgc1α, might represent potential new gene transfer approaches to treat type 2 diabetes.. . 3.
(19) Summary. 4.
(20) Introduction 1. GLUCOSE HOMEOSTASIS. Glucose is the main energy source for the cells in the body and therefore, its concentration in blood is tightly regulated. The homeostatic mechanism keeps blood glucose levels within a narrow range independently of the internal demand or the exogenous disposition of the sugar. The regulation of blood glucose concentration is the result of the coordinated action of two antagonistic hormones secreted by the pancreas, glucagon and insulin. During fasting, basal glucose use is matched with the endogenous glucose production keeping glucose levels between 70 mg/dL and 100 mg/dL (American diabetes association 2013, ADA). In this situation, the majority of the total body glucose use, approximately a 50%, takes place in the brain. The rest is distributed between the liver, gastrointestinal tissues, the skeletal muscle and to a lesser extent the adipose tissue. On the other hand, approximately 85% of the endogenous glucose production is derived from the liver by processes such as gluconeogenesis and glycogenolysis and the remaining 15% is produced in the kidney (DeFronzo, 2004). The hepatic glucose production is regulated by glucagon, secreted by the pancreatic αcells. In fasting conditions, blood glucagon levels rise in order to increase hepatic gluconeogenesis and match the glucose demand (Marliss et al., 1970). Following a postprandial situation, glucose levels rise rapidly thus challenging glucose homeostasis. Consequently, pancreatic β-cells immediately respond to hyperglycaemia by secreting insulin. Insulin acts on different tissues in order to restore glucose homeostasis. Glucagon secretion is inhibited by insulin action on pancreas, which in turn contributes to diminish hepatic glucose production. Glucose uptake is stimulated by the action of insulin on peripheral tissues mainly the skeletal muscle, but also in the liver and the adipose tissue. Additionally, insulin directly inhibits the hepatic glucose production. In the. 5.
(21) Introduction adipose tissue, insulin inhibits lipolysis, the process by which this organ releases free fatty acids (FFA) from stored triglycerides. The decline in circulating FFA further increases muscle glucose uptake and contributes to the inhibition of hepatic glucose production (DeFronzo, 2004). The final consequence of insulin action is the return of glucose levels back to normal. Thus, any alteration affecting the normal function of β-cells, liver, skeletal muscle or adipose tissue can lead to situations where glucose homeostasis is not preserved.. 6.
(22) Introduction. 2. TYPE 2 DIABETES MELLITUS. 2.1. Introduction Diabetes Mellitus is a group of chronic metabolic diseases where glucose homeostasis is challenged by high blood glucose levels (hyperglycaemia). It arises when the pancreas does not produce enough insulin, or when the body losses its ability to effectively use it. If it remains untreated, chronic hyperglycaemia can result in long-term complications and damage to various organs and tissues. (American Diabetes Association, International Diabetes Federation, 2013). The vast majority of diabetic patients fall into two broad etiopathogenetic categories: type 1 and type 2 diabetes. Type 1 Diabetes Mellitus, results from an autoimmune attack against the insulin-producing cells in the Pancreas (β-cells) and, as a consequence, are severely damaged or destroyed. As a result of the increased β-cell death, insulin production is highly reduced or even eliminated. Consequently, the compensatory mechanisms to preserve glucose homeostasis are not initiated, leading to hyperglycaemia. Type 2 Diabetes Mellitus is the most common form of the disease accounting for about 90% of the cases diagnosed with diabetes. The onset of this disease usually occurs after the age of 40, reason because it is also known as adult-onset diabetes. This type of Diabetes is related to the appearance of insulin resistance in peripheral tissues. As a result, insulin is less effective at stimulating glucose uptake in insulin-dependent tissues, such as the skeletal muscle and the white adipose tissue. In liver, the insulin-related halting of. 7.
(23) Introduction gluconeogenesis and glycogenolysisis is attenuated, resulting in an increased glucose production. Meanwhile, insulin resistance in the adipose tissue results in an enhanced release of FFA to the circulation. In turn, raised FFA further inhibit glucose uptake by the skeletal muscle (Kelley et al., 1993), and affect β-cell function and viability (McGarry et al., 1999). Moreover, pancreatic β-cells progressively increase the amount of secreted insulin in order to maintain glucose homeostasis. The development of diabetic hyperglycaemia occurs when β-cells fail to further secrete enough insulin to compensate for peripheral insulin resistance (DeFronzo, 2004). This β-cell failure is usually associated to alterations in both the functionality and reduced mass of β-cells (Rhodes, 2005). Although the primary cause of this disease is unknown, it is clear that insulin resistance plays an early role in its pathogenesis and that defects in insulin secretion by pancreatic β-cells are instrumental in the progression to hyperglycaemia (Lowell et al., 2005). Type 2 diabetic patients suffer from an enhanced prevalence of several macro-vascular. and. micro-vascular. complications.. Patients. present. approximately a 4-fold increased risk of heart attack, and coronary heart diseases (AACE report, 2005). As a consequence, they have an increased mortality index compared to general population (Lutgers et al., 2009). Additionally, type 2 diabetes is the leading cause of kidney failure, new cases of blindness in adults and it can give rise to foot problems that can lead to amputations (Ripsin et al., 2009). It is estimated that about a 60% of diabetic patients suffer from one or more of these complications (AACE report, 2005). Apart from the health threat, type 2 diabetes represents a huge economic cost for society. It is estimated that the total direct medical cost in treatments in the European region is over 105.5 billion US dollars a year, which represents approximately 1911 US dollars per patient/year (Zhang et al.,. 8.
(24) Introduction 2010b). Additionally, type 2 diabetes is a significant cause of lost workforce productivity (Goetzel et al., 2003).. 2.2. Epidem iology of type 2 diabetes Type 2 diabetes is the most common metabolic disease in the world and its prevalence is rapidly increasing. In 2010, over 285 million adults worldwide were estimated to be diabetic, 90% of whom had type 2 diabetes. Furthermore, the number of patients has more than doubled since 1980 and by 2030 the number of adults with diabetes is predicted to rise to 439 million people worldwide (Figure 1). In this predicted increase, there is a huge difference between developed and developing countries. The estimated number of adults with diabetes is likely to increase by 69% in developing regions, compared to 20% for the developed countries. In particular, Asia is yet considered as the “diabetes epicenter” in the world, as a result of rapid urbanization, changes in lifestyle and nutrition (Chan et al., 2009). China and India currently are the two top countries with higher number of diabetic patients in the world, and another three Asiatic countries (Pakistan, Indonesia and Bangladesh) are expected to be in the top 10 by 2030. However, North-America is the region with the highest prevalence of the disease (Shaw et al., 2010). Meanwhile in Europe, the number of adult diabetic patients is estimated to be 55 million people, being Russia and Germany the top countries with more patients suffering from the disease (Figure 1).. 9.
(25) Introduction. Figure 1. The number of people with diabetes mellitus (in millions) by region among adults aged 20–79 years for the years 2010 and 2030. (Chen et al., 2011).. In addition to the epidemic increase in the prevalence and number of diabetics, the age of onset of the disease is getting lower. Traditionally considered to be a metabolic disorder exclusively of adults, type 2 diabetes is increasingly appearing amongst younger people, even adolescents and children (Pinhas-Hamiel et al., 2005; Springer et al., 2013).. 2.3. Risk factors for type 2 diabetes Type 2 diabetes mellitus is a result of the interaction between a genetic predisposition and environmental factors that may affect the final incidence of the disease. However, there are several major aspects that predispose to the development of type 2 diabetes.. 2.3.1. Obesity The global epidemics of type 2 diabetes is associated to the rising rates of overweight and obesity. Obesity is characterised by increased fat accumulation in the adipose tissue and other organs, which lead to excessive weight gain to the extent that it may have an adverse effect on health. The Body Mass Index (BMI), defined as the weight in kilograms divided by the square of the height in metres (kg/m2), is an index used to classify adults. 10.
(26) Introduction based on their body weight (WHO, 2012). In 2005, a 23.2% of the global population was considered to be overweight (BMI of 25-30 Kg/m2) and 9.8% obese (BMI of ≥ 30Kg/m2) and, by 2030, the total numbers of both conditions are expected to duplicate and almost triplicate, respectively (Kelly et al., 2008). Nowadays, overweight and obesity are considered the single most important predictors of type 2 diabetes (Hu et al., 2001). In particular, about 90% of type 2 diabetes is attributable to excess weight (Hossain et al., 2007). However, how and where this excessive fat gets distributed in the body is proven of great importance. In humans, fat is mainly located beneath the skin (subcutaneous fat) or around the internal organs (visceral fat). Many investigations demonstrate that excessive fat accumulation in the visceral adipose tissue, but not in the subcutaneous adipose tissue, significantly correlate with insulin resistance and type 2 diabetes (Boyko et al., 2000; Lemieux et al., 1996; Pouliot et al., 1992). In fact, the removal of abdominal subcutaneous fat by liposuction has no net effect on insulin resistance (Klein et al., 2004a). This is in agreement with the fact that not all individuals categorized as obese develop type 2 diabetes (Lebovitz et al., 2005). Nevertheless, there is a clear relationship between excessive fat accumulation and increased risk of developing type 2 diabetes.. 2.3.2. Environmental factors The western and the modern way of life are important participants contributing to the rise of type 2 diabetes and obesity. In our modern society, decreased physical activity, regular overconsumption of high-caloric foods and sedentary lifestyle are common behaviours which are clearly related to the increased prevalence of type 2 diabetes (Hu et al., 2001). This relationship has been dramatically evidenced by studies in migrating populations where the adoption of the western lifestyle progressively increased their prevalence to develop. 11.
(27) Introduction type 2 diabetes (Chan et al., 2009; Mohan, 2004; Motala et al., 2003). On the other hand, diabetic migrated populations returning to their previous way of life highly improved their metabolic profile (O'Dea, 1984). Other environmental factors found to be independently associated with the risk of type 2 diabetes include smoking, sleeping disorders, depression, antidepressant medications and pollution (Chen et al., 2011). The sum of maintaining a body-mass index of 25 or lower, low-calorie and rich fibber diets, regular exercise, smoking abstinence and moderate alcohol consumption is associated with a 90% reduced incidence of type 2 diabetes (Hu et al., 2001).. 2.3.3. Genetic susceptibility In addition to environmental components, there is compelling evidence that genetic factors also affect the pathogenesis of type 2 diabetes. For instance, a family history with type 2 diabetic relatives confers a 3-fold increased risk to develop the disease (Schafer et al., 2011). Additionally, some ethnic populations, such as Pima and Tohono O’odham Indians, present a higher prevalence of type 2 diabetes than other populations exposed to the same environmental risks of developing this disease (Knowler et al., 1978; Livingston et al., 1993). Thanks to the development of genetic techniques such as the candidate gene approach or genome wide association studies (GWAS), various gene variants have been recently discovered to be associated with T2DM. To date, approximately 40 different risk genes for T2DM have been found (McCarthy, 2010). Although the precise molecular mechanisms for many of the gene variants are poorly understood, their influence on insulin sensitivity or insulin secretion have been uncovered on several cases. For instance, common. 12.
(28) Introduction variants in PPARG (which encodes for the PPARγ gene), ADIPOQ (which encodes for adiponectin, a well known insulin-sensitizing hormone) or IRS1 (encoding for the insulin receptor substrate 1, a key protein in the insulin signalling pathway) among others were reported to affect insulin sensitivity. On the other hand, variations in KCNJ11 (encoding for the Kir6.2 subunit of the ATP sensitive channel of β-Cells), SLC30A8 (encoding for ZnT-8, a zinc transporter protein present in insulin granules) or TCF7L2 (encoding for the transcription factor TCF7L2 which controls the expression of the insulin gene) are reported to affect insulin secretion. Actually, the vast majority of the T2DM risk genes appear to affect β-cell function (Schafer et al., 2011). Although the evidence of the genetic influence in the pathogenesis of T2DM, individual risk genes are thought only to contribute to an inherent susceptibility to the disease. For instance, the common variants with the greatest effects on the risk of T2DM (TCF7L2 in Europeans and KCNQ1 in Asians) result in lifetime prevalence rates that are roughly double those seen in persons with none (McCarthy, 2010). The current rise in T2DM is considered to be mainly caused by environmental changes associated to lifestyle (Imamura et al., 2011).. 2.3.4. Another risk factors Low birth weight has been consistently found to be associated with an increased risk of T2DM in later life. Low birth weight due to nutritional deprivation in utero influences later susceptibility to obesity and T2DM (Chen et al., 2011). This has been related to the “thrifty phenotype” hypothesis, that postulates that a pregnant woman can modify the development of her unborn child such that it will be prepared for survival in an environment in which resources are likely to be short (Hales et al., 1992). For instance, adults. 13.
(29) Introduction exposed to famine during fetal life had a worse glucose tolerance status than unexposed individuals. The risk of T2DM owing to inadequate fetal nutrition is likely to be exacerbated by to an affluent nutritional environment in adult life (Chen et al., 2011).. Gestational diabetes (GDM) is another clearly related risk factor for developing type 2 diabetes. GDM consists in high blood glucose levels during pregnancy in women without previously diagnosed diabetes. It is caused when, during pregnancy, the pancreas does not secrete enough insulin, leading to hyperglycaemia. It usually disappears after birth, however women that suffered GDM and their offspring have an increased risk of developing Type 2 diabetes (International Diabetes Federation 2012). 2.4. Etiopathogeny of type 2 diabetes T2D is caused by insulin resistance in peripheral tissues and inappropriate compensatory insulin secretion response, due to the combination of decreased β-cell mass and function. It has been classically accepted that insulin resistance was the primary defect in the progression to Type 2 diabetes. However, now it is known that both peripheral insulin resistance and β-cell dysfunction occur early in the pathogenesis of type 2 diabetes, long before blood glucose values reach a level that is defined as pre-diabetes (fasting glucose levels between 100 mg/dL and 125 mg/dL, ADA). Although the primary cause of this disease is unknown, several mechanisms have been postulated to explain the progression to type 2 diabetes.. As already discussed, type 2 diabetes is linked to obesity and overnutrition. Adipocytes, the cells that primarily compose adipose tissue, have a. 14.
(30) Introduction large capacity to store triglycerides during feeding, as well as to hydrolyse and release triglycerides as FFAs and glycerol during fasting. Apart from their storage function, adipocytes secrete a large number of hormones and cytokines (known as adipokines) that affect energy metabolism in other tissues (Guilherme et al., 2008). As overfeeding develops, adipocytes enlarge as a result of increased triglyceride deposition. This enlargement rises the rates of lipolysis (Arner, 2005), consequently increasing the levels of circulating FFA, and also promotes the secretion of inflammatory cytokines. The action of such cytokines profoundly affects the adipocyte function by further increasing lipolysis and inhibiting TG synthesis (Guilherme et al., 2008). The release of FFA as a result of increased adipose lipolysis, may be the single most critical factor in modulating insulin sensitivity in peripheral tissues (Kahn et al., 2006). The excessive circulating FFAs cause accumulation of triglycerides into nonadipose tissues, such as liver and skeletal muscle, which contribute to the development of insulin resistance in these tissues. (Krssak et al., 1999; Perseghin et al., 1999). Specifically, FFA would promote insulin resistance by inhibiting. glucose. oxidation. (Randle. cycle)(Bevilacqua. et. al.,. 1990).. Additionally, the cytosolic accumulation of triglycerides and derived lipid intermediates, such as ceramides and diacylglycerol (DAG), interfere with the insulin signalling pathway in these tissues, thus promoting insulin resistance. (Muoio et al., 2008). Along with the developing hyperglycaemia resulting from the insulin resistance in peripheral tissues, a chronic elevation in FFA impairs the β-cell secretory function and induces β-cell apoptosis, thus possibly contributing to the β-cell failure and reduced β-cell mass observed in the progression to T2DM (Poitout et al., 2008).. Apart. from. FFA,. inflammatory. cytokines. derived. from. enlarged. adipocytes might be other important factors contributing to the pathogenesis. 15.
(31) Introduction of T2DM during obesity. In particular, TNF-alpha, IL-1β and IL-6 might also have a direct role in the development of insulin resistance in skeletal muscle and liver, as well as β-cell dysfunction.. 2.5. Current treatm ents for type 2 diabetes Several approaches are being used to control type 2 diabetes.. 2.5.1. Lifestyle interventions Because of the effects of excessive body weight on insulin resistance and its correlation with T2DM, the first strategy to treat and prevent this disease focuses on lifestyle changes to reduce patient’s BMI. In order to achieve this goal, lifestyle modification programs basically consist of diet and physical activity interventions. Low-calorie (500-1000 calorie deficit per day) and low-fat meals (25-30% calories form fat) are recommended to reduce body weight. Although many people can lose a 10% of weight in six months with such diets, regular physical activity is needed to maintain body weight and prevent weight regain. Thus, a minimum of 150 minutes of moderate activity per week is recommended. Furthermore, physical activity improves insulin sensitivity independent of weight loss. Short-term studies have demonstrated that moderate weight loss (5% of body weight) in patients with T2DM can improve insulin action, decrease fasting blood glucose and reduce the need for diabetes medications (Klein et al., 2004b). However, making long-term changes to eating and activity behaviours, and consequently keeping weight loss, is extremely difficult for most patients (Bantle et al., 2008).. 2.5.2. Pharmacological treatment When lifestyle interventions are not sufficient to keep glucose control a pharmacological. treatment. must. be. 16. added.. Due. to. the. multiple.
(32) Introduction pathophysiologic changes involved in the progression to T2DM, multiple compounds have been developed with the aim of improving glycaemic control and slowing the onset of the disease. The vast majority of them are focused on improving insulin resistance or enhancing the β-cell function. However, the initial improvements in glycaemia are not sustained because of progressive βcell dysfunction, making of insulin treatment a must. Furthermore, these treatments may also have undesired side effects, such as hypoglycaemia, weight gain and gastrointestinal complications.. Metformin Metformin is the first-line drug of choice for the treatment of T2DM. It reduces the hepatic glucose production and improves insulin sensitivity in the skeletal muscle by activating AMP-Kinase. It does not cause hypoglycaemic episodes and is not associated with body weight gain. It appears to decrease heart attacks, strokes and another cardiovascular complications associated to T2DM (Global guideline for Type 2 Diabetes, IDF 2005). Gastrointestinal intolerance is the most common side-effect and metformin is not indicated for patients with renal insufficiency (Stumvoll et al., 2005).. Sulfonylureas Sulfonylureas increase insulin release by closing the β-cell potassium channels. These drugs lead to moderate decreases in concentrations of plasma glucose in most patients with T2DM. However, they may induce hypoglycaemia as a result of excesses in insulin production and release. Another undesirable effect is that they promote weight gain (Stumvoll et al., 2005). Thiazolidinediones. 17.
(33) Introduction Thiazolidinediones (TZD) are PPARγ agonists that act by redistributing triglycerides from visceral fat depots to other less lipolytic subcutaneous depots, thus lowering circulating FFA. TZDs improve insulin sensitivity in skeletal muscle and liver and ameliorate the inflammatory milieu of T2DM (Stumvoll et al., 2005). However, all TZDs promote weight gain and fluid retention leading to edema and heart failure to predisposed individuals (Tahrani et al., 2011). Additionally, of the two commercially available TZDs in the market, Rosiglitazone is no longer available in the European Union due to increased myocardial infarction (Nissen et al., 2010) and Pioglitazone has been recently associated with bladder cancer and consequently withdrawn from the market in France and Germany (Lewis et al., 2011).. Incretin Mimetics and DPP-4 inhibitors Incretins are a group of gastrointestinal hormones that potentiate glucose-dependent insulin secretion and inhibit glucagon release. They also reduce the gastric emptying, consequently reducing food intake with a longterm effect to help with weight loss. The two main incretins are the glucagonlike peptide-1 (GLP-1) and gastric inhibitory peptide (GIP). However, incretins are rapidly inactivated by the enzyme dipeptidyl peptidase-4 (DPP-4) (Tahrani et al., 2011). Some DPP-4-resistant GLP-1 analogues with GLP-1-receptor agonist properties have been developed to extent their half-life. Another incretin drug based approach has been to increase the circulating concentrations of active GLP-1 and GIP with the development of specific DPP-4 inhibitors. These compounds have been proven to be effective at improving glycaemic control without causing hypoglycaemia and at reducing body weight gain in the case of the GLP-1 analogues. However, these are relatively new drugs. Their long-term safety it is still unknown and some limiting side effects have been described,. 18.
(34) Introduction particularly vomiting and nausea in the case of GLP-1 analogues, and an association with pancreatitis in the use of both (Ratner et al., 2010; Tahrani et al., 2011).. α-Glucosidase inhibitors This class of drugs act as competitive inhibitors of enzymes needed to digest carbohydrates, specifically alpha-glucosidase enzymes in the brush border of the small intestines. It delays the digestion of complex carbohydrates to monosaccharides (glucose) thus reducing the postprandrial glucose pics. Their main drawback is its tendency to cause gastrointestinal side effects (Tahrani et al., 2010).. Meglitidines Meglitidines are a class of drugs that increase insulin release by closing the potassium channels in β-cells in a similar manner to sulfonylureas. However their onset of action and duration of effect is shorter than sulfonylureas. Their action is partially glucose-dependent and thus are less likely to hypoglycaemic episodes (Tahrani et al., 2010). However they still represent a potential side effect. Like sulfonylureas they promote weight gain (Tahrani et al., 2011).. Bile acid sequestrants These drugs have been used as lipid-lowering agents but they also moderately reduce plasma glucose levels. However their glucose-lowering mechanism is currently unknown (Handelsman, 2011). Usually metformin is the first drug to be used along with lifestyle interventions. However, monotherapy alone is not able to maintain long-term glucose control and a second drug needs to be introduced. At this point, there. 19.
(35) Introduction is limited data available to guide endocrinologists on which drug is better to use as a second choice. Advantages and disadvantages of specific drugs for each patient must be considered, increasing the complexity of the treatment. As the progression of the disease advances, the addition of a third drug or even more compounds is necessary to keep glucose homeostasis, further complicating the treatment. When the combination of glucose-lowering drugs and lifestyle interventions are unable to maintain blood glucose control, exogenous insulin therapy is inevitably needed. However, insulin therapy is difficult since it is not easy to achieve and maintain an effective glucose control without significant hypoglycaemic episodes and weight gain (Defronzo, 2009; Inzucchi et al., 2012). The difficulty and complexity of efficient longterm treatments makes of the development of new strategies based on a better understanding of the disease a must.. 2.5.3. Bariatric Surgery Bariatric surgery includes several gastrointestinal operations performed to promote weight loss that can powerfully ameliorate and even reverse T2DM. However, these operations are only recommended to T2DM patients with BMI >35 thus limiting its application to severely obese patients (Robinson, 2009).. 20.
(36) Introduction. 3. THE SKELETAL MUSCLE. The skeletal muscle is the largest organ in the body comprising between 40-50% of body mass. As well as having a role in movement, posture, and force generation it also produces and maintains body heat and plays a central role in body metabolism. The skeletal muscle is made up of large multinuclear cells known as myocytes or muscle fibres. Such fibres contain long bundles of contractile proteins in the cytoplasm, such as myosin and actin. The hydrolysis of ATP by the ATPase activity located in the heavy chain portion of the myosin molecule leads to the contraction of the fibre resulting in the generation of tension. As Figure 2 shows, each individual fibre is separated by a connective tissue known as endomysium. These cells are grouped forming large bundles called fascicles, which are surrounded by a layer of connective tissue called perimysium. The perimysium is an inward projection of a bigger layer called epimysium that surrounds the group of fascicles that form the muscle. Skeletal muscles have an abundant supply of blood vessels and nerves that are distributed through the epimysium (Figure 2).. 21.
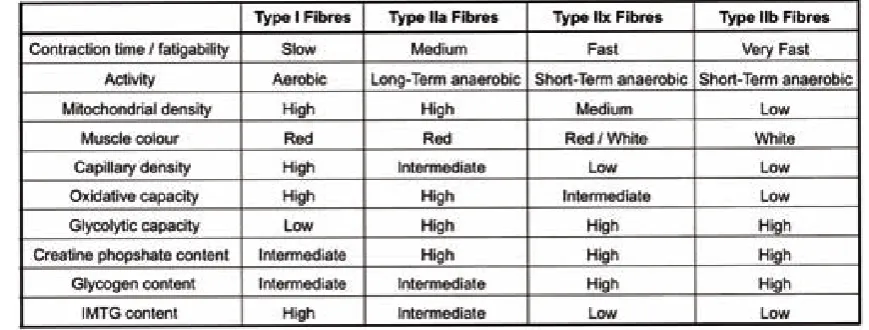
(37) Introduction. Figure 2. Structure of the skeletal muscle.. 3.1. Fibre types In humans, skeletal muscle fibres are classified as Type I, Type IIa and Type IIb depending on the myosin heavy chain (MHC) isoform that they express (Schiaffino, 2010). For instance, Type I fibres express a slow contracting isoform of myosin heavy chain, MHC I. Meanwhile, Type IIa and IIb fibres express a faster contracting isoform of myosin heavy chain, MHC IIa and MHC IIb respectively. Each different fibre type possesses specific metabolic and functional properties. Metabolically, Type I fibres obtain energy from the oxidation of substrates to CO2, reason why they are also known as oxidative fibres. Accordingly, Type I fibres have an elevated number of mitochondria. In contrast, Type IIb fibres (also known as glycolytic fibres) produce energy by anaerobic processes and have a low mitochondrial density. Meanwhile, Type IIa fibres have intermediate metabolic properties between Type I and Type IIb fibres. Mouse skeletal muscles express a fourth type of myosin heavy chain protein, the MHC IIx. Type IIx fibres have proprieties intermediate between IIa and IIb. In Table 1 the characteristics of each fibre type are summarized. Each individual muscle is a mixture of these fibres but their individual proportions vary depending on the action of every specific muscle. Thus, muscles where fast contracting fibres predominate (type II) are adapted to activities that require short and powerful contractions. On the other hand, muscles rich in type I fibres are adapted to endurance activities and have a high resistance to fatigue (Pette et al., 1999). Lifestyle factors like training exercise, inactivity, and age induce fibre type transitions showing the great plasticity of the skeletal muscle in response to stimuli (Scott et al., 2001).. 22.
(38) Introduction. Table 1. Basic Muscle Fibre Type and Metabolic Properties (Mann et al., 2010). 3.2. Skeletal m uscle m etabolism Skeletal muscle can adapt its metabolism to use different energy sources, such as, glucose, free fatty acids, ketone bodies and amino acids depending on its energy demand. In resting conditions, FFAs are its main source of energy. They are metabolized to Acetyl-CoA in the mitochondria by the process of β-oxidation. The resulting Acetyl-CoA enters the Krebs Cycle (also known as the TCA cycle) where it is used to produce CO2 and regenerate NADH. The NADH generated by the TCA cycle is fed into the oxidative phosphorylation pathway where it is used to produce energy in the form of ATP (Figure 3). When energy demands increase, such as during moderate exercise, skeletal muscle can use glucose and circulating ketone bodies in addition to FFA. Myocytes can use glucose derived from the circulation or produced from glucose stores in the cell as glycogen by the process of glycogenolysis. Glucose enters the glycolytic pathway where it is metabolized to acetyl-CoA which. 23.
(39) Introduction immediately enters the TCA cycle. If exercise is very intense, oxygen supply is insufficient to oxidize enough FFA and glucose to produce ATP and satisfy the energy demand. In this situation, the skeletal muscle metabolises glucose to lactate, a process by which ATP is produced without the need of oxygen.. Figure 3. Main metabolic processes leading to ATP production in the skeletal muscle. Glucose is metabolized to pyruvate by the process of glycolysis thus producing energy in the form of ATP. In anaerobic conditions, pyruvate is metabolized to lactate. In aerobic conditions Pyruvate is metabolized to AcetylCoA which enters the TCA cycle. FFAs enter the mitochondria through the carnitine-palmitoyl transferase system (CPT) where they are oxidized to AcetylCoA by the process of β-oxidation. Aminoacids can be metabolized to pyruvate, or enter directly as intermediates in the TCA cycle. The NADH produced in the TCA cycle is fed into the oxidative phosphorylation chain for ATP production.. 3.2.1. Glucose metabolism in the skeletal muscle The skeletal muscle plays a key role in maintaining glucose homeostasis. Following glucose ingestion, approximately 80% of glucose uptake occurs in the skeletal muscle. In this tissue, glucose uptake is facilitated by two different glucose transporters, GLUT1 and GLUT4 (DeFronzo, 2004) (Figure 4). GLUT1. 24.
(40) Introduction is nearly ubiquitous and is thought to be the primarily responsible during the postabsorptive glucose uptake. However, its abundance in the skeletal muscle is substantially lower than that of GLUT4 (Marette et al., 1992). GLUT4 is the insulin-regulated glucose transporter. After exposure to insulin, GLUT4 moves from intracellular vesicles to the plasma membrane where catalyses glucose uptake into the cell (Olson et al., 1996). Once inside the cell, hexokinase (HK) enzymes catalyse the conversion of free glucose to glucose-6-phosphate (G-6P). Of the known isoforms of HK, only HK-I and HK-II are expressed in the skeletal muscle. Insulin increases the expression of HK-II, but not HK-I, so HK-II is considered to be the isoform in skeletal muscle that is subject to insulin action (Vogt et al., 2000). Thus, HK-I, together with GLUT1, mediates the basal glucose uptake and HK-II, along with GLUT4, control the insulin-regulated glucose uptake in the skeletal muscle (Figure 4). Both hexokinases present a very high affinity for glucose and are allosterically inhibited by its product, G-6P (DeFronzo, 2004).. Once phosphorylated by hexokinase II, glucose can be directed to glycogen or to the glycolytic pathway to be used as energy. However, with increasing insulin concentrations, glycogen synthesis predominates.. 25.
(41) Introduction. Figure 4. Role of skeletal muscle in glucose homeostasis. During postabsorptive states, glucose uptake is facilitated by the glucose transporter GLUT1. Once inside the cell, glucose is phosphorylated by HK-I. In fed conditions, elevated glucose levels lead to insulin release by the pancreas. Insulin induces the translocation of GLUT4 to the cell membrane and increases HK-II expression, which together increase glucose uptake and utilization by the skeletal muscle. Once in the cell, glucose is phosphorylated to glucose-6-phosphate by HKII. Glucose-6-phosphate is processed further for either storage, in the form of glycogen, or metabolised, mainly by glycolysis.. 3.2.2. Lipid metabolism in the skeletal muscle. Free fatty acids can account for 90% of skeletal muscle total energy demand during fasting. However, the uptake of FFA by the skeletal muscle in not yet fully understood. The vast majority of FFA enter by a protein-mediated transport mechanism, although passive diffusion can also occur. Several FFA transporters have been identified including fatty acid translocase (FAT/CD36), plasma membrane-bound fatty acid binding protein (FABPpm) and tissuespecific fatty acid transport protein (FATP). Although the relative contribution of each one is not known, CD36 is thought to be the predominant transporter. Once fatty acids are transported into the cytosol, they are esterified to long chain acyl CoAs (LCACoA). A small proportion of LCACoA can be converted to lipid. accumulation. intermediates. such. as. triglycerides,. but. also. to. diacylglycerols (DAG) and ceramides that can act as signalling molecules. However, most of LCACoA are transferred to the mitochondria for oxidation and energy production. LCACoAs enter the mitochondrial membrane by the Carnitine-dependent transport system. LCACoA are combined with carnitine by the carnitine palmitoyltransferase I (CPT1) to form acyl-carnitine, which is transported into the mitochondrial matrix by the carnitine translocase (CAT). Once there, acyl-carnitines are converted back to LCACoAs by the carnitine palmitoyltransferase 2 (CPT2). In this process, CPT1 is considered to be the. 26.
(42) Introduction rate-limiting protein of β-oxidation of FFA. LCACoA then enter the β-oxidation pathway where acetylCoA, NADH and FADH2 are produced as a result of the oxidation of the fatty acid. NADH and FADH2 are directly fed into the oxidative phosphorylation pathway where they are used to produce energy in the form of ATP. Meanwhile, acetylCoA enters the TCA cycle in order to produce energy (Zhang et al., 2010a).. Figure 5. Lipid Metabolism in the skeletal muscle. FFAs enter the myocyte through the transporter proteins CD36, FATP or FABPpm were they are esterified to LCACoa. A small proportion of LCACoa can be stored in the form of triglycerides (TGs) and intermediate products such as ceramides and diacylglycerol. However, the majority of fatty acids are combined with carnitine, thanks to the action of CPT1, and translocated to the mitochondrial matrix by CAT. CPT2 disrupts the Acyl-carnitine complex and the fatty acid is esterified again to LCACoa. Once in the mitochondrial matrix LCACoas are oxidized to AcetylCoa, NADH and FADH2 by the process of β-oxidation.. 27.
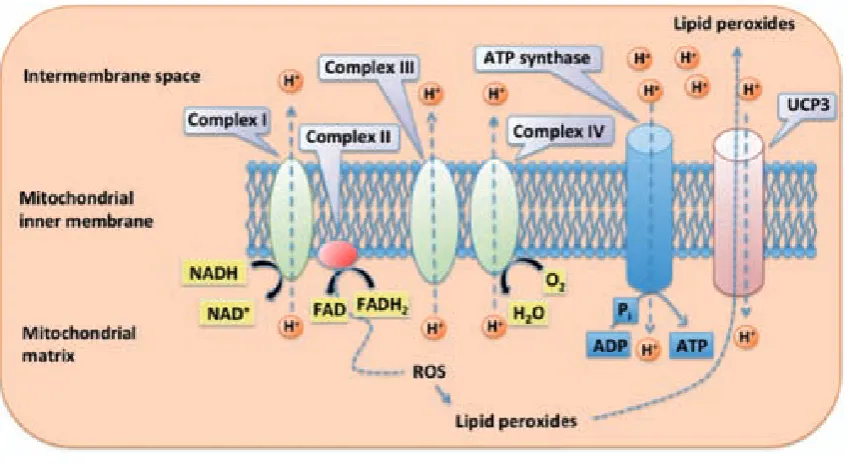
(43) Introduction. 3.2.3. Oxidative phosphorylation and mitochondrial uncoupling The NADH and FADH2 produced by the oxidation of the different energetic substrates are redirected to the inner mitochondrial membrane where the mitochondrial electron transport chain (ETC) produces ATP. ETC is made up of four protein complexes located in the inner mitochondrial membrane. These complexes accept electrons, given by NADH and FADH2. The energy released by electrons flowing through the ETC is used to transport protons (H+) from the mitochondrial matrix towards the intermembranal space thus generating an electrochemical gradient between these two compartments. This gradient is tapped by allowing protons to flow back to the mitochondrial matrix through the enzyme ATP synthase. The energy produced by this movement is used by this enzyme to synthesize ATP from ADP and inorganic phosphate. The final destination of the electron flow is molecular oxygen, which is reduced to H2O. Thus, substrate oxidation and oxygen reduction are coupled to the formation of ATP (Figure 6).. Although oxidative phosphorylation is a vital process, it also is a major site of Reactive oxygen species (ROS) production (Echtay, 2007). These oxygen species are highly damaging since they can react with lipids forming lipid peroxides, which induce mitochondrial and DNA damage. One of the mechanisms that the cell uses in order to reduce ROS and peroxide is to activate mitochondrial uncoupling. Mitochondrial uncoupling is the process by which protons are pumped out of the matrix back into the mitochondria in a process not coupled to ATP synthesis. Thus, part of the H+ gradient generated by the ETC is used by other proteins, known as uncoupling proteins (UCP), located in the inner mitochondrial membrane. This family of proteins is composed by five different members (UCP1-5). The skeletal muscle expresses. 28.
(44) Introduction UCP2, UCP3 and UCP4 being UCP3 almost specific for the skeletal muscle. Although the role of mitochondrial uncoupling in skeletal muscle is nowadays still in discussion, its activation reduces the electrochemical proton gradient leading to reduced production of ROS by the ETC (Echtay, 2007). Additionally, UCPs would also export lipid peroxide species out of the mitochondria as a protective mechanism against oxidative damage during high rates of fatty acid oxidation (Schrauwen et al., 2004). Accordingly, UCP3 expression is elevated during states that are associated with increased fat metabolism like fasting (Millet et al., 1997) or acute exercise (Schrauwen et al., 2002). UCP3 may also increase fatty acid oxidation rates in the skeletal muscle by anion transport (Bezaire et al., 2005).. Figure 6. Scheme of the electron transport chain. All four complexes of the electron transport chain are found in the mitochondrial inner membrane. While electrons are transported across the chain, protons are pumped towards the intermembrane space. The energy of the proton gradient is used by the ATP synthase to generate ATP and/or by UCP3 to separate oxidative phosphorylation from ATP synthesis. ROS are produced by the electron transport chain. 29.
(45) Introduction and react with phospholipids resulting in lipid peroxides. UCP3 exports lipid peroxide anions out of the mitochondrial matrix.. 3.3. Skeletal m uscle and type 2 diabetes During post-prandial states, the skeletal muscle uses glucose as a primary source of energy in response to the increasing insulin concentrations in blood. However during fasting, when insulin levels are low, the metabolism of the skeletal muscle switches to fat oxidation. This switch is a measure to keep glucose homeostasis when blood glucose concentrations are low (during fasting) or suddenly rise and need to be rapidly decreased (post-prandial states). This adaptable capacity of the skeletal muscle is known as metabolic. flexibility. However, during type 2 diabetes and in insulin resistance states this flexibility is greatly reduced. In these situations, the skeletal muscle is characterised by lower fasting lipid utilization and the inability to switch to carbohydrate uptake and oxidation in response to insulin (Kelley, 2005; Ukropcova et al., 2005). As a consequence lipids accumulate in the skeletal muscle and blood glucose levels rise (Figure 7).. 30.
(46) Introduction. Figure 7. Muscle metabolic inflexibility during type 2 diabetes (Kelley, 2005).. 3.3.1. Role of reduced glucose phosphorylation of the skeletal muscle in type 2 diabetes During insulin resistance states the ability of insulin to induce glucose uptake by the skeletal muscle is greatly reduced. Both insulin-mediated glucose transport and phosphorylation have been shown to be impaired in type 2 diabetic subjects (DeFronzo, 2004). Accordingly, the activity of HK-II and the presence of GLUT4 in the plasma membrane are reduced in insulin resistance conditions (Pendergrass et al., 1998; Zierath et al., 1996). Thus, the skeletal muscle is unable to metabolize blood glucose normally. Even tough glucose transport and phosphorylation are reduced, the fact that free glucose (nonphosphorylated) concentrations are increased in the skeletal muscle of type 2 diabetic. patients. evidences. that. the. rate. of. intracellular. glucose. phosphorylation is impaired to a greater extent than glucose transport (Bonadonna et al., 1996). This suggests that reduced glucose phosphorylation in the skeletal muscle may be the rate-limiting step for glucose use in type 2 diabetic individuals (Abdul-Ghani et al., 2010).. 3.3.2. Role of reduced oxidative capacity of the skeletal muscle in type 2 diabetes Elevations in circulating FFA are common in insulin resistant conditions such as obesity and type 2 diabetes and excessive lipid accumulation of fatty acids and/or lipid metabolites in muscle has emerged as an important contributor to insulin resistance. Additionally, several studies have reported decreased fat oxidation in skeletal muscle of insulin resistant individuals. 31.
(47) Introduction independent of the plasma FFA concentration (Blaak, 2004; Kelley et al., 1999). Since the majority of fat oxidation takes place in the mitochondria, impaired fat oxidation in the skeletal muscle of insulin resistant individuals suggests the presence of mitochondrial defects that contribute to the impaired fat oxidation. Accordingly, the activity of β-oxidative enzymes (Simoneau et al., 1999), the size and number of mitochondria (Morino et al., 2005; Ritov et al., 2005) as well as the activity of proteins in the respiration chain (Befroy et al., 2007; Szendroedi et al., 2007) have been found to be reduced in the skeletal muscle of type 2 diabetic individuals. Therefore, the increase in circulating FFA along with the decrease in fat oxidation capacity leads to the accumulation of fatty acids and triglycerides in the skeletal muscle.. 3.3.3. Molecular mechanisms of lipid-induced insulin resistance in the skeletal muscle When the uptake of fatty acids exceeds the rates of β-oxidation, intramuscular TG can accumulate. Associated with the accumulation of TG, the abundance of lipid metabolites such as LCACoAs, DAGs and ceramides increase in the skeletal muscle. The presence of these lipid species is associated with the activation of a number of different serine kinases that negatively modulate insulin action (Zhang et al., 2010a). For instance, DAG has been found to be increased in skeletal muscle from insulin-resistant rodents (Avignon et al., 1996) and humans (Itani et al., 2002). The accumulation of DAG is positively correlated with the increased activity of the protein kinase C Theta (PKCθ), known to impair insulin signalling via serine phosphorylation of IRS-1 (Itani et al., 2001; Itani et al., 2000; Yu et al., 2002). Nowadays, DAG activation of PKCs is considered a major determinant of lipid-induced insulin resistance (Timmers et al., 2008). Ceramides have been postulated to inhibit muscular insulin action. 32.
(48) Introduction via the inhibition of Akt phosphorylation in obese insulin resistant humans (Adams et al., 2004; Hajduch et al., 2001). Thus, the accumulation of triglycerides in the skeletal muscle and its derivate metabolites is associated with the development of insulin resistance.. 3.4. Novel Strategies to counteract type 2 diabetes by the genetic m odification of the skeletal m uscle Strategies to increase glucose phosphorylation have been tested in order to increase glucose use by the skeletal muscle and hence to ameliorate insulin resistance. Transgenic mice overexpressing HK-II in the skeletal muscle showed an increase in insulin mediated muscular glucose uptake (Chang et al., 1996). However, this effect was lost when diabetes was induced in these animals by feeding with a high fat diet (Fueger et al., 2004). The expression of the liver hexokinase-IV enzyme (HK-IV, also known as Glucokinase) in the skeletal muscle of transgenic mice led to increased glucose use by the skeletal muscle (Otaegui et al., 2000). Furthermore, the overexpression of HK-IV showed to ameliorate type 2 diabetes in diabetic Zucker fatty rats (a model of type 2 diabetes and obesity) and in mice fed with a high fat diet (JimenezChillaron et al., 2002; Otaegui et al., 2003). These results suggest that the expression of Gck in the skeletal muscle could become a good therapeutic approach or type 2 diabetes.. Some strategies to prevent lipid accumulation and hence, improve insulin sensitivity, are based on the concept of enhancing fatty acid β-oxidation in the skeletal muscle. For instance, the overexpression of CPT-1 in the skeletal muscle of HFD fed mice resulted in enhanced rates of fatty acid oxidation and improved high-fat diet-induced insulin resistance. These improvements were associated with a reduction in the muscular TG content along with reductions in. 33.
(49) Introduction DAG and ceramides (Bruce et al., 2009). Knock-out animals for acetyl-CoA Carboxilase 2 (ACC2), an enzyme that catalyses the production of the allosteric. CPT-1. inhibitor. Malonyl-CoA,. showed. enhanced. fat. oxidation,. improved insulin sensitivity and reductions in DAG and PKC activity in the skeletal muscle (Choi et al., 2007b). The specific muscular overexpression of UCP3 led to protection against high fat diet-induced obesity with improved insulin sensitivity in mouse (Choi et al., 2007a). Thus, the modulation of the oxidative capacity in the skeletal muscle represents a possible therapeutic target for type 2 diabetes mellitus. In agreement, the increase in the activities of the peroxisome proliferator-activated receptor-gamma co-activator 1 alpha (PGC1α), a master regulator of the oxidative function and mitochondrial biogenesis in the skeletal muscle, and the peroxisome proliferator activated receptor-delta (PPARδ), a master transcriptional regulator of the fatty acid catabolism program in the skeletal muscle, have been proposed as promising strategies to counteract type 2 diabetes and obesity (McCarty, 2005; Salvado et al., 2012).. 4. GLUCOKINASE The hexokinase-IV, or glucokinase (GCK), is one of the four mammalian hexokinases that catalyse the conversion of glucose to G-6-P by ATP. Like the other hexokinases, GCK shows the ability to phosphorylate different hexoses. 34.
Figure


+7


Documento similar
Fatty acid composition (% of total fatty acids) of oils obtained by PLE at 60ºC with 3. dichloromethane/methanol (2:1) (D:M) and ethanol (EtOH) from LOCS
Also, a very recent report demonstrates that the loss in self-renewal detected in satellite cells from aged mice can be overcome by p38α/β inhibition (Bernet and Rudnicki,
tuberculosis adaptation to a fatty acid environment, we developed an in vitro model where bacilli were grown in even-length long-chain fatty acids (LC-FAs) as the sole carbon
The characterization in amino acids, organic acids, sugars, trigonelline, volatiles compounds, fatty acids, total phenolic, carotenoids, vitamin C content, and antioxidant capacity
Pediatric patients with Type 2 Diabetes Mellitus will have a worse fatty acid profile associated with inflammation compared with patients with Metabolic Syndrome
The fatty acid ethyl esters mixture, a fish oil residue obtained after the extraction of omega-3 polyunsaturated fatty esters, has been converted into mixtures of
We can also observe in the figure the active site of the AT where the malonyl-CoA should bind to the protein to initiate the synthesis of polyunsaturated fatty acids.. In
In the present study, gene expression of candidate genes for fatty acid composition in muscle showed sex-dimorphism and breed effects, and gene co-expression in different
