Enhancing biological control in apple orchards
Jaume Lordan Sanahuja
Dipòsit Legal: L.1233-2014 http://hdl.handle.net/10803/275941
ADVERTIMENT. L'accés als continguts d'aquesta tesi doctoral i la seva utilització ha de respectar els drets
de la persona autora. Pot ser utilitzada per a consulta o estudi personal, així com en activitats o materials d'investigació i docència en els termes establerts a l'art. 32 del Text Refós de la Llei de Propietat Intel·lectual (RDL 1/1996). Per altres utilitzacions es requereix l'autorització prèvia i expressa de la persona autora. En qualsevol cas, en la utilització dels seus continguts caldrà indicar de forma clara el nom i cognoms de la persona autora i el títol de la tesi doctoral. No s'autoritza la seva reproducció o altres formes d'explotació efectuades amb finalitats de lucre ni la seva comunicació pública des d'un lloc aliè al servei TDX. Tampoc s'autoritza la presentació del seu contingut en una finestra o marc aliè a TDX (framing). Aquesta reserva de drets afecta tant als continguts de la tesi com als seus resums i índexs.
ADVERTENCIA. El acceso a los contenidos de esta tesis doctoral y su utilización debe respetar los
derechos de la persona autora. Puede ser utilizada para consulta o estudio personal, así como en actividades o materiales de investigación y docencia en los términos establecidos en el art. 32 del Texto Refundido de la Ley de Propiedad Intelectual (RDL 1/1996). Para otros usos se requiere la autorización previa y expresa de la persona autora. En cualquier caso, en la utilización de sus contenidos se deberá indicar de forma clara el nombre y apellidos de la persona autora y el título de la tesis doctoral. No se autoriza su reproducción u otras formas de explotación efectuadas con fines lucrativos ni su comunicación pública desde un sitio ajeno al servicio TDR. Tampoco se autoriza la presentación de su contenido en una ventana o marco ajeno a TDR (framing). Esta reserva de derechos afecta tanto al contenido de la tesis como a sus resúmenes e índices.
WARNING. Access to the contents of this doctoral thesis and its use must respect the rights of the author. It
Enhancing biological control in apple
orchards
DISSERTATION
to obtain the degree of Doctor by the University of Lleida
MEMÒRIA DE TESI
per optar al grau de Doctor per la Universitat de Lleida
by
per
Jaume Lordan Sanahuja
Directors:
Dra. María José Sarasúa Saucedo
Dra. Georgina Alins Valls
Assessment commitee
Membres del Tribunal
Dr. Jesús Avilla Hernández
Centre UdL-IRTA
Dr. Xavier Espadaler Gelabert
Universitat Autònoma de Barcelona (UAB)
Dr. Marcos Miñarro Prado
Servicio Regional de Investigación y Desarrollo Agroalimentario (SERIDA)
Dra. Cristina Chocarro Gómez
UdL
Dra. Adriana Escudero Colomar
“Tot sembla impossible fins que es fa”
Nelson Mandela
I
Agraïments
A la Sara i la Georgina, per engrescar-me, per empenyem dins el bosc i estirar-me fora, per l'humor i l’ajuda, per ser més que les directores d’aquesta tesi.
Al Simó, per obrir-me les portes de l'IRTA, per facilitar-me totes les eines, pels bons consells i la confiança.
A l’IRTA per la concessió de la beca predoctoral.
Al Jesús per l’ajuda i unes paraules que m’han guiat: publish or perish.
Al Fernando per l'entusiasme. A l’Ana per l’acollida a l’UAB i els seus brownies.
To Pia, Antoinette, John, Matthew, Ken, Juanita, Ruan, Noma and Assumpta, thank you so much for your warm welcome in South Africa.
A la Marta i la Mònica, per acollir-me a la UB i ensenyar-me el món dels mírids. Al Ferran, per ensenyar-me els secrets de l’anàlisi multivariant.
Al Jordi, el Joel i l’Aritz, per ajudar-me en la identificació de les espècies vegetals dels mostrejos de biodiversitat.
Al Ricardo, per donar-me un cop de mà en l’anàlisi estadístic.
Al Ramon, per ajudar-me en la burocràcia del màster i resoldre dubtes en l’estadística.
A Germans Coll SL, Fruit Nature SAT i SAORT SCP per deixar-me fer el seguiment de les tisoretes i llanut a les seves parcel·les.
Al Departament de Producció Vegetal i Ciència Forestal de la Universitat de Lleida, per facilitar-me l’accés i ús de les seves instal·lacions.
Al Cristian per desconnectar amb les tertúlies del Barça. Al Miquel, companyia i humor en les llargues tardes solitàries. Al Luis per ensenyar-me que professionalitat i humor poden anar perfectament lligats. A l'Estanis per portar-me
sempre l'última en tot tipus de gadgets. A la Laura per fer-nos tocar de peus a terra
II
A la Lourdes, la Neus, el Sergio, la Rosana i l’Alex per l'ajuda en la identificació dels “bitxos”.
Al Joan per la bona companyia i tertúlies esportives en les visites al lab. A la Rosa,
per tot el material facilitat per las cortapichas. A la Carmen i la Dolors, per les
bones estones; i a tota la resta de gent que vam coincidir al lab: Agnès, Alberto Belén, Byrappa, César, Diego, Filipe, Marina, Matilde, Mayte, Meritxell, Miquel, Mònica, Tânia, Pedro i Xavier.
Al fabulós equip d’AKIS International, pels bons consells i ajuda.
Als Nòmadesbtt, perquè entre pedalada i pedalada també han hagut de sentir alguna explicació de biodiversitat.
A la colla del poble i de la uni, per la festa i sopars, per recordar-me que no tot és treballar.
Albert, David, Enric, Oriol, Sergi, Helena, Enric, Ivan, Jaume, Jesús, Joan, Jordi, Josep, Laia, Marià, Xavier, Gerard, Jordi, Josep, Manu, Marc i Xavier, l’amistat és el veritable tresor que tenim.
Als tiets i cosins, Joaquim, Mercè, Bartomeu, Carme, Xavier, Marta, Josep Mª, Esther, Núria, Enric, Ricard, Paz, Carla, Guillem, Marc, Pau, Júlia, Mariona i Quim, sempre junts.
A la padrina Maria i als padrins que ja no hi són, sempre tinc un record per vosaltres.
Al Jaume i la Carme, per acollir-me com un fill més.
A la Glòria, la millor cunyada, la germana que mai he tingut.
Al Joan, germà, amic, company de ruta, perquè ja des de ben petits que ho compartim tot, perquè continuï sent així.
Als meus pares, per l'estima, el sacrifici, l'educació, els valors, per tot. I a tu Núria, pel que hem viscut, pel dia a dia, però sobretot pel que vindrà.
Abstracts
III
Resum
Depredadors, parasitoides i entomopatògens són els pilars de les estratègies actuals de control integrat de plagues, els quals poden contribuir a una agricultura més eficient i sostenible. Conèixer la seva presència i fenologia és molt important per tal d’afavorir els enemics naturals més eficaços contra cada plaga en concret. L'objectiu general d'aquesta tesi és conèixer la presència de les tisoretes en les parcel·les de pomera mediterrànies, la seva fenologia i avaluar les infraestructures ecològiques que podrien millorar el control biològic mitjançant la promoció de
fauna auxiliar. Es va avaluar la interacció del pugó llanut Eriosoma lanigerum
Hausmann amb els enemics naturals i les variables climàtiques.
La tisoreta comuna Forficula auricularia Linnaeus i Forficula pubescens Gené
(Dermaptera : Forficulidae ) van ser les espècies més abundants en les parcel·les mediterrànies. Aquestes dues espècies es poden trobar durant tot l'any, coexistint en els arbres. Donat el seu llarg període d'activitat, poden tenir un paper decisiu com a depredadors. L’ús de refugis impregnats amb la feromona d’agregació de les tisoretes pot ser una eina útil per tal d’afavorir-les com a depredadors en plantacions de fruita de llavor però també per capturar-les en finques de fruita de
pinyol. Es va observar que un refugi impregnat per 0,2 individus/cm2 durant una
setmana tenia una capacitat d’atracció de tisoretes durant 5 setmanes amb un abast de 50 cm.
Es va avaluar la compatibilitat entre la tisoreta i nematodes entomopatògens
(NEPs). Steinernema carpocapsae va ser l'únic NEPs capaç de matar-la. No
obstant, la tisoreta pot detectar la presència de S. carpocapsae i per tant evitar els
refugis tractats amb nematodes. També es va observar una activitat dissuassòria en
larves de carpocapsa Cydia pomonella L. (Lepidoptera: Tortricidae) mortes per
NEPs, reduint l’alimentació de la tisoreta sobre cadàvers que contenien nematodes al seu interior, suggerint una compatibilitat entre la tisoreta i NEPs.
La presència de tisoretes i aranyes (Araneae) es va observar all llarg de tot l’any, però tan sols les tisoretes van contribuir a reduir les infestacions de pugó llanut. La migració dels primers estadis nimfals de pugó llanut amunt i avall del tronc es dóna des de la primavera fins a la tardor; les re-infestacions en les regions mediterrànies s’originen tant a partir de colònies aèries com subterrànies. D’aquesta manera, el control d'aquest pugó cal que estigui dirigit tant cap a les
colònies aèries com a les arrels. El parasitoide Aphelinus mali Haldeman va
aparèixer quan les infestacions aèries ja estaven desenvolupades, sent capaç de controlar el pugó llanut tant sols quan el nivell d'infestació era baix.
L'ús d’infraestructures ecològiques pot augmentar el control biològic de plagues, proporcionant un entorn més favorable i aliments i refugis alternatius als enemics
naturals. Anacyclus clavatus Desf., Dorycnium pentaphyllium Scop., Erucastrum
Abstracts
IV
L., Medicago sativa L., Moricandia arvensis L., Salsola kali L., Sorghum halepense (L.) Pers., Suaeda spicata Willd. i Verbena sp. a la tardor es van observar com flora autòctona útil per proporcionar refugi i aliment a les aranyes. Quaranta-tres espècies d'arbres i arbustos es van mostrejar per avaluar la seva idoneïtat per a ser utilitzats en tanques vegetals per afavorir la fauna auxiliar.
Abstracts
V
Resumen
Depredadores, parasitoides y entomopatógenos son los pilares de las estrategias actuales de control integrado de plagas, los cuales pueden contribuir a una agricultura más eficiente y sostenible. Conocer su presencia y fenología es muy importante para favorecer los enemigos naturales más eficaces contra cada plaga en concreto. El objetivo general de esta tesis es conocer la presencia de las tijeretas en las parcelas mediterráneas de manzano, su fenología y evaluar las infraestructuras ecológicas que podrían mejorar el control biológico mediante la promoción de fauna auxiliar. Se evaluó la interacción del pulgón lanígero
Eriosoma lanigerum Hausmann con los enemigos naturales y variables climáticas.
La tijereta común Forficula auricularia Linnaeus y Forficula pubescens Gené
(Dermaptera: Forficulidae) fueron las especies más abundantes en las parcelas mediterráneas. Estas dos especies se pueden encontrar durante todo el año, coexistiendo en los árboles. Dado su largo periodo de actividad, pueden tener un papel decisivo como depredadores. El uso de refugios impregnados con la feromona de agregación de las tijeretas puede ser una herramienta útil para favorecerla como depredador en plantaciones de frutales de pepita pero también para capturarlas en frutales de hueso. Se observó que un refugio impregnado por
0,2 individuos/cm2 durante una semana tenía una capacidad de atracción de
tijeretas durante 5 semanas con un alcance de 50 cm.
Se evaluó la compatibilidad entre la tijereta y nematodos entomopatógenos
(NEPs). Steinernema carpocapsae fue el único NEPs capaz de matarla. No
obstante, la tijereta puede detectar la presencia de S. carpocapsae y evitar refugios
tratados con nematodos. También se observó una actividad disuasoria en larvas de
carpocapsa Cydia pomonella L. (Lepidoptera: Tortricidae) muertas por NEPs,
reduciendo la alimentación de la tijereta sobre cadáveres que contenían nematodos en su interior, sugiriendo una compatibilidad entre la tijereta y NEPs.
La presencia de tijeretas y arañas (Araneae) se observó durante todo el año, aunque sólo las tijeretas contribuyeron a reducir las infestaciones de pulgón lanígero. La migración de los primeros estadios ninfales de pulgón lanígero arriba y abajo del tronco se da desde la primavera hasta el otoño; las re-infestaciones en las regiones mediterráneas se pueden originar tanto a partir de las colonias subterráneas como de las aéreas. Por tanto, el control de este pulgón debe dirigirse tanto a las colonias
aéreas como a las raíces. El parasitoide Aphelinus mali Haldeman apareció cuando
las infestaciones aéreas ya estaban desarrolladas, siendo capaz de controlar el pulgón lanígero sólo cuando el nivel de infestación era bajo.
El uso de infraestructuras ecológicas puede aumentar el control biológico de plagas, proporcionando un entorno más favorable y alimentos y refugios
alternativos a los enemigos naturales. Anacyclus clavatus Desf., Dorycnium
pentaphyllium Scop., Erucastrum nasturtiifolium Poiret, Euphorbia serrata L.,
Abstracts
VI
primavera, y Atriplex sp., Dittrichia viscosa L., Medicago sativa L., Moricandia
arvensis L., Salsola kali L., Sorghum halepense (L.) Pers., Suaeda spicata Willd. y
Verbena sp. en otoño se observaron como flora autóctona útil para proporcionar refugio y alimento a las arañas. Cuarenta y tres especies de árboles y arbustos fueron muestreados para evaluar su utilidad en setos vegetales para favorecer la
fauna auxiliar. Viburnum tinus L., Euonymous japonicus L. fil. y Pistacia lentiscus
Abstracts
VII
Abstract
Predators, parasitoids and entomopathogens are cornerstones of the current integrated pest management strategies, which can lead to more efficient and sustainable agriculture. Knowledge on their presence and phenology is crucial when promoting the most efficient natural enemies against each target pest. The general aim of this thesis was to know the presence of earwigs within Mediterranean apple orchards, their phenology, and to assess native ecological infrastructures that would improve the biological control through enhancement of
beneficials. Interaction of woolly apple aphid Eriosoma lanigerum Hausmann with
natural enemies and climate variables was assessed.
The European earwig Forficula auricularia Linnaeus and Forficula pubescens
Gené (Dermaptera: Forficulidae) were the most abundant species within Mediterranean apple orchards. These two species can be found throughout the year and co-occurred in canopies. Given their long activity period, they may play a crucial role as biocontrol predators. Impregnated shelters may be useful to promote earwigs in orchards devoted to pip fruit and also to capture them in those used for
stone fruit production. A shelter impregnated by 0.2 individuals/cm2 over one week
was observed to attract earwigs during 5 weeks with a range of 50 cm.
Compatibility between European earwig and entomopathogenic nematodes (EPN)
was evaluated. Steinernema carpocapsae was the only tested EPN capable of
killing the European earwig. However, the European earwig can detect the
presence of S. carpocapsae and therefore avoid nematode-treated shelters. An
earwig deterrent activity in EPN-killed codling moth Cydia pomonella L.
(Lepidoptera: Tortricidae) larvae that reduces the foraging of European earwig on insect cadavers containing nematodes was also observed, suggesting compatibility between the European earwig and EPNs.
European earwigs and spiders (Araneae) were found throughout the year, but only earwigs contributed to reduce woolly apple aphid infestations. Woolly apple aphid crawlers migrate upward and downward from spring to autumn; winter temperatures did not kill the canopy colonies, and both canopy and root colonies are the source of reinfestations in Mediterranean areas. Thus the control of this
aphid in such environments should focus on roots and canopy. Aphelinus mali
Haldeman appeared when aerial infestations were already developed, and it was able to control woolly apple aphid when the level of infestation was low.
The use of ecological infrastructures may increase the biological control of pests, providing a more favorable environment and additional food and shelter for natural
enemies. Anacyclus clavatus Desf., Dorycnium pentaphyllium Scop., Erucastrum
nasturtiifolium Poiret, Euphorbia serrata L., Hedysarum confertum Desf., Papaver rhoeas L., Trifolium pratense L. in spring, and Atriplex sp., Dittrichia viscosa L.,
Medicago sativa L., Moricandia arvensis L., Salsola kali L., Sorghum halepense
Abstracts
VIII
flora useful to provide shelter and food for spiders. Forty-three species of trees and shrubs were sampled to evaluate their suitability to be used in hedgerows to
enhance beneficials. Viburnum tinus L., Euonymous japonicus L. fil.and Pistacia
TABLE OF CONTENTS
AGRAÏMENTS ... I
RESUM ... III
RESUMEN ... V
ABSTRACT ... VII
CHAPTER I. GENERAL INTRODUCTION ... 1
1.TOWARDS SUSTAINABLE AGRICULTURE ... 3
2.AIMS AND OUTLINE OF THE THESIS ... 6
CHAPTER II. PHENOLOGY AND INTERSPECIFIC ASSOCIATION OF FORFICULA AURICULARIA AND FORFICULA PUBESCENS IN APPLE ORCHARDS ... 7
1.INTRODUCTION ... 9
2.MATERIALS AND METHODS ... 10
2.1. Phenology ... 10
2.2. Evaluation of the day degree models ... 11
2.3. Data analysis ... 12
3.RESULTS ... 13
3.1. Phenology ... 13
3.2. Aggregation behavior and interspecific association ... 15
3.3. Evaluation of the day degree models ... 16
4.DISCUSSION ... 17
5.SUPPLEMENTARY MATERIAL ... 21
CHAPTER III. AGGREGATION BEHAVIOR IN THE EUROPEAN EARWIG: RESPONSE TO IMPREGNATED SHELTERS ... 27
1.INTRODUCTION ... 29
2.MATERIALS AND METHODS ... 30
2.1. Aggregation behavior in field conditions ... 30
2.2. Aggregation pheromone trials ... 31
2.3. Shelter impregnation by the aggregation pheromone ... 31
2.4. Range of pheromone perception ... 32
2.5. Data analysis ... 32
3.RESULTS ... 33
3.1. Aggregation behavior in field conditions ... 33
3.2. Aggregation pheromone ... 34
3.2.1. Shelter impregnation by the aggregation pheromone ... 34
3.2.2. Range of pheromone perception ... 35
4.DISCUSSION ... 35
4.2. Aggregation pheromone ... 36
CHAPTER IV. COMPATIBILITY BETWEEN FORFICULA AURICULARIA AND ENTOMOPATHOGENIC NEMATODES TO BE USED IN POME FRUIT PEST MANAGEMENT 39 1.INTRODUCTION ... 41
2.MATERIALS AND METHODS ... 42
2.1. Earwig and nematode source ... 42
2.2. Experiment 1 - Susceptibility ... 43
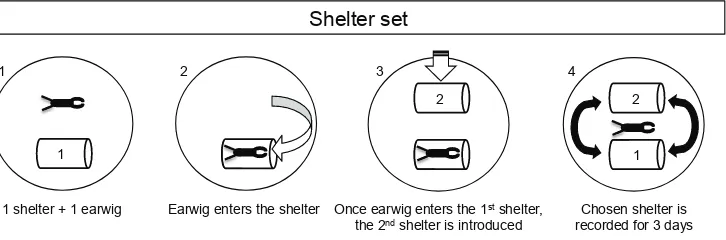
2.3. Experiment 2 - EPN avoidance ... 43
2.4. Experiment 3 - Deterrent activity ... 44
2.5. Data analysis ... 44
3.RESULTS ... 45
3.1. Experiment 1 - Susceptibility ... 45
3.2. Experiment 2 – EPN avoidance ... 46
3.3. Experiment 3 - Deterrent activity ... 48
4.DISCUSSION ... 48
CHAPTER V. WOOLLY APPLE APHID ERIOSOMA LANIGERUM HAUSMANN ECOLOGY AND ITS RELATIONSHIP WITH CLIMATIC VARIABLES AND NATURAL ENEMIES IN THE MEDITERRANEAN AREAS ... 53
1.INTRODUCTION ... 55
2.MATERIALS AND METHODS ... 56
2.1. Study orchards ... 56
2.2. Crawler movement ... 57
2.3. WAA aerial infestation and parasitism ... 58
2.4. Winter survival of WAA aerial colonies ... 58
2.5. Data analysis ... 58
3.RESULTS AND DISCUSSION ... 59
3.1. WAA ecology in Mediterranean areas ... 59
3.2. Winter survival and role of natural enemies ... 61
3.3. A multi-lateral approach to the role of biotic and climatic data on the ecology of WAA ... 63
4.CONCLUSIONS ... 68
CHAPTER VI. DIVERSITY AND ABUNDANCE OF SPIDERS IN THE FLORA OF THE FRUIT AREA AROUND LLEIDA (NESPAIN) ... 71
1.INTRODUCTION ... 73
2.MATERIALS AND METHODS ... 73
2.1. Sample collection ... 73
2.2. Sample processing ... 74
3.RESULTS & DISCUSSION ... 74
3.1. Samples collected ... 74
3.2. Spiders in plants ... 74
CHAPTER VII. ENHANCING BENEFICIALS THROUGH HEDGEROW DESIGN ... 77
2.MATERIALS AND METHODS ... 80
2.1. Survey ... 80
2.2. Experimental trial ... 80
2.3. Sample processing ... 81
2.4. Data analysis ... 81
3.RESULTS ... 82
3.1. Survey ... 82
3.2. Experimental trial ... 86
4.DISCUSSION ... 91
CHAPTER VIII. GENERAL DISCUSSION ... 95
1.EARWIGS IN MEDITERRANEAN APPLE ORCHARDS ... 97
2.WOOLLY APPLE APHID AND ITS INTERACTION WITH CLIMATIC VARIABLES AND NATURAL ENEMIES ... 98
3.BIODIVERSITY MANAGEMENT TO IMPROVE BIOLOGICAL CONTROL ... 99
4.FUTURE RESEARCH ... 100
5.CONCLUSIONS ... 101
Tables
Table II-1. Taylor’s parameters for each orchard and species; b indicates when the population in shelters was regular (b < 1), random (b = 1) or aggregated (b > 1). ... 15 Table II-2. Estimated appearance dates for the first and maximum number of
individuals of each European earwig developmental stage according to the day degree model (Model) and observations (Tree and Ground). ... 16 Table II-3. Observed and accumulated degree days (DD > 6°C, from 1 January on)
for first and maximum number of European earwig individuals for each developmental stage found in tree canopies. ... 17 Table III-1. Number of European earwig individuals (i) (mean ± SE) found inside
pheromone-impregnated shelter (P) and non-impregnated shelter (C) for each treatment depending on the individuals that impregnated the shelter (10i, 20i and 40i) and the number of weeks post-impregnation that the shelter was evaluated (w0, w1, w2, w3, w5, w7 and w9). ... 34
Table III-2. Number of European earwigs (mean ± SE) found inside each
pheromone-impregnated shelter (P) and non-impregnated shelter (C) for each distance. ... 35 Table IV-1. Mortality of the European earwig after 17 days of exposure to
Steinernema carpocapsae, S. feltiae and Heterorhabditis bacteriophora at 50 IJs/cm2. ... 45 Table V-1. Interval and mean number of aphids for each category according to the
qualitative index. ... 57
Table V-2. Number (Mean ± SEM) of annual cumulative woolly apple aphid
crawlers per orchard on the lower (Up) and upper (Down) bands. Column values followed by different letters or asterisk indicate significant differences within orchards, as determined by the Tukey HSD test (P < 0.05). ... 61 Table V-3. AI (percentage of shoot length occupied by woolly apple aphid, mean ±
SEM) at the end of June 2012 for the BB orchard in the winter survival trial. Values followed by different letters indicate significant differences, as determined by the Kruskal-Wallis test and Steel-Dwass method (P < 0.05). 62
Table V-4. Crawlers (up, down and canopy), A. mali and predators (earwigs,
spiders and velvet mites) trapped on the glue tapes and the AI (mean monthly percentage of the total year data from all the orchards in 2011-2012). Higher presence is shown by darker cells. Note that parasitism is represented by the mean recorded parasitism (%) for each month of all the years and of all three orchards. ... 62 Table VII-1. Surveyed tree and shrub species with their flowering period and
average number (mean ± SE) of predators, parasitoids, and food for
Table VII-2. Abundance, richness, and evenness index (mean ± SE) in spring and
fall for each tree/shrub species in the experimental trial in 2012. Values followed by different letters indicate significant differences, as determined by ANOVA and Tukey HSD or Kruskal-Wallis tests (when indicated) (P < 0.05). N = number of samples. ... 89 Table VII-3. Number and percentages of total natural enemies by functional group
(predator or parasitoid), order and family collected during the survey and experimental trial. Immature individuals that were not identified to family level are represented by ^symbol. Blank space indicates that no individuals were found. ... 90
Table sII-1. Monthly average (Mean ± SE) of earwigs found in tree and ground
traps in each orchard (BB, IU, MO and MI) and year (2010-2013). Nymph
instar (N1, N2, N3, N4 and N5) is shown for each earwig species (F.
Figures
Figure II-1. Abundance of Forficula auricularia (a) and Forficula pubescens (b)
(mean ± SE) from April to July per year in BB, IU, MO and MI. Column bars
marked with the same letter or without asterisk indicate no significant differences among years within each orchard according to the Tukey HSD or Welch’s tests (P > 0.05). Note that y-axis scales are different. ... 13 Figure II-2. Number of Forficula auricularia and Forficula pubescens (mean ± SE)
per orchard. Column bars market with an asterisk indicate significant differences among earwig species within orchards according to Welch’s test (P < 0.05). ... 14 Figure II-3. Weekly mean earwig individuals per tree and ground shelters for
Forficula auricularia (a-FA and b-FA) and Forficula pubescens (c-FP and d-FP) throughout the year for nymph stages (N2, N3, N4 and N5) and adults. Note that y-axis scales are different. FA figures were calculated with data from all the orchards and years, whereas FP figures were calculated on the basis of IU 2011-2012 and MI 2012. ... 15 Figure II-4. Monthly interspecific association coefficients between F. auricularia and F. pubescens for IU and MI orchards 2011-2012. A negative value shows active competition, zero no interaction, and a positive value an association between species. ... 16 Figure III-1. European earwig densities (a-b) and aggregation index (IA = s2/𝑥𝑥) (c-d)
(mean ± SE) of nymphs and adults in 2012 and 2013. Significant differences in densities between adults and nymphs are marked with an asterisk (P < 0.05). A Chi-square test indicated that all IA values were significantly higher
than one (P < 0.05). ... 33 Figure IV-1. Set up of the EPN-avoidance experiment. ... 44
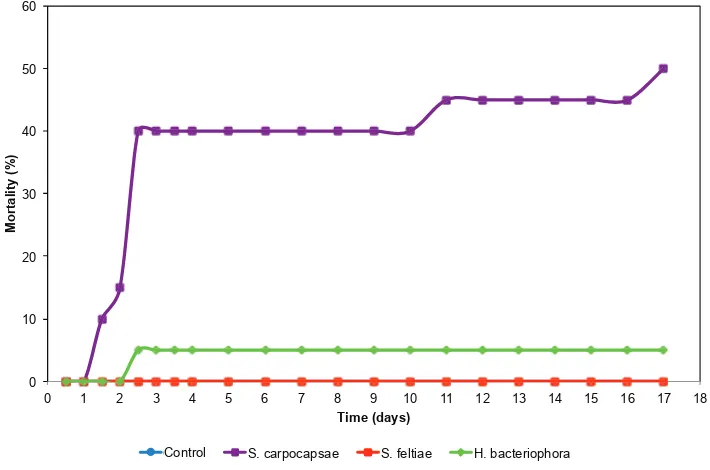
Figure IV-2. Evolution over days of European earwig mortality due to S.
carpocapsae, S. feltiae, H. bacteriophora and control. Mean mortality (%). For the S. carpocapsae, S. feltiae and H. bacteriophora treatments, the mortality due to EPNs is only represented when infective juveniles were found inside earwig individuals. ... 46 Figure IV-3. Percentage of European earwig individuals per shelter (mean and
SEM) over 3 days. A (C-C): first one control shelter was introduced and later another control shelter. B (N-C): first a shelter with nematodes was introduced and later a control shelter. C (C-N): first a control shelter was introduced and later a shelter with nematodes. Significant treatment effects per day are marked with asterisks (*** = P < 0.001, ** = P < 0.01, * = P < 0.05). ... 47 Figure IV-4. Percentage of predation by European earwig of freeze-killed or
Figure V-1. Number of woolly apple aphid crawlers captured per tree per week (mean ± SEM) throughout the year. Note that crawlers through the canopy are referred to the secondary axis and are present only in 2012. ... 60 Figure V-2. Woolly apple aphid aerial infestation (AI) and parasitism (mean ± SEM)
for each orchard and year. ... 63 Figure V-3. Variable loadings represented in the plane defined by the first two
principal components. Variables are: the weekly number of aphids captured on the bands (Up, Down and Canopy (C)), the accumulated number of aphids captured each week (Up ac and Down ac), the percentage of aerial infestation (AI), the percentage of infested shoots (IS), the mean values of the classes of parasitism, the number of earwigs and A. mali individuals captured on the bands (EarwC and MaliC, respectively), and the number of earwigs present in shelters (EarwP), climatic variables such as maximum temperature (Tmax, ºC), minimum temperature (Tmin, ºC), number of hours above or below temperature thresholds (h>20 ºC, h> 25 ºC, h<10 ºC and h<7 °C), minimum relative humidity (rh min%), solar radiation (Sun, W/m2), rainfall (Rain, mm), and wind speed (Wind, m/s). ... 64 Figure V-4. Up ac PLS-1: X and Y loadings represented in the plane defined by the
two first PLS factors (A) and predicted vs. measured diagram for the regression model of Up ac on the 12 variables analyzed (B). Variables are: the weekly number of aphids captured on the upper band (Up), the accumulated number of aphids captured each week on the upper band (Up
ac), the mean values of the classes of parasitism, the number of A. mali
individuals captured on the bands (MaliC), the number of earwigs present in shelters (EarwP), climatic variables such as maximum temperature (Tmax, ºC), minimum temperature (Tmin, ºC), number of hours below temperature thresholds (h<10 ºC and h<7 °C), minimum relative humidity (rh min%), solar
radiation (Sun, W/m2), rainfall (Rain, mm), and wind speed (Wind, m/s). ... 66 Figure V-5. AI and IS PLS-2: X and Y loadings represented in the plane defined by
the two first PLS-factors (A) and predicted vs. measured diagram for the regression model of AI-IS on the 10 variables analyzed (B). Variables are: the accumulated number of aphids captured on the upper band each week (Up ac), the percentage of aerial infestation (AI), the percentage of infested shoots (IS), the mean values of the classes of parasitism, the number of earwigs present in shelters (EarwP), climatic variables such as maximum temperature (Tmax, ºC), minimum temperature (Tmin, ºC), number of hours
below temperature thresholds (h<10 ºC and h<7 °C), minimum relative
humidity (rh min%), solar radiation (Sun, W/m2), rainfall (Rain, mm), and wind
speed (Wind, m/s). ... 67 Figure VI-1. Mean abundance of spider families and Opilians per plant sample in
spring. ... 75 Figure VI-2. Mean abundance of spider families and Opilians per plant sample in
autumn. ... 76 Figure VII-1. Average number of predators, parasitoids, and food sampled in the
to V. tinus are evergreens, G. scorpius and R. lycioides are spine species, and from C. siliquastrum to T. platyphyllos are deciduous. Data are from the survey. ... 84 Figure VII-2. Mean number of predators and parasitoids per tree/shrub species in
spring (and winter when indicated). Note that axes are different for Rhamnus alaternus and for L. nobilis in winter. Data are from the survey. N = number of samples. ... 85 Figure VII-3. Mean number of predators and parasitoids per tree/shrub species in
summer. Note that there are different scales, and the number of Coccinellidae is indicated when greater than the scale. Data are from the survey. N = number of samples. ... 86 Figure VII-4. Mean number of predators and parasitoids for tree/shrub species in
fall. Data are from the survey. N = number of samples. ... 87 Figure VII-5. Number (Mean ± SE) of beneficial individuals (predators, parasitoids
and food) per tree/shrub species in the experimental trial in spring, summer, fall and winter. Note that there are two y-axes. Column bars with different letters indicate significant differences regarding the beneficial type, as determined by ANOVA and the Tukey test (P < 0.05). ... 87 Figure VII-6. Number (Mean ± SE) of beneficial individuals (predators, parasitoids
General introduction
3
1. Towards sustainable agriculture
To satisfy a societal demand for environmentally friendly systems and healthy fruits, there is a challenge to keep the pests and diseases below economic
thresholds reducing the pesticide use (Simon et al. 2009). Protection and promotion
of biodiversity by the lower-input approaches of integrated pest management, organic agriculture and no-till or conservation agriculture may be a key issue to meet both ecological and agronomic purposes (FAO 2002; Simon et al. 2009). However, due to the expansion and intensification of production, the loss of biodiversity will remain serious over the next 30 years, even in the developed countries where nature is highly protected (FAO 2002).
Pest management strategies include preventive approaches that may stand from the plant resistance and cultural methods to the enhancement of natural control; whereas remedial approaches encompass the inundative releases of natural enemies, biotechnical methods and the application of pesticides (Hill et al. 1999; Kogan 1998; Zehnder et al. 2007). In many agro-ecosystems predators, parasitoids and pathogens are the cornerstone of integrated pest management strategies (Kogan 1998), and in recent decades biological control has been gaining importance, being currently one of the preferred techniques to control mainly indirect pests, due to its performance criteria such as economic, ecological and social (Jacas and Urbaneja 2008).
Natural control (biological) takes place without human intervention and occurs in
the world within 89.5 million km2 of all terrestrial ecosystems. Moreover, most of
the potential agricultural pests (95% of 100,000 phytophagous arthropod species) are also under natural control, so the rest of the control methods used today are aimed at the remaining 5,000 species of arthropod pests. It is estimated that this biocontrol ecosystem service reaches a minimum annual value of US$ 400 billion per year (Van Lenteren 2008).
To buy and release beneficials is not always a practical method, and in some cases can even deteriorate the natural control by eroding the genetic diversity of the agro-ecosystems (Rissler and Mellon 1996). Therefore, the best biological control method relies on enhancing the naturally occurring predators and parasitoids (conservation biological control) (Helyer et al. 2003; Pywell et al. 2005).
Chapter I
4
According to Helyer et al. (2003), predators can be classified within two groups: residents and colonists. Residents tend to be polyphagous and are present throughout the year, for instance earwigs and spiders. These predators are well established and can predate on pests early in the season. The other group of predators is the colonists, which are highly mobile and can occur in extremely great numbers. These predators tend to be attracted to the orchards when there is high prey presence, for instance pest outbreaks. Predators of the families Anthocoridae, Miridae, Nabidae, Coccinellidae, Syrphidae and Chrysopidae might be considered as colonists.
Success of biological control relies on promoting those predators that are more effective for each target pest. Therefore, knowledge on the presence and phenology of natural enemies in each area, and their prey and host preference may be crucial when trying to improve the biological control of pests (Alomar and Albajes 2005; Avilla et al. 2008; Jones et al. 2012; Sigsgaard 2005; Symondson et al. 2002; Zehnder et al. 2007).
Although spiders tend to be in the orchards as residents, their role as predators has been underestimated (Samu et al. 1999; Sunderland and Greenstone 1999; Toft 1999). Spiders are high insect consumers, and due to a wide variety of lifestyles and foraging strategies, they may play an important function in stabilizing or regulating insect populations (Chiri 1989; Nyffeler and Sunderland 2003). The results of different investigations conducted in apple orchards demonstrated that spiders are important natural enemies of aphids, mites and lepidopterans (Boreau de Roince et al. 2013; Mansour et al. 1980; McCaffrey and Horsburgh 1980; Wyss et al. 1995).
Pesticide use in agro-ecosystems has decreased the populations of residents as spiders, affecting their ability to control pest species (Riechert and Lockley 1984; Young and Edwards 1990). Moreover, there is a dearth of knowledge on the potential role of spiders from Southern Europe and Mediterranean climates (Nyffeler and Sunderland 2003).
Regarding other residents, in Central-North Europe, low presence of European
earwig Forficula auricularia Linnaeus (Dermaptera: Forficulidae) has been related
to woolly apple aphid Eriosoma lanigerum Hausmann (Hemiptera: Aphididae)
outbreaks (Helsen and Simonse 2006; Helsen et al. 2007; Mols 1996; Mueller et al. 1988; Stap et al. 1987).
The European earwig is an omnivorous insect worldwide distributed, which plays an important role as biocontrol agent (Albouy and Caussanel 1990; Carroll and Hoyt 1984; Helsen and Simonse 2006; Suckling et al. 2006). Considering their importance in biological control, European earwig has been cited as a predator of
codling moth Cydia pomonella Linnaeus (Lepidoptera: Tortricidae) (Glenn 1977;
Jones et al. 2012; Sauphanor et al. 2012), apple leaf-curling midge Dasineura mali
Kieffer (Diptera: Cecidomyiidae) (He et al. 2008),diaspidid scale insects (Hill et
General introduction
5 Psyllidae) (Höhn et al. 2007; Lenfant et al. 1994; Sauphanor et al. 1994), the
leafroller Epiphyas postvittana Walker (Lepidoptera: Tortricidae) (Frank et al.
2007; Suckling et al. 2006) and aphids (Hemiptera: Aphididae) such as woolly apple aphid (Asante 1995; Mueller et al. 1988; Nicholas et al. 2005), rosy apple
aphid Dysaphis plantaginea Passerini (Brown and Mathews 2007; Dib et al. 2010)
and green apple aphid Aphis pomi DeGeer (Hagley and Allen 1990). Due to its key
role as biocontrol agent, phenology of European earwig has been broadly studied (Burnip et al. 2002; Crumb et al. 1941; Fulton 1924; Gobin et al. 2008; Helsen et al. 1998; Kocarek 1998; Lamb 1975; Lamb and Wellington 1975; Lamb 1976a; Moerkens et al. 2009; Phillips 1981; Romeu-Dalmau et al. 2011; Suckling et al. 2006), but very little is known in Mediterranean apple orchards.
On the other hand, woolly apple aphid has recently become a more prevalent and important pest (Beers et al. 2010; Warner 2006), associating its increase with disruption of biological control and changes in pesticide programs (Gontijo et al. 2012). While earwigs, spiders, ladybird beetles, lacewings, hoverflies and the
parasitoid Aphelinus mali Hald (Hymenoptera: Aphelinidae) are reported abroad as
woolly apple aphid natural enemies (Asante 1995; Asante 1997; Gontijo et al. 2012; Monteiro et al. 2004; Mueller et al. 1988; Nicholas et al. 2005; Short and Bergh 2004), few data are available for the Mediterranean area.
Environment manipulation and ecological infrastructures such as hedgerows, flower strips and cover crops may provide additional resources to beneficials. Access to shelter and overwintering habitats, alternative preys/hosts and appropriate microclimates will bring more favorable conditions to natural enemies, enhancing their survival, fecundity, longevity and behavior, which will improve the biocontrol efficacy (Barberi et al. 2010; Boller et al. 2004; Jonsson et al. 2008; Landis et al. 2000; Nicholls and Altieri 2012).
Beneficials are estimated to provide US agriculture with US$ 8 billion worth of pollination and pest control each year (Isaacs et al. 2009), and by the promotion of biodiversity within crops and landscapes, this value could be increased (Bianchi et al. 2006; Boller et al. 2004; Landis et al. 2000).
Many authors have reported promotion of natural enemies through implementation of ecological infrastructures. For instance, several of these studies have used
flower strips of annual plants such as Phacelia tanacetifolia Bentham and
Lobularia maritima (L.) Desv. (Ambrosino et al. 2006; Baggen et al. 1999; Gontijo et al. 2013; Hickman and Wratten 1996; Holland and Thomas 1996; Long et al. 1998; Lövei et al. 1992; Nicholls and Altieri 2012; Pontin et al. 2006). The use of perennial plants as hedgerows has also been reported by many authors to increase and improve performance of natural enemies (Bianchi et al. 2006; Macfadyen et al. 2011; Morandin et al. 2011; Navntoft et al. 2009; Pisani Gareau and Shennan 2010; Ricci et al. 2011; Varchola and Dunn 2001).
Chapter I
6
and other aspects such as the regional climate must be considered (Baggen et al. 1999; Boller et al. 2004). In addition by supporting the biodiversity of the native fauna and being more adapted to local environment, native plants might be as useful as the non-natives that are widely cited in references to promote natural enemies (Danne et al. 2010; Fiedler and Landis 2007; Isaacs et al. 2009).
2. Aims and outline of the thesis
Use of predators, parasitoids and entomopathogens can lead to more efficient and sustainable pest management programs. However, the interaction between all these agents may play an important role. Knowledge on presence and abundance, phenology and habitats of the most efficient biocontrol agents within each area may be the key to improve biological control of pests. The general aim of this thesis was to know the presence of earwigs within Mediterranean apple orchards, their phenology, and to assess native ecological infrastructures that would improve the biological control through enhancement of beneficials. The interaction of natural enemies with woolly apple aphid will provide more knowledge to evaluate the role that biological control may play to control this pest.
The specific objectives of the thesis were:
To know the earwig species present in Mediterranean apple orchards, their
phenology and the role that they may have as biocontrol agents (Chapter II).
To know if pheromone-impregnated shelters might be useful to promote
and/or control earwigs due to their aggregation behavior (Chapter III).
To assess the compatibility of the European earwig with entomopathogenic
nematodes (EPNs) (Chapter IV).
To know the behavior and population dynamics of the woolly apple aphid
(WAA) in relation to climatic variables and natural enemies (Chapter V).
To know the spider diversity and identify common plants of the
Mediterranean area which are more suitable for them (Chapter VI).
To evaluate the suitability of native and naturalized trees and shrubs to be
Abstract
The European earwig Forficula auricularia L. (Dermaptera: Forficulidae) has been
widely studied as a key predator of pests in colder regions, but their phenology and behavior may differ in warmer areas such as the Mediterranean. Therefore, in these regions, in order to promote earwigs but also to optimize their control in crops where they are pests, more information is needed. The phenology, aggregation, and
interspecific association of F. auricularia and Forficula pubescens Gené were
assessed in Mediterranean apple orchards. Suitability of day degree models elaborated for temperate regions were evaluated to predict the phenology of the
European earwig in a Mediterranean climate. F. auricularia and F. pubescens
co-occurred in canopies without apparent competition. This study provides useful data about the weekly phenology of earwigs throughout the year that can be used to improve the promotion of this insect in pip fruit orchards or to control them in stone fruit crops
Keywords: Biological control, Dermaptera, earwig, Forficulidae, Mediterranean,
Phenology of F. auricularia & F. pubescens
9
1. Introduction
The European earwig, Forficula auricularia Linnaeus (Dermaptera: Forficulidae),
is an important predator of pear psylla Cacopsylla pyri Linnaeus (Hemiptera:
Psyllidae) (Höhn et al. 2007; Lenfant et al. 1994; Sauphanor et al. 1994), codling
moth Cydia pomonella Linnaeus (Lepidoptera: Tortricidae) (Glenn 1977; Jones et
al. 2012; Sauphanor et al. 2012), apple leaf-curling midge Dasineura mali Kieffer
(Diptera: Cecidomyiidae) (He et al. 2008),diaspidid scale insects (Hill et al. 2005;
Logan et al. 2007), the leafroller Epiphyas postvittana Walker (Lepidoptera:
Tortricidae) (Frank et al. 2007; Suckling et al. 2006) and aphids (Hemiptera:
Aphididae) such as woolly apple aphid (WAA) Eriosoma lanigerum Hausmann
(Asante 1995; Mueller et al. 1988; Nicholas et al. 2005), rosy apple aphid (RAA)
Dysaphis plantaginea Passerini (Brown and Mathews 2007; Dib et al. 2010) and
green apple aphid Aphis pomi DeGeer (Carroll and Hoyt 1984; Hagley and Allen
1990). However, due to their omnivorous diet, European earwigs can cause economic damage to some crops (Albouy and Caussanel 1990; Grafton-Cardwell et al. 2003; Huth et al. 2011; Kuthe 1996). In addition, their frass can negatively influence the aroma and flavor of some wines (Burdet et al. 2013).
Another earwig species, Forficula pubescens Gené, has been observed to prey on
pear psyllids (Debras et al. 2007) and RAA (Dib et al. 2010). There are few studies
of the phenology of Forficula pubescens (Herter 1964; Romeu-Dalmau et al.
2011). Most studies have been conducted on F. auricularia in Central-Northern
Europe (Gobin et al. 2008; Helsen et al. 1998; Kocarek 1998; Moerkens et al. 2009; Phillips 1981), New Zealand (Burnip et al. 2002; Suckling et al. 2006), and North America (Crumb et al. 1941; Fulton 1924; Lamb 1975; Lamb and Wellington 1975; Lamb 1976a); however, little is known about this insects in Mediterranean apple orchards, where they may also play an important role as predators in pip fruit and citrus orchards but become pests in stone fruit orchards and vineyards.
Chapter II
10
into adults and remain until autumn (Helsen et al. 1998; Lamb and Wellington 1975; Moerkens et al. 2009).
European earwig forage at night and seek shelter during the day (Albouy and Caussanel 1990; Helsen et al. 1998). Given that these insects are important biocontrol agents, their promotion through the use of additional shelters has been assessed in apple, pear, and kiwifruit orchards (Gobin et al. 2006; Logan et al. 2011; Solomon et al. 1999). As earwigs have a univoltine life cycle, any disruption on their cycle one year can have long-lasting repercussions on their populations (Gobin et al. 2006; Peusens and Gobin 2008; Peusens et al. 2010). To minimize negative effects on vulnerable life stages of earwigs, the prediction of their phenology will contribute to determining the precise timing for spray applications and soil tillage, thereby improving orchard management (Belien et al. 2012; Belien et al. 2013; Moerkens et al. 2012; Peusens et al. 2010). For instance, commonly pesticides sprayed in orchards, such as chlorpyrifos, deltamethrin, indoxacarb and spinosad, have been reported by several authors to have lethal effects on European earwig (Fountain et al. 2013; Peusens and Gobin 2008; Peusens et al. 2010; Vogt et al. 2010). Software applications and prediction models have been developed to optimize orchard management techniques geared to promoting European earwig (Belien et al. 2012; Belien et al. 2013; Helsen et al. 1998; Moerkens et al. 2011). However, these studies have been conducted in colder regions. Earwig phenology and behavior may differ in warmer areas such as the Mediterranean. Therefore, in these regions, in order to promote earwigs but also to optimize their control in crops where they are pests, more information is needed.
The objective of this study was to assess the phenology, aggregation, and
interspecific association of F. auricularia and F. pubescens in Mediterranean apple
orchards. Suitability of day degree models elaborated for temperate regions were evaluated to predict the phenology of the European earwig in a Mediterranean climate.
2. Materials and Methods
2.1. Phenology
Trials were conducted in four apple orchards under organic management located in Catalonia (NE Spain): Les Borges Blanques (BB) (41º30’23.06’’N; 0º51’05.93’’E), Mollerussa (MO) (41º36’51.13’’N; 0º52’22.75’’E), Ivars d’Urgell (IU) (41º41’06.19’’N; 0º58’06.09’’E), and Miralcamp (MI) (41°36'31.89"N; 0°52'24.62"E). The climate is semi-arid Mediterranean, with a mean annual rainfall of 350 mm.
BB was an experimental orchard of ‘Fuji Kiku8’ apple grafted onto M9, planted in
Phenology of F. auricularia & F. pubescens
11 commercial orchard of ‘Golden Smoothee’ apple grafted onto M9, planted in 1993, and trained to a central leader with spacing of 4 x 1.1 m. MI was a commercial orchard of ‘Golden Smoothee’ apple grafted onto M9, planted in 2000, and trained to a central leader with spacing 4 x 1.2 m.
To follow earwig phenology, BB was sampled for 4 years (2010-2013), MO and IU for 3 (2011-2013), and MI for 2 (2012-2013). For each orchard from 2010 onwards, 10 shelters were set on the second scaffold limb of various trees (tree shelters). From 2012 onwards, 10 additional shelters were tied at the base of 10 supplementary trees in each orchard (ground shelters). Shelters were prepared by rolling a piece of corrugated cardboard to obtain cylinders (12 cm height x 9 cm diameter), which were protected from rain and adverse conditions by a PVC tube (15 cm height x 9.5 cm diameter). Similar shelters have been used in studies of European earwigs elsewhere (Burnip et al. 2002; Gobin et al. 2006; He et al. 2008; Helsen et al. 1998; Logan et al. 2007; Moerkens et al. 2009; Phillips 1981; Solomon et al. 1999). Every week throughout the year, species, number, phenological stage, and sex of adult earwigs for each shelter were recorded, and earwigs were then released at the base of the assessed tree. Presence of wings was
used to distinguish between F. auricularia and F. pubescens adults. Cerci
dimorphism was used to distinguish sex, and size and number of antennal segments
and the apparent wing buds on the 3rd segment of the thorax to distinguish nymph
stages (Albouy and Caussanel 1990).
2.2. Evaluation of the day degree models
The European earwig phenological day degree model designed by Moerkens et al. (2011) was tested in our region. Daily minimum and maximum temperatures required to run the model were obtained from the closest automatic weather station
of the Meteorological Service of Catalonia (Meteocat, Departament de Territori i
Sostenibilitat, Generalitat de Catalunya). For BB, data were from the Castelldans station 8.5 km away, for IU from the Castellnou de Seana station 3 km away and for MO and MI from the Mollerussa station 0.5 km and 1 km away respectively. From 2011 onwards, daily soil temperatures at a depth of 5 cm were also available from the Mollerussa station, which is 12 km from BB and 10 km from IU. The model was checked for 2012-2013 based on the dates of first appearance and peak of the developmental stage observed in the field. For BB and IU, the model was run with soil data from MO.
The sum in day-degrees (DD) up to the first and maximum number of N3, N4 nymph instars and adults were calculated for each orchard and year and compared with those reported by Helsen et al. (1998). The minimum and maximum temperatures from each weather station were used to calculate the effective temperature for each orchard and year. The effective temperature sum in DD was calculated through the sine wave approximation (Rabbinge 1976), using a lower
threshold of 6°C and taking 1st January as the biofix. These parameters were
Chapter II
12
2.3. Data analysis
Data from April to July —when more earwigs were recorded— were used to compare abundance among years within orchards. Replicates were the weekly
mean abundance of the 10 canopy shelters. F. auricularia data were
log-transformed and ANOVA assumptions (normality and homoscedasticity) were
confirmed before analysis. Means were compared at the P = 0.05 level, and a
Tukey HSD test was used to separate means. Due to heterogeneity of variance, F.
pubescens data were analyzed by Welch’s test.
To compare abundance between earwig species, data from April to July in canopy shelters were used. Replicates were the weekly mean abundance of the 10 shelters, and in this case abundances were compared between both species within orchards by Welch’s test.
Data from June and July —when more adults were recorded on canopy shelters—
were used to calculate and analyze the sex ratio for F. auricularia and F.
pubescens within orchards. Data were log-transformed and analyzed by a
nonparametric Wilcoxon test. Homogeneity of variance was also confirmed before
each analysis.
Aggregation in shelters was evaluated by fitting data to Taylor’s power law (Taylor 1961):
S2 = a·mb (1)
Where S2 is the variance, m is the sample mean, a is a sampling factor and b
indicates whether the population distribution is regular (b < 1), random (b = 1) or aggregated (b > 1).
For F. auricularia, the weekly mean data of the 10 shelters from June to July from
all the years were used, while for F. pubescens the data used were from IU
2011-2012 and MI 2011-2012. Equation (1) was log-log transformed to estimate a and b.
To evaluate the interspecific association between F. auricularia and F. pubescens,
data from IU 2011-2012 and MI 2012 were used. Tree and ground shelters were assigned to one of the following categories based on insect presence: (a) both
earwig species; (b) only F. auricularia; (c) only F. pubescens; and (d) without
earwigs. For each month, the number of shelters within each category was used to
calculate the interspecific association coefficient (Cas) following Yule’s formula:
Cas = ad-bc
ad+bc (2)
Cas varies from -1 to +1. A negative value shows competition, zero no interaction,
Phenology of F. auricularia & F. pubescens
13 Data were analyzed using the JMP statistical software package (Version 9; SAS Institute Inc., Cary, North Carolina).
3. Results
3.1. Phenology
In addition to F. auricularia and F. pubescens, three other earwig species were
found: Labidura riparia Pallas, Nala lividipes Dufour and Euborellia moesta
Gené. F. auricularia and F. pubescens were detected in both tree and ground
shelters (Table sII-1), whereas L. riparia, N. lividipes and E. moesta were found
occasionally and only in ground shelters.
F. auricularia was very common in all the orchards during the study period,
whereas F. pubescens, although observed in all the orchards, was not captured all
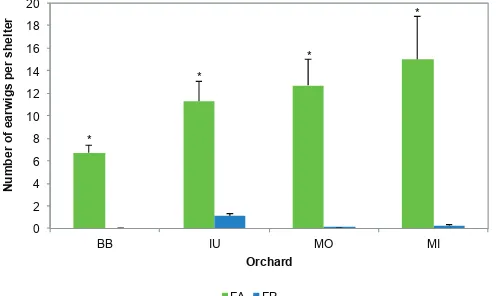
the years (Table sII-1 and Figure II-1). Higher numbers of F. auricularia than F.
pubescens were observed in all the orchards (Figure II-2). The abundance of F. auricularia did not change along the years in BB, IU or MI, whereas the
population increased in MO over the years (ANOVA - Tukey HSD: F = 19.75; df
= 2,48; P = 0.0001) (Figure II-1). In contrast, the abundance of F. pubescens
decreased in IU (Welch’s test: F = 35.44; df = 2,20; P = <0.0001) and MI (Welch’s
[image:36.482.64.425.339.456.2]test: F = 9.49; df = 1,19; P = 0.006) (Figure II-1).
Figure II-1. Abundance of Forficula auricularia (a) and Forficula pubescens (b) (mean ± SE) from
April to July per year in BB, IU, MO and MI. Column bars marked with the same letter or without asterisk indicate no significant differences among years within each orchard according to the Tukey HSD or Welch’s tests (P > 0.05). Note that y-axis scales are different.
F. auricularia was found throughout the year (Figure II-3a-b and Table sII-1). From January to June, N2, N3 and N4 instars were found in ground shelters. At the end of January the population peaked with an average of 3 N3 instar individuals (Figure II-3b). The presence of the N4 instar rose from mid-March to the end of May, after which time no more N4 were observed in ground shelters (Figure II-3b). The presence of the N2 instar was intermittent during winter and early spring, and more regular from May to June; however, the population peak was observed in November, with an average close to 3 individuals per ground shelter (Figure II-3b).
c b a 0 5 10 15 20 25 30 35
BB IU MO MI
Number of earwigs per shelter
Orchard a
2010 2011 2012 2013
a a * b 0 1 2 3
BB IU MO MI
Orchard b
Chapter II
14
Adults were found in ground shelters from May to November, but their abundance was lower than that of nymphs (Figure II-3b).
Figure II-2. Number of Forficula auricularia and Forficula pubescens (mean ± SE) per orchard.
Column bars market with an asterisk indicate significant differences among earwig species within orchards according to Welch’s test (P < 0.05).
In contrast, adults were most abundant in the tree shelters (Figure II-3a). Adults were captured from April to November, but higher presence was observed from mid-May to the beginning of July, with a peak of 23 individuals per shelter (Figure II-3a). N4 was the most abundant instar found in tree shelters from the end of March to May, with a population peak of 14 individuals per shelter in mid-May (Figure II-3a). The N3 instar was also observed in tree shelters one month after the N4 was found. The abundance of N3 was much lower, with an average of 3 individuals per shelter (Figure II-3a).
Regarding F. pubescens, adults were found in ground shelters from mid-February
to April, and after that N2, N3, N4 and N5 instars were successively observed
either in ground or in tree shelters until July (Figure II-3c-d). The N2 instar of F.
pubescens was more common in ground shelters, while it was barely observed in tree shelters. In contrast, the N1 instar was not found in tree or ground shelters
(Figure II-3c-d). Adults of F. pubescens were observed from March to April and
from June to December in canopies, with a maximum of 2 individuals per shelter (Figure II-3c).
Capture rates dropped for both earwig species during molting into adults (Figure II-3). No significant differences were observed between number of male and
female individuals (P > 0.05, Wilcoxon test).
*
*
*
*
0 2 4 6 8 10 12 14 16 18 20
BB IU MO MI
Number of earwigs per shelter
Orchard
[image:37.482.117.365.94.242.2]Phenology of F. auricularia & F. pubescens
[image:38.482.60.424.55.289.2]15
Figure II-3. Weekly mean earwig individuals per tree and ground shelters for Forficula auricularia
(a-FA and b-FA) and Forficula pubescens (c-FP and d-FP) throughout the year for nymph stages (N2, N3, N4 and N5) and adults. Note that y-axis scales are different. FA figures were calculated with data from all the orchards and years, whereas FP figures were calculated on the basis of IU 2011-2012 and MI 2012.
3.2. Aggregation behavior and interspecific association
The relationship between the variance and the mean was studied by Taylor’s law.
The distribution of F. auricularia in shelters was observed to be aggregated, as the
b coefficient was higher than 1 in all the orchards (Table II-1). On the other hand,
for F. pubescens, the b coefficient was higher than 1 in IU, also indicating an aggregated distribution. In contrast, in MI this distribution could not be confirmed (Table II-1).
Table II-1. Taylor’s parameters for each orchard and species; b indicates when the population in shelters was regular (b < 1), random (b = 1) or aggregated (b > 1).
F. auricularia and F. pubescens showed mainly a positive association (Figure II-4). A few negative values were observed occasionally (Figure II-4).
0 5 10 15 20 25 30
J F M A M J J A S O N D
Earwigs per shelter
a - FA tree
0 1 2 3 4 5 6
J F M A M J J A S O N D
c - FP tree
0 5 10 15 20 25 30
J F M A M J J A S O N D
Earwigs per shelter
b - FA ground
N2 N3 N4 Adults
0 1 2 3 4 5 6
J F M A M J J A S O N D
d - FP ground
N2 N3 N4 N5 Adults
Species Orchard n b SE t ratio Prob>t R2
BB 33 1.43 0.06 22.52 <0.0001 1.30 1.56 0.94
IU 25 1.73 0.07 25.96 <0.0001 1.59 1.87 0.97
MO 25 1.48 0.06 23.22 <0.0001 1.35 1.61 0.96
MI 17 1.73 0.08 22.56 <0.0001 1.57 1.90 0.97
IU 16 1.24 0.17 7.48 <0.0001 0.88 1.60 0.80
MI 7 0.92 0.48 1.94 0.1103 -0.30 2.14 0.43 CI 95%
Forficula auricularia
[image:38.482.61.424.495.581.2]Chapter II
[image:39.482.109.372.57.215.2]16
Figure II-4. Monthly interspecific association coefficients between F. auricularia and F. pubescens
for IU and MI orchards 2011-2012. A negative value shows active competition, zero no interaction, and a positive value an association between species.
3.3. Evaluation of the day degree models
No matches among observed and estimated dates were found for any of the developmental stages detected in tree or in ground shelters running the model of Moerkens (Table II-2). Regarding the model of Helsen, the N3 nymph instar was observed to appear at 215 DD; however, large differences between orchards were found (Table II-3). Although smaller differences were observed for the N4 instar (264 DD) and adult stage (250 DD), there were no matches between observed and estimated dates (Table II-3). We found only some coincidences when predicting the maximum number of N4 (613 DD) and adult individuals (1035 DD), with a range from 0 to 29 days between observed and estimated data (Table II-3).
Table II-2. Estimated appearance dates for the first and maximum number of individuals of each European earwig developmental stage according to the day degree model (Model) and observations (Tree and Ground).
-1 -0.8 -0.6 -0.4 -0.2 0 0.2 0.4 0.6 0.8 1
J F M A M J J A S O N D
IU 2011 IU 2012 MI 2012
Orchard Year Model Tree Ground Model Tree Ground Model Tree Ground Model Tree Ground Model Tree Ground
MO 2012 24-Mar - 10-Dec 10-Apr 3-Jan 5-Mar 27-Apr 5-Mar 27-Mar 10-May 27-Mar 27-Mar 24-May 5-Mar 16-Apr MO 2013 21-Feb - 21-Jun 12-Mar 14-Jan 2-Jan 1-Apr 21-Jan 2-Jan 21-Apr 7-Feb 2-Jan 17-May 31-Jan 2-Jan BB 2012 24-Mar - 5-Dec 10-Apr 2-Jan 15-Nov 27-Apr 17-Jan 28-Feb 10-May 20-Mar 6-Mar 23-May 17-Apr 24-Apr BB 2013 21-Feb - 3-May 13-Mar 22-Apr 20-Feb 30-Mar 3-Jan 3-Jan 17-Apr 3-Jan 3-Jan 10-May 13-Mar 14-Feb IU 2012 24-Mar - - 10-Apr 10-Apr 10-Apr 28-Apr 25-Apr 10-Apr 11-May 2-Apr 3-May 25-May 15-Mar 10-Apr IU 2013 21-Feb 3-May 3-May 12-Mar 3-May 4-Apr 31-Mar 4-Mar 3-May 17-Apr 21-Mar 3-May 12-May 21-Jan 4-Apr MI 2012 24-Mar - - 10-Apr 21-May 21-May 27-Apr 16-Apr 16-Apr 10-May 10-Apr 10-Apr 24-May 27-Mar 19-Mar MI 2013 21-Feb 21-Jun 23-May 12-Mar 31-May 26-Mar 1-Apr 22-Apr 3-May 21-Apr 9-May 9-May 17-May 21-Jan 31-Jan
Orchard Year Model Tree Ground Model Tree Ground Model Tree Ground Model Tree Ground Model Tree Ground
MO 2012 24-Mar - 10-Dec 10-Apr 27-Nov 10-Dec 27-Apr 21-May 17-Dec 10-May 15-May 15-May 24-May 21-May 6-Aug MO 2013 21-Feb - 21-Jun 12-Mar 6-Nov 8-Jan 1-Apr 3-May 31-Jan 21-Apr 23-May 21-Feb 17-May 13-Jun 21-Jun BB 2012 24-Mar - 5-Dec 10-Apr 17-Jan 11-Dec 27-Apr 24-Jan 18-Dec 10-May 11-Apr 11-Apr 23-May 22-May 22-May BB 2013 21-Feb - 3-May 13-Mar 20-Nov 12-Apr 30-Mar 26-Mar 21-Jan 17-Apr 12-Apr 12-Apr 10-May 28-Jun 31-May IU 2012 24-Mar - - 10-Apr 24-May 10-Apr 28-Apr 3-May 3-May 11-May 24-May 7-May 25-May 13-Jun 16-May IU 2013 21-Feb 3-May 3-May 12-Mar 31-May 5-Jun 31-Mar 9-May 9-May 17-Apr 31-May 31-May 12-May 13-Jun 31-May MI 2012 24-Mar - - 10-Apr 21-May 21-May 27-Apr 30-Apr 21-May 10-May 21-May 7-May 24-May 11-Jun 4-Jun MI 2013 21-Feb 21-Jun 13-Jun 12-Mar 31-May 28-Jun 1-Apr 6-Jun 28-Jun 21-Apr 31-May 13-May 17-May 28-Jun 28-Jun
1st individual
N1 N2 N3 N4 Adult
max
[image:39.482.59.435.452.616.2]Phenology of F. auricularia & F. pubescens
17
Table II-3. Observed and accumulated degree days (DD > 6°C, from 1 January on) for first and maximum number of European earwig individuals for each developmental stage found in tree canopies.
4. Discussion
The occasional presence of L. riparia, E. moesta, and N. lividipes may be
explained by their low aggregation coefficient and, in some cases, solitary behavior (Albouy and Caussanel 1990; Sauphanor and Sureau 1993). The observation that these species were found only in ground shelters is consistent with their low appearance in literature as biocontrol agents in fruit orchards, as those surveys
addressed mainly tree canopies. L. riparia, N. lividipes, and E. moesta have been
described as important biocontrol agents in cereal and cotton crops (Albouy and Caussanel 1990; Shepard et al. 1973). As ground dwelling, these species might play a role in predating pests with developmental stages on the ground, such as
WAA, codling moth, and Mediterranean fruit fly (Ceratitis capitata Wiedemann;
Diptera: Tephritidae); however, this need to be further tested.
Orchard Year Date DD > 6ºC (1 Jan) Observed - Estimated Orchard Year Date DD > 6ºC (1 Jan) Observed - Estimated
MO 2011 5-Dec 3473 270 MO 2011 12-Dec 3486 236
MO 2012 5-Mar 126 -5 MO 2012 21-May 721 31
MO 2013 21-Jan 27 -49 MO 2013 3-May 491 13
BB 2010 23-Mar 199 13 BB 2010 31-Mar 250 -20
BB 2011 22-Mar 235 12 BB 2011 5-Apr 350 -15
BB 2012 17-Jan 34 -53 BB 2012 24-Jan 47 -87
BB 2013 3-Jan 3 -67 BB 2013 26-Mar 251 -25
IU 2011 13-Apr 397 34 IU 2011 4-May 582 14
IU 2012 25-Apr 433 46 IU 2012 3-May 502 13
IU 2013 4-Mar 124 -6 IU 2013 9-May 573 19
MI 2012 16-Apr 370 37 MI 2012 30-Apr 480 10
MI 2013 22-Apr 424 43 MI 2013 6-Jun 807 47
Average 10-Mar Average 20-Apr
Average (Mean ± SE) 215.49 ± 50.30 Average (Mean ± SE) 459.48 ± 66.70
Orchard Year Date DD > 6ºC (1 Jan) Observed - Estimated Orchard Year Date DD > 6ºC (1 Jan) Observed - Estimated
MO 2011 11-Apr 391 19 MO 2011 9-May 659 -1
MO 2012 27-Mar 243 4 MO 2012 14-May 647 4
MO 2013 7-Feb 63 -45 MO 2013 23-May 669 13
BB 2010 31-Mar 250 8 BB 2010 26-Apr 434 -14
BB 2011 5-Apr 350 13 BB 2011 19-Apr 492 -21
BB 2012 20-Mar 230 -3 BB 2012 11-Apr 380 -29
BB 2013 3-Jan 3 -80 BB 2013 12-Apr 370 -28
IU 2011 30-Mar 250 7 IU 2011 18-May 749 8
IU 2012 2-Apr 293 10 IU 2012 24-May 761 14
IU 2013 21-Mar 203 -2 IU 2013 31-May 749 21
MI 2012 10-Apr 340 18 MI 2012 21-May 721 11
MI 2013 9-May 559 47 MI 2013 31-May 732 21
Average 22-Mar Average 9-May
Average (Mean ± SE) 264.47 ± 41.88 Average (Mean ± SE) 613.42 ± 43.57
Orchard Year Date DD > 6ºC (1 Jan) Observed - Estimated Orchard Year Date DD > 6ºC (1 Jan) Observed - Estimated
MO 2011 2-May 576 46 MO 2011 14-Jun 1129 1
MO 2012 5-Mar 126 -12 MO 2012 21-May 721 -23
MO 2013 31-Jan 47 -46 MO 2013 13-Jun 904 0
BB 2010 26-Apr 434 40 BB 2010 22-Jun 1115 9
BB 2011 19-Apr 492 33 BB 2011 14-Jun 1177 1
BB 2012 17-Apr 413 31 BB 2012 22-May 789 -22
BB 2013 13-Mar 188 -4 BB 2013 28-Jun 1174 15
IU 2011 30-Mar 250 13 IU 2011 22-Jun 1240 9
IU 2012 15-Mar 174 -2 IU 2012 13-Jun 1078 0
IU 2013 21-Jan 27 -56 IU 2013 13-Jun 916 0
MI 2012 27-Mar 243 10 MI 2012 11-Jun 1055 -2
MI 2013 21-Jan 27 -56 MI 2013 28-Jun 1117 15
Average 16-Mar Average 13-Jun
Average (Mean ± SE) 249.73 ± 54.41 Average (Mean ± SE) 1034.54 ± 47.40