1
STATISTICAL LEARNING METHODS APPLIED TO ROAD
PAVEMENT CLASSIFICATION
J. P. Paulo12, J. L. Bento Coelho2
1ISEL, Instituto Superior de Engenharia de Lisboa, Portugal
jpaulo@deetc.isel.ipl.pt
2 CAPS, DEEC, Instituto Superior Técnico, TULisbon, Portugal
bcoelho@ist.utl.pt
Abstract
The measurement procedure to evaluate the influence of road surface characteristics on vehicle and traffic noise is designated by Close-Proximity (CPX) method, as described in the ISO 11819-2 draft. This procedure consists on acquiring the vehicle rolling noise signal near the tires and close to the surface by means of at least two microphones in a special arrangement. The main goal of this research is to identify and classify different types of road pavements by analyzing the near field sound profile using Statistical-learning methods. Feature extraction and selection is one of the first procedures on a classifier system. Moreover, the accuracy of the results is strongly dependent on the choice of the selected feature vector. An important issue of road pavement classification regards the improvement of the quality of road traffic data in order to increase the accuracy of the road noise mapping models. Results based on the probability of costly errors are presented and discussed. The resulting approach is evaluated with respect to classification accuracy and computational cost.
Resumo
O procedimento utilizado para avaliar a influência das características dos pavimentos rodoviários no veículo e no ruído junto da fonte sonora designa-se por método de Proximidade Imediata, CPX, conforme consta na norma ISO 1182-2 draft. Este método consiste em medir o ruído junto a uma roda num veículo em movimento utilizando um conjunto de pelo dois microfones. Os objectivos principais desta investigação são identificar e classificar diferentes tipos de superfícies rodoviárias com base na análise das características do ruído captado em campo próximo recorrendo a técnicas de aprendizagem estatística. Extracção e selecção de características é um dos primeiros passos associados a um sistema de classificação sendo que os resultados dependem fortemente do vector de características escolhido. A classificação de pavimentos permite melhorar os dados de entrada utilizados nos modelos dos mapas de ruído. Os resultados apresentados evidenciam a precisão da classificação e o custo computacional.
2
1
Introduction
Measures aiming at environmental noise abatement usually consider acoustic barriers alongside the road. However, the cost associated to these measures is usually considerably high and its applicability in urban areas is reduced. The problem of the visual impact introduced by applying these measures is another issue affecting the acceptance of the communities.
Nowadays, road planners are considering low noise surfaces as an alternative. These types of surfaces are built basically by changing the texture and/or porosity of the surface mixtures. In some conditions, noise levels abatements up to 15 dB can be achieved. Therefore, a considerable variety of different surfaces are available.
The road planners, road administrators and contractors frequently face the problem of knowing exactly the correlation between the type of surfaces and the noise emission profile, along the time of the road operation. Furthermore, different methodologies to assess the quality of the surface during the lifetime are used. However, the changing of the noise characteristics is not considered. A survey regarding the enumeration of the characteristics for the different types of road surfaces is also a helpful tool to provide guidelines for the road decision-makers [1].
2
Methodologoy
A set-up was implemented to classify road surfaces types by using the noise generated by the tire/surface interaction on a moving vehicle. The signal noise acquisition is carried out by means of two microphones connected to a sound board.
Two different situations are often considered: (i) long term road analysis, surveying a net road searching for inhomogeneities of the surface between two locations (the road extend can have several types of pavements) and (ii) short road segments, of a few hundred meters (usually constituted by only one type of pavement). Therefore, at least for the first situation, the results should be presented in a geographical map, showing the locations of the surface types and the noise emission levels. This is achieved by using the information provided by a GPS device. The use of this device has the additional advantage of yielding an estimate of the vehicle speed for each geographic coordinate along the journey. The general block diagram is depicted in Figure 1.
3
The analysis is conducted for different speed levels of the vehicle in order to evaluate the behavior of the noise characteristics as function of speed. However, a speed of 80Km/h only is used in this study. This constraint is avoided by applying a convenient speed factor correction. All the noise characteristics used on the pavement classification, excluding the noise levels, are almost preserved.
Close Proximity noise measurements were based on the standard draft method for measuring the influence of road surfaces on traffic noise under conditions where tire/road noise dominates (the power unit noise, the intake noise and the exhaust noise can be neglected for speeds above 50Km/h, at least for light vehicles). This method involves the measurement of the tire-pavement noise emission using microphones mounted near to one wheel of the vehicle.
The calibration procedure, following the standards, was applied to each microphone at the beginning of the tests. This procedure assures the conformity of the complete measurement chain.
The acquired signals were stored and processed in a dedicated audio set-up based on the Matlab platform.
2.1 Noise acquisition arrangement
To carry out the CPX measurements, a support structure was designed to hold the mandatory microphones steady and in the right position. The basic hardware to implement the complete system consists on (A) an aluminum structure fixed to the vehicle chassis to mount the microphones, (B) a set of two ½ inch condenser microphones with omidirectional pattern radiation, (C) an external sound board with at least 2 line In/Out, (D) a GPS device, (E) a personal computer and (F) a DC-AC power inverter (12Vdc to 230Vac) to feed the devices [2].
2.2 Pavement types
[image:3.612.93.475.456.648.2]A pavement database was built consisting of seven general surface types, as depicted in Figure 4. Among these different types of pavement an old one is also tested. These surface types are considered the most relevant pavements used in the Portuguese roads.
Figure 4 - Pavements analyzed in this study. 1- dense asphalt (PA) (new), 2- gap graded asphalt rubber (GGAR), 3- rough thin layers (RTL), 4- dense asphalt (DA) (old), 4- dense asphalt (DA) (old), 6-
4
2.3 Classifier processing modules
The classifier system is trained by using the signal acquired by the microphones for each type of pavement. Therefore, the module used for the classification corresponds to a supervised learning approach. A database populated by entries describing the different types of surfaces, models, can be built a priori [3, 4].
The different modules of the complete classifier system are described as follows:
Pre-processing – this module is responsible by applying the A-weighted curve to the signal. This
procedure has two benefits: to remove the low frequency band energy which is generated mostly by the air flow of the moving vehicle, and to be in accordance with the energy perceived by the auditory human system (loudness curve).
The tire/road noise generation phenomena is basically due to two different types of mechanisms: excitation of the tire structure by vibrations, leading to radiation of sound, and aerodynamic effects. Sound radiation is mainly due to radial vibrations of the tire structure as well as vibrations of the sidewalls, the latter in minor scale and mainly at low frequencies. The changes of contact forces over time can be due to different effects: inhomogeneities (e.g. the tire nonuniformity) and defects of the tire structure, tread pattern geometry, road texture, processes in the contact such as stick slip and stick snap. Firstly, the tangential and radial forces lead to friction mechanisms, which in turn lead to stick-slip when the tread blocks are in contact with the road. Secondly, when the tread blocks are on the way to lose contact with the road, some adhesive forces will tend to keep them in contact with the road. At the same time, stick-snap will appear. As a rule of thumb, one can expect tire vibrations as the main source for frequencies below 1000Hz. Above 1000Hz, the noise generation is interpreted as air-pumping. As the tread of the tire enters the leading edge of the road contact area, air is squeezed out as the tread, it is compressed and as it penetrates into the road surface. At the trailing edge, the tread is decompressed and lifts up from the road surface, with the result that air rushes back to fill the voids. The multitude of generation mechanisms makes the picture of tire/road noise generation diffuse and the decision for a modeling strategy rather difficult. The problem becomes even more serious due to the complexity of the radiation conditions for both vibration and aerodynamic sources.
Therefore, the noise spectrum should be split into several complementary frequency bands following the tire/pavement noise generation phenomena in order to increase the performance of the classifier. For the purposes of the current work, three frequency bands were used. The frequency bands range is defined as follow: low band (200 1400 Hz), middle band (1400 3000 Hz) and high band (3000 8000 Hz). Additionally, in some analysis, the noise spectrum is split in 1/3 octave bands, for better frequency discrimination. However, the full band is analyzed as a supplementary approach.
In order to improve the results on the classification stage and to compare results, the smoothing technique is optionally applied.
All these procedures are performed by time segmentation (windowing procedure) of the signal captured by the microphones. The time window duration adjustment is used to identify short duration events such as vehicles passing-by and surface deficiencies, removing this disturbing noise.
5
The road pavement classification process begins with the extraction of a set of features, i.e., feature vectors, from each sound file. Features are evaluated for noise segments of 10 and 20 seconds using consecutive 2048-sample frames (32 kHz sampling rate) with a hop-size of 512. The feature vectors are grouped into classes based on the type of pavement.
The feature selection procedure is applied to remove some redundant characteristics, decreasing the dimension of the vector of features, in order to decrease the computational load making the convergence of the process classification more easily. However, the vector of features should describe all the main characteristics of the road surface.
The feature set used corresponds to: (1) overall noise levels - LAeqFull;
(2) band noise levels: low band - LAeqLo, middle band - LAeqMid and high band – LAeqHi.– this feature (short time average energy A-weighted) is defined as:
1
( ) ( ) ( ) W
i
E s i s i w n i
W
= − (1)
where w(n) is the hanning window; (3) the spectral centroid - Ct;
(4) the spectral centroid band: low band - CtLo, middle band - CtMid and high band – CtHi. This feature is based on the short-time Fourier Transform, which is performed frame by frame along the time axis. Let
{
( )}
M0i u
F f ui
=
= represent the short-time Fourier transform of the ith frame, where M is the
index of the highest frequency band. The Spectral Centroid of the frame ith is defined as:
2 0
2 0
( ) ( ) M
i u
i M
i u
u f u SC
f u
=
=
=
(2)
(5) the spectral maximum energy – FreqMaxLAeq. This feature is calculated by the spectral peak energy with averaging N consecutive frames (moving average method), in this study N=2
2
1
max ( )
2 1
i n
i u i n u
SME f u
N
+ = −
=
+ (3)
(6) 1/3 octave frequency bands - Oct13B.
The RMS value is, with no doubt, the feature that better describes the type of surface, given its close relation to the noise energy level perceived by the human auditory system. However, the RMS value is strongly dependent on several factors, such as the speed of the vehicle, the type of tires and the age of the pavement. Therefore, a combination of the features is necessary.
At this stage, the data base of the road surface models is implemented.
Training (learning) – The feature vectors from each class are divided into two sets, a training set and
6
90 95 100 105 110 115 120
0 0.1 0.2 0.3 0.4 0.5 0.6
0.7 Density function (Feature - LAeqFull)
SPL (dB) D en si ty PA GGAR RTL DA CC PCS ARR
90 95 100 105 110 115 120
0 0.1 0.2 0.3 0.4 0.5 0.6
Density function (Feature - LAeqLo)
SPL (dB) D en si ty PA GGAR RTL DA CC PCS ARR
85 90 95 100 105 110 115 120 0 0.1 0.2 0.3 0.4 0.5 0.6
Density function (Feature - LAeqMid)
SPL (dB) D en si ty PA GGAR RTL DA CC PCS ARR
60 65 70 75 80 85 90 95 100
0 0.05 0.1 0.15 0.2 0.25 0.3 0.35 0.4
Density function (Feature - LAeqHi)
SPL (dB) D en si ty PA GGAR RTL DA CC PCS ARR
400 600 800 1000 1200 1400 1600 1800 2000 0 0.002 0.004 0.006 0.008 0.01 0.012
0.014 Density function (Feature - Ct)
Freq (Hz) D en si ty PA GGAR RTL DA CC PCS ARR
600 700 800 900 1000 1100 1200 1300 0
0.005 0.01 0.015 0.02
0.025 Density function (Feature - CtLo)
Freq (Hz) D en si ty PA GGAR RTL DA CC PCS ARR
14000 1600 1800 2000 2200 2400 2600 2800 3000 0.002 0.004 0.006 0.008 0.01 0.012
0.014 Density function (Feature - CtMid)
Freq (Hz) D en si ty PA GGAR RTL DA CC PCS ARR
60000 7000 8000 9000 10000 11000 12000 13000 0.2 0.4 0.6 0.8 1 1.2 1.4 1.6x 10
-3 Density function (Feature - CtHi)
[image:6.612.99.503.97.646.2]Freq (Hz) D en si ty PA GGAR RTL DA CC PCS ARR
7
Discriminant functions are evaluated by defining the best decision boundary curves (hypersurfaces) for the classifier.
Classification (pattern recognition) – Each sound file used Bayesian theory to find which class it most
probably belongs.
3
Results
The data samples are classified in a specific class depending on its location on the feature space. In this study, 8 features are considered. In the Figure 6, the feature space is depicted in 2D for simplicity and for 3 features pairs (LAeqFull - CtLo, LAeqFull - CtMid, LAeqFull - CtHi).
80 85 90 95 100
750 800 850 900 950 1000 1050 1100 1150 1200
SPL (dB)
Fr
eq
(H
z)
Feature Space (SPL - Spectral Centroid Hi Band)
PA GGAR RTL DA CC PCS ARR
80 85 90 95
1800 2000 2200 2400 2600 2800
SPL (dB)
Fr
eq
(H
z)
Feature Space (SPL - Spectral Centroid Hi Band) PA GGAR RTL DA CC PCS ARR
60 65 70 75
7500 8000 8500 9000 9500 10000 10500 11000 11500
SPL (dB)
Fr
eq
(H
z)
[image:7.612.105.500.262.542.2]Feature Space (SPL - Spectral Centroid Hi Band) PA GGAR RTL DA CC PCS ARR
Figure 6 - Feature space in 2D. 1- SPL vs. Centroid Lo Band (topmost), SPL vs. Centroid Mid Band (middle) Noise Levels vs. Centroid Hi Band (downmost).
The observation of the figures reveals that the GGAR and RTL pavement types are similar for the frequency bands low and middle. However, for the high frequency band (feature space LAeqFull – CtHi) these two classes can be easily separated.
8
101 102 103 104 105
0 10 20 30 40 50
60 CPX Noise
Freq (Hz) M ag ni tu de ( dB A ) PA GGAR RTL DA CC PCS ARR
Figure 7 - Pavement spectra for different surface types.
Each sub-feature space provides information on the best separation between the classes using the statistical classifier.
The result of the classification is assessed by means of the related confusion matrix. This matrix yields the error committed by the classifier.
The principal diagonal of the confusion matrix corresponds to the right pavement classification. The confusion matrix for the ideal classifier consists only on a diagonal matrix. The numeric values in each cell give the result of classification in percentage.
Confusion Matrix (%) (Features - LAeqFull, LAeqLo, LAeqMid, LAeqHi, Ct, CtLo, CtMid, CtHi, FreqMaxLAeq)
Estimated Pavement T ru e P av em en t 96.72 1.64 0.2 0 0 0 1.39 0.32 96.72 2.76 0 0 0 0.85 0.13 1.01 95.86 0 0.38 0.05 0.21 0 0 0.07 95.5 0.76 6.77 0.21 0 0 0.53 0 98.86 0.11 0.37 0 0 0.13 4.41 0 93.07 0.05 2.84 0.63 0.46 0.09 0 0 96.91
1 2 3 4 5 6 7
1 2 3 4 5 6 7
Confusion Matrix (%) (Features - LAeqFull, LAeqLo, LAeqMid, LAeqHi, CtS, CtLoS, CtMidS, CtHiS, FreqMaxLAeq)
Estimated Pavement T ru e P av em en t 97.35 0 0 0 0 0 0.32 0.19 99.18 0.79 0 0 0 0.64 0.19 0.38 99.15 0 0 0.05 0.11 0 0 0 99.82 0 1.65 0 0 0 0.07 0 100 0 0 0.13 0 0 0.18 0 98.29 0 2.14 0.44 0 0 0 0 98.93
1 2 3 4 5 6 7
[image:8.612.198.392.100.247.2]1 2 3 4 5 6 7
Figure 8 - Confusion Matrix using the Bayesian classifier. 1 - original features and 2 - features with smoothing.
The results of the classification for the pavements studied show a good accuracy with the true pavement. The results also show a lower error if the smoothing technique is applied to the features. However, the analyses with the original data should be evaluated not loosing information concerning spreading behavior of each feature.
9
As an attempt to overcome this problem, an additional approach using a feature space subset was tested. The subset used is related to features independent of the noise levels, such as the Ct, the CtLo, the CtMid, the CtHi and the FreqMaxLAeq. The results of pavement classification show insignificant errors. This finding suggests that a reduced number of features can be applied to the classifier without incurring in relevant uncertainties.
Confusion Matrix (%) (Features - Ct, CtLo, CtMid, CtHi, FreqMaxLAeq)
Estimated Pavement T ru e P av em en t 96.78 0.95 0.39 0 0 4.16 2.45 0.38 94.64 10.12 0 0 0.11 1.87 0.13 1.07 81.47 0.09 4.92 0 0.85 0.06 0.25 0.53 90.46 0.76 9.65 5.87 0 0.13 5.72 1.53 90.53 0 1.92 1.58 0.13 0.13 4.68 0.38 83.47 3.15 1.07 2.84 1.64 3.24 3.41 2.61 83.89
1 2 3 4 5 6 7
1 2 3 4 5 6 7
Confusion Matrix (%) (Features - CtS, CtLoS, CtMidS, CtHiS, FreqMaxLAeq)
Estimated Pavement Tr ue P av em en t 97.29 0 0 0 0 2.35 0.37 0 98.61 1.18 0 0 0 0.75 0 0.32 98.36 0 0.76 0 0 0 0 0 99.37 0 3.57 0 0 0 0.46 0 99.24 0 0 1.7 0 0 0.63 0 94.08 0 1.01 1.07 0 0 0 0 98.88
1 2 3 4 5 6 7
[image:9.612.181.414.417.581.2]1 2 3 4 5 6 7
Figure 9 - Confusion Matrix using the Bayesian classifier for a subset of the feature space. 1 - original features and 2 - features with smoothing.
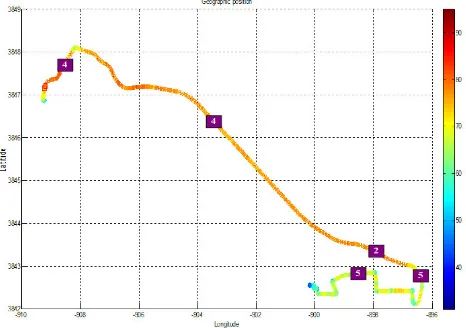
As a preliminary result, it can be stated that, in a first approach, the accuracy of the pavement classification is not affected by the vehicle speed, at least for the pavement types studied. The classified road pavements can be stretched over a geographical map showing the results of a road network survey, as depicted in Figure 10.
Figure 10 - Road pavement classification/localization by surveying with a GPS device.
4
Conclusions
10
A complete arrangement to acquire and process the noise signal captured near a testing tire was developed.
Results of road surface classification using this method show a good agreement with measurement, at least for seven different types of pavements tested.
As an extension of this research, each pavement should be tested for different stages of its age and traffic density. This procedure will allow a complete characterization of the pavement, providing guidelines to the pavement designers and builders.
Standard classifiers are being tested in order to establish guidelines for future developments of this research. A comprehensive framework to study and compare different approaches and algorithms is now being developed. A very important application of road pavement classification is the improvement of the accuracy of road traffic data for road noise modeling and mapping.
Acknowledgements
Research supported by the FCT-CAPS/IST plurianual funding through the POS_C Program that includes FEDER funds.
References
[1] Freitas, E., Paulo, J., Bento Coelho, J. L., Pereira, P.. Towards Noise Classification of Road Pavements. Proc. of EPAM 3, Coimbra, Portugal, 2008.
[2] ISO CD 11819-2 (2000). Acoustics – Method for Measuring the Influence of Road Surfaces on Traffic Noise – Part 1: The Close Proximity Method. International Organisation for Standardisation (ISO), Geneve, Switzerland.
[3] R.O. Duda and P.E. Hart. Pattern classification and scene analysis. Wiley, New York, 1973. [4] A. Papoulis. Probability, random variables and stochastic processes. McGraw-Hill series in electrical engineering. McGraw-Hill, New York, 1991.