INFLUENCES OF COLOR ON THE LOUDNESS JUDGEMENT
PACS: 43.66.Cb, 43.66.Lj
Patsouras, Christine; Filippou, Thomas G.; Fastl, Hugo
AG Technische Akustik, MMK, TU München Arcisstr. 21
80333 Munich Germany Tel: +49 89 28928553 Fax: +49 89 28928535 E-mail: Patsouras@mmk.ei.tum.de
ABSTRACT
In this study, the influence of an additionally presented optical component on the auditory judgement of loudness was investigated. Particularly, the impact of different colors of trains on the loudness judgement was focused.
Two train passings of ICEs served as acoustical stimuli. As optical stimuli there were available in addition to the alternative 'classical laboratory-situation' (which means no additional optical component) and the original appearance of the ICE (white with one red stripe) three more colorings (red, green and blue) which were realized by digital image editing.
At same acoustic stimulus, the color of an ICE train can influence the loudness rating in such way that red trains may be judged as being louder than green trains.
INTRODUCTION
It is well known from the literature that an additional visual presentation of the sound source can influence the attitude towards it significantly (e.g. Viollon et al. 1999, Abe et al. 1999, Suzuki et al. 2000, Hashimoto and Hatano 2001, Hatano et al. 2001). This could be verified mostly by means of the method of Semantic Differentials. However, it is a disadvantage of this method that mostly only qualitative changes in the attitude towards the sound source could be measured. Quantitative relations between the visual input and basic psychoacoustic sensation magnitudes can be hardly found in the literature. Therefore, in the present study the effort was undertaken to measure by means of an absolute magnitude estimation the impact of various visual stimuli (in particular different colorings) on the perceived loudness of train passings quantitatively.
As it is also well known from former investigations (Widmann 1992, Patsouras et al. 2001), loudness is an important parameter for the perceived annoyance or the rated sound quality of a product. This would mean that by the coloring of a product - if an impact on the perceived loudness could be proven - the annoyance or the sound quality of a product could be modified in a desired direction.
EXPERIMENTS
Stimuli
Two passings of an ICE recorded monophonically at a distance of 25 m served as acoustic stimuli. Their loudness-time functions are displayed in figure 1.
during the experiment. All sounds were presented diotically via a freefied equalized (Zwicker and Fastl 1999) electrodynamic headphone Beyer DT 48 with the original sound pressure level.
stimulus 1
0 20 40 60
0 5 10 15
time / seconds
lo
ud
ne
s
s
/
s
o
ne
stimulus 2
0 20 40 60
0 5 10 15
time / seconds
lo
ud
ne
s
s
/ s
o
n
[image:2.595.125.463.106.252.2]e
Fig. 1.- Loudness-time functions of the acoustic stimuli.
As optical stimuli, additional to the alternative 'classical laboratory-situation' (which means no additional optical component) the four pictures of ICEs plotted in figure 2 were presented to the subjects. The upper left panel shows the original appearance of an ICE, the other three panels illustrate the three realized colorings (red, green and blue).
Fig. 2.- Optical stimuli presented while hearing the train passings. In addition to the original appearance of the ICE (upper left panel) three more colorings (red, green and blue) were realized by digital image editing.
During the experiments, subjects were sitting with headphones in a quiet room looking on a 2 m distant projection wall of 3x3 meter size. In order not to draw the subjects' attention from the projection wall they had the task to speak their judgements in a microphone standing in front of them.
Methods
The aim was to get quantitative results how much an additional optical input changes the estimated loudness. Hence, no category estimation or judgement by semantic differential could be used, but a kind of magnitude estimation had to be applied. As the differences between one and the same stimulus only under different optical conditions should be measured, it was not possible to use the reliable method of "magnitude estimation with standard sound".
Therefore, the method of "free magnitude estimation" was chosen in which only the first stimulus has to be judged absolutely and the following stimuli with the preceding stimulus as standard.
[image:2.595.141.455.343.520.2]alternating with allover 42 dummy-combinations. To reduce context effects, each of the three times presented stimulus had a "new" precursor and a "new" successor, respectively. The experiment arranged in this way was presented to all subjects in the same order.
Subjects
All experiments were carried out with nine normalhearing subjects trained in psychoacoustic experiments (age between 24 and 32, median: 26 years).
[image:3.595.141.455.274.438.2]RESULTS
Figure 3 shows the estimated loudness of stimulus 1 for the different optical inputs presented. The black rhombs are representing the medians and interquartile ranges of the subjects' medians. The red stars symbolize the values of the geometric means. The dashed line indicates the value of the loudness judged without any additional optical input. The data were normalized on the combination 'stimulus 1 / without optical input'.
stimulus 1
80 90 100 110 120 130 140
red blue green original w ithout
optical input
re
l.
l
oudne
s
s /
%
Fig. 3.- Medians and interquartile ranges (black rhombs) and the geometric mean (red stars) of the loudness estimated for stimulus 1 for the different optical inputs. The dashed line indicates the median loudness judged without any optical input.
As concerns the medians, no matter whether presenting no optical stimulus or the original, the green or blue painted ICE, result in the same value for loudness. However, hearing stimulus 1 and looking at the red painted ICE, subjects judged the loudness 10 % higher than for the other combinations. Furthermore, the results for the blue and green painted ICE show pretty large inter-individual differences down to values in loudness of 85 and 80 %. The averaging with the geometric mean is in every case included in the interquartile ranges of the medians.
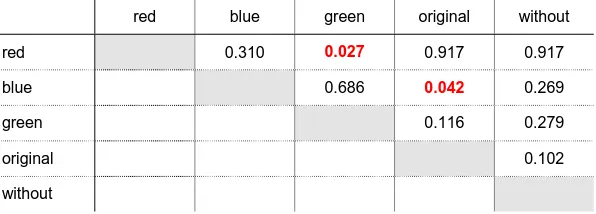
To prove which of the combinations are judged significantly different in loudness only due to the different optical input, the results of the Wilcoxon significance test are figured in the table below. Those values being significant on a significance level of 5 % are signed by bold red digits.
red blue green original without
red 0.310 0.027 0.917 0.917
blue 0.686 0.042 0.269
green 0.116 0.279
original 0.102
without
[image:3.595.153.451.615.722.2]According to the significance test of Wilcoxon stimulus 1 is judged two times significantly different in loudness, namely in the case presenting the red painted ICE or the green painted one, and in the case presenting the blue painted ICE or the original picture.
The results of the loudness judged for stimulus 2 under the different optical conditions are displayed in figure 4. Being in line with the loudness-time functions illustrated in figure 1, 'stimulus 2 / without optical input' is estimated 12.5 % louder than the 'combination stimulus 1/ without optical input'. However, for the case hearing stimulus 2 and presenting the different optical inputs results never in the same median loudness. Thus, while presenting the green painted picture, subjects judge the loudness on the average 12.5 % less, while presenting the red or the original picture 7.5 % more and while presenting the blue one about the same.
Once more the geometric means are included in the interquartile ranges of the medians.
stimulus 2
80 90 100 110 120 130 140
red blue green original w ithout
optical input
re
l.
l
oudne
s
s /
[image:4.595.139.456.224.394.2]%
Fig. 4.- Medians and interquartile ranges (black squares) and geometric means (red stars) of the loudness estimated for stimulus 2 for the different optical inputs. The dashed line indicates the median loudness judged without any optical input.
To comprehend which of the optical inputs causes for stimulus 2 significantly different judgements in loudness, the results of the significance test by Wilcoxon are figured in table 2. Again two combinations appeared to be judged as significantly different (on a significance level of 5 %) according to their loudness: in this case comparing the data of the red ICE and the original picture of the ICE as optical input with the data without optical input results in significant values.
red blue green original without
red 0.345 0.225 0.600 0.080
blue 0.686 0.116 0.465
green 0.225 0.715
original 0.068
without
DISCUSSION
As the impact of visual images on the judgement in loudness proved as a very subjective one, the single results of each of the nine subjects are figured below (stimulus 1 on the left hand side and stimulus 2 on the right hand side). The bars represent the differences judged in loudness relatively to the value given for the presentation without any optical stimulus.
Basically, the most influences could be measured with the red presentation (12 of 18 medians): three times loudness is judged lower but nine times higher (up to 40 %). In presenting the green coloring, 10 of the 18 medians show differences in loudness: five times with lower values but also five times with higher values, even if the differences in lower values are mostly larger. The presentation of the original picture causes also 10 of 18 medians to differ (8 times with higher values and only two times with lower values), whereas in presenting the blue coloring, half of the medians is judged different (4 times higher and 5 times lower values in loudness).
subject 1 -40 -20 0 20 40 -40 -20 0 20 40 subject 2 -40 -20 0 20 40 -40 -20 0 20 40 subject 3 -40 -20 0 20 40 -40 -20 0 20 40 subject 4 -40 -20 0 20 40 -40 -20 0 20 40 subject 5 -40 -20 0 20 40 -40 -20 0 20 40 subject 6 -40 -20 0 20 40 -40 -20 0 20 40 subject 7 -40 -20 0 20 40 -40 -20 0 20 40 subject 8 -40 -20 0 20 40 -40 -20 0 20 40 subject 9 -40 -20 0 20 40
red blue green o riginal without -40 -20 0 20 40
[image:5.595.111.487.237.716.2]red blue green original without
Only subject 1 sows the same impact of the different optical stimuli on loudness for both acoustic stimuli. Four subjects (subjects 5, 6, 7, and 8) feature the trend that for the louder stimulus (stimulus 2) the impact of the optical stimulus is reduced. However, for four subjects (subjects 2, 3, 4, and 9) the kind of impact is reversed for both acoustic stimuli.
Overall, there are subjects which show a very small impact in the case of visual input (e.g. subject 5), whereas other subjects (e.g. subject 4 or subject 8) show an immense manipulation in the loudness judgement up to differences of 40 %.
CONCLUSION
Presenting the picture of an ICE in different colors while listening to the passing of a train causes the subjects to judge the loudness of the passing in some cases significantly different. In the mean, differences in loudness up to 12 % could be measured. A red colored train and the presentation of the original appearance results in a higher estimated loudness, a green colored train seemed to reduce the perceived loudness. However, subjects judged often very distinct from each other: Whereas some subjects show strong impacts (differences in loudness up to 40 %), other subjects show nearly no influence.
ACKNOWLEDGEMENTS
This work was supported by the Deutsche Forschungsgemeinschaft (DFG) under FA 140/2.
BIBLIOGRAPHICAL REFERENCES
[1] Abe, K., Ozawa, K., Suzuki, Y., Sone, T. (1999): The Effects of Visual Information on the Impression of Environmental Sounds. In:Proc. inter-noise 99.
[2] Hashimoto, T., Hatano, S.: Effects of Factors other than Sound to the Perception of Sound Quality. In: Proc. International Congress on Acoustics Rom 2001.
[3] Hatano, S., Hashimoto, T., Kimura, Y., Tanaka, T., Sound Quality Evaluation of Construction Machine. In: Proc. International Congress on Acoustics Rom 2001.
[4] Patsouras, Ch., Böhm, M.,: Visueller Kanal oder Ablenkung? Einfluß einer optischen Komponente auf die Beurteilung der Geräuschqualität. DAGA 2002.
[5] Patsouras, Ch., Fastl, H., Patsouras, D., Pfaffelhuber, K., Subjective evaluation of loudness reduction and sound quality ratings obtained with simulations of acoustic materials for noise control. In: Proc. Euronoise (2001).
[6] Suzuki, Y., Abe, K., Ozawa, K., Sone, T. (2000) Factors for perceiving sound environments and the effects of visual and verbal information on these factors. In: Contributions to Psychological Acoustics (A. Schick et al. Eds), BIS Oldenburg, 209-232.
[7] Viollon, S., Landavier, C., Drake, C.: A Sound Judgement Depending On The Urban Visual Setting? In: Forum Acusticum, Berlin, 1999.
[8] Widmann, U., Ein Modell der psychoakustischen Lästigkeit von Schallen und seine Anwendung in der Prxis der Lärmbeurteilung. Dissertation Technical University Munich (1992).