PERMANYER www.permanyer.com
ORIGINAL ARTICLE Rev Inves Clin. 2015;67:258-65
Diagnostic Value of the Morphometric
Model and Adjusted Neck Circumference
in Adults with Obstructive Sleep Apnea
Syndrome
Armando Castorena-Maldonado
1*, Laura Espinosa-Morett
2, Fernando Arredondo del Bosque
2,
José Luis Carrillo-Alduenda
1, Luis Torre-Bouscoulet
1, Juan Carlos Vázquez-García
1and José Rogelio Pérez-Padilla
11Sleep Disorders Clinic, Instituto Nacional de Enfermedades Respiratorias Ismael Cosío Villegas, México, D.F., México; 2Department of Otorhinolaryngology, Head and Neck Surgery, Instituto Nacional de Rehabilitación, México, D.F., México
Corresponding author:
*Armando Castorena Maldonado Sleep Disorders Clinic
Instituto Nacional de Enfermedades Respiratorias Ismael Cosío Villegas
Calzada de Tlalpan, 4502, Col. Sección XVI C.P. 14080, México, D.F., México
E-mail: [email protected] Received for publication: 07-10-2014 Accepted for publication: 10-12-2014
ABSTRACT
Background: Obstructive sleep apnea syndrome is a major public health problem. The morphometric model and the Sleep
Apnea Clinical Score are widely used to evaluate adults; however, neither of these tools has been validated in a Mexican popu-lation. Objective: To determine the diagnostic value of the morphometric model and the Sleep Apnea Clinical Score and compare
them with conventional clinical instruments. Methods: A total of 97 individuals were recruited prospectively. Initial screening
excluded 36, of whom nine were subjects without apnea; the remaining 52 were consecutive patients with obstructive sleep apnea syndrome diagnosed by nocturnal polysomnography. Diagnostic values of each test were calculated. Results: Obstructive
sleep apnea syndrome patients had significantly higher scores with both instruments than controls: morphometric model: 61.3 (95% CI: 45.5-75.3) vs. 41.0 (95% CI: 35.6-45.6); Sleep Apnea Clinical Score: 45.3 (95% CI: 39.5-40.3) vs. 36 (95% CI: 34.0-36.5), respectively. For severe cases, the best cutoff point for morphometric model was 46, with a sensitivity of 81% (95% CI: 62.5-92.6) and specificity of 46.7% (95% CI: 66.4-100), while for Sleep Apnea Clinical Score it was > 48, with a sensitivity of 61% (95% CI: 46.1-74.2) and specificity of 80.4% (95% CI: 66-90.6). Conclusions: A morphometric model value of ≥ 46 or an adjusted
neck circumference (Sleep Apnea Clinical Score) > 48 were adequate for diagnosing obstructive sleep apnea syndrome. (REV INVES CLIN. 2015;67:258-65)
Key words: Obstructive sleep apnea syndrome. Morphometric model. Sleep apnea. Clinical scores.
.r
e
hsi
l
b
u
p
e
ht
f
o
n
ois
si
mr
e
p
ne
tti
r
w r
oir
p
e
ht
t
u
o
hti
w
g
ni
y
p
oc
ot
o
h
p r
o
de
c
u
d
or
pe
r
e
b
ya
m
n
oit
aci
l
b
u
p s
i
ht
f
o t
ra
p
o
N
INTRODUCTION
Obstructive sleep apnea syndrome (OSAS) is a disease characterized by repeated episodes of apnea during sleep, with complete or incomplete upper airway ob-struction that often cause blood oxygen desaturation and usually end with brief micro-awakenings from sleep1.
In Mexico City, it is estimated that 3.2% of the adult population ≥ 40 years of age suffer from OSAS. The most important associated factors are obesity, male gender, consumption of alcoholic beverages, and smok-ing2. Studies have proven that OSAS is an independent
factor in motor vehicle accidents3,4, arterial
hyperten-sion5, metabolic syndrome6, and premature
cardio-vascular death7. Delays in diagnosing this condition
inevitably lead to higher costs due to the increased need for medical care and hospitalizations and the accumulation of absences from work8-10.
The characteristics that predispose individuals to pha-ryngeal obstruction during sleep are obesity (increase of parapharyngeal fat), lymphoid hypertrophy, and alterations of the craniofacial morphology, all of which may coexist in the same patient11 and are
exacer-bated by the reduction of dilatory muscular activity during sleep. Some craniofacial characteristics have been related to OSAS and its severity, including maxil-lary retro-position, shortening of the mandibular body, lower displacement of the hyoids, retrognathia, type 2 malocclusion, and high-arched hard palate12,13.
Ethnic differences may also be a relevant contributing factor due to the dimensions of the pharynx. Li, et al., found that even in the absence of obesity, Asiatic traits contributed more to the severity of apneas during sleep than in cases of Caucasian patients with obesity14.
Similar findings have been described for American In-dians, Hispanic populations, and Asian groups com-pared to Caucasians, due to reduced dimensions of the upper airways15.
Timely identification of patients with a high risk of developing OSAS will allow the health sector to initi-ate medical treatment designed to reduce that risk, especially in light of the dramatic finding that con-tinuous positive airway pressure therapy (CPAP) pro-duces an estimated increase in life expectancy of 13 years, adjusted by the quality of life in the typical patient with severe OSAS16.
Since OSAS is a national public health problem, it is important to determine the best methods to identify high-risk patients and provide prompt referral to spe-cialized services. Therefore, the objective of this study was to compare the diagnostic performance of a cra-niofacial morphometric model (MM) for diagnosing OSAS17 with the simplified scale of adjusted neck
cir-cumference (Sleep Apnea Clinical Score, or SACS)18,
in relation to body mass index (BMI) and Mallampati Class (MC) of the upper airway, two methods now commonly used to predict OSAS.
MATERIALS AND METHODS
Study population
This was a prospective study of a group of adult patients with OSAS and a comparison group composed of adults without respiratory symptoms or history of chronic dis-ease, never-smokers (i.e., smoked < 400 cigarettes during their lives), and without obesity. Subjects were recruited at the Sleep Disorders Clinic of the National Institute of Respiratory Diseases in Mexico City. All subjects gave their informed consent to participate; the study was approved by the Institutional Bioethics Committee. Potential subjects were excluded if they had craniofacial malformations, alveolar hypoventila-tion (oxygen saturahypoventila-tion ≤ 88% and carbon dioxide ≥ 45 mm Hg), or oral malocclusion. To calculate sample size, we used data published by Kushida, et al.17 for
average MM, as follows: 95.3 ± 21.2 for OSAS pa-tients, and 61.6 ± 6.2 for controls; α = 0.05, β =0.90,
relation to samples = 1:5. We also calculated the area under the curve (AUC) reported by those authors, with
α = 0.05, β =0.90 and a relation of 1:5. This procedure
resulted in the selection of 25 OSAS patients and five controls, adding 20% for possible losses, for a total sample size of 30 cases and six controls. Data were obtained using the computer program PASS (NCSS, Utah, USA) 2008.
Patient evaluation
Patients were examined by nocturnal polysomnogra-phy (PSG) using a Grass polygraph (Grass-Telefactor, Astro Med Inc., West Warwick, RI, USA) recording electroencephalogram (F4M1, C4M1, O2M1), electro-oculogram, chin electromyogram, anterior tibialis elec-tromyography, nasal thermistor and nasal tip flow,
.r
e
hsi
l
b
u
p
e
ht
f
o
n
ois
si
mr
e
p
ne
tti
r
w r
oir
p
e
ht
t
u
o
hti
w
g
ni
y
p
oc
ot
o
h
p r
o
de
c
u
d
or
pe
r
e
b
ya
m
n
oit
aci
l
b
u
p s
i
ht
f
o t
ra
p
o
N
suprasternal microphone to monitor snoring, body position sensor, electrocardiogram, oxygen saturation by a pulse oximeter, and respiratory movements by inductance plethysmography. Evaluation of all studies was performed manually following the criteria of the American Academy of Sleep Medicine19.
Definitions
Apnea was defined as an interruption of airflow of at least 10 seconds’ duration, and hypopnea as a reduc-tion of the amplitude of nasal flow > 50% compared to baseline for more than 10 seconds, associated with oxygen desaturation > 3% or electroencephalograph-ic arousal. These events were classified as obstructive when they occurred in association with inspiratory movements (effort). In contrast, they were classified as central if there was no evidence of inspiratory effort. Disease severity was categorized in accordance with the Apnea and Hypopnea Index (AHI), as follows: without apnea, AHI < 5; mild OSAS, AHI of 5 to < 15; moderate OSAS, 15 to < 30; severe OSAS as ≥ 30 events per hour.
Measurements
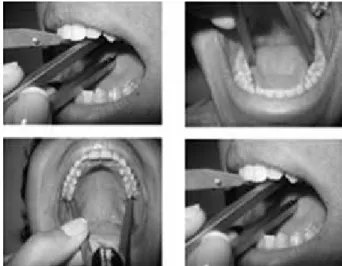
On the morning after evaluation, two certified oto-laryngologists examined the patients and controls independently. Measurements included: weight using a scale with a handrail (SECA mod.644), standing height using a stadiometer (SECA mod. 2.23), and neck circumference (at the level of the cricothyroid mem-brane) using a non-extendible tape measure graduated in centimeters (Hergom mod. R12). To measure the morphometric variables, patients sat in an examination chair with the backrest at 90°. Measurements of the oral cavity were performed with an electrocardiogram compass (Miltex Inc., ref 1-3015) with the sharp tip previously removed to leave a blunt surface to avoid injuring the patients’ mucosa. The points of the com-pass were placed between the oral structures to be measured and, without modifying the mouth opening, a flexible ruler graduated in millimeters was used to record measurements. To determine the height of the hard palate, the compass previously opened to 20° with a protractor was placed between the central right incisors to obtain the desired oral aperture, and then the distance between the hard palate and the dorsal area of the tongue at rest was measured. Figure 1 il-lustrates the method used to obtain these data, as
well as the formula employed for the morphometric calculations. The SACS were calculated by determin-ing the neck circumference in centimeters and then adding a factor of four for the presence of systemic arterial hypertension (≥ 140/90 mmHg), three for habitual snoring (at least three times per week), and three more if the patient had observed apneas. Accord-ing to the authors, scores ≤ 43 reflected low probabil-ity, from 43-48 medium probability (4-8 times more probable), and > 48, high probability (20 times more probable) for suffering OSAS18.The MC was
deter-mined according to the study by Nuckton, et al.20.
Statistical analysis
Data were analyzed using STATA 10.1 statistical pro-gram including the calculation of MM and SACS scores. The variables were summarized in accordance with
Figure 1. Demonstration of the method and formula of the morphometric model.
P + (Mx – Mn) + 3 × OJ +3 x (Max [BMI – 25.0]) × (NC/BMI), where,
P = (high palate, mm): distance between dorsal of tongue (me-dial lingual groove) and the highest point of the palate. Tongue in rest position and the point of the maxillary and mandibu-lar incisor at an angle of 20° to the mandibumandibu-lar condyle. Mx: intermolar maxillary distance (mm): distance between the mesial surfaces of the crowns of the second maxillary molars. Mn: intermolar mandibular distance (mm): distance between the mesial surfaces of the crowns of the second mandibular molars.
OJ: horizontal overlap of the crowns of the central right maxillary and mandibular incisors.
BMI: body mass index (kg/m2).
NC: neck circumference (cm) at the level of the cricothyroid membrane.
.r
e
hsi
l
b
u
p
e
ht
f
o
n
ois
si
mr
e
p
ne
tti
r
w r
oir
p
e
ht
t
u
o
hti
w
g
ni
y
p
oc
ot
o
h
p r
o
de
c
u
d
or
pe
r
e
b
ya
m
n
oit
aci
l
b
u
p s
i
ht
f
o t
ra
p
o
N
their distribution for later processing by bivariate anal-ysis and equal populations analanal-ysis via a Kruskal Wallis test. We calculated diagnostic performance following the model proposed by Seed and Tobias21.
Construc-tion of ROC curves was carried out using the non-parametric method. The dependent variable was MM or SACS, while the independent variables were clinical signs and PSG. Correlations were obtained using the non-parametric method.
RESULTS
Of the 97 patients originally recruited, 36 were ex-cluded because they lacked all of the dental pieces required to obtain the measurements. This left 52 OSAS patients and nine healthy subjects in terms of respiration to be studied. Mean age was 40 years for the OSAS group and 31 years for the control group. Mean BMI was 31.7 kg/m2 for OSAS patients and
24.9 kg/m2 in the control group (p = 0.001). Table 1
presents the general characteristics of the study pop-ulation. The MC, neck circumference, BMI, and SACS were statistically different between the two groups. While the MM score differed between the two groups, no measurements of the craniofacial components were
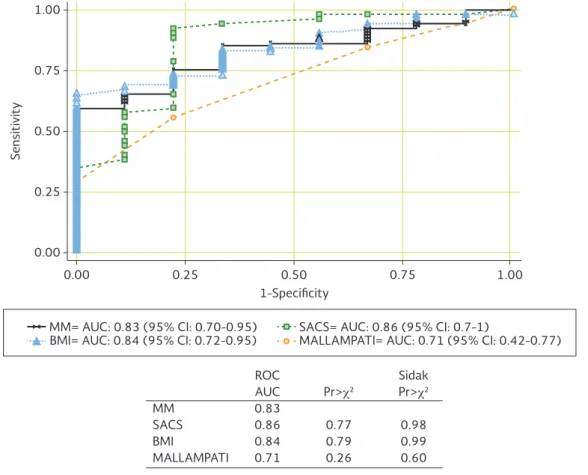
statistically significant; high-arched hard palate, inter-molar maxillary distance, interinter-molar mandibular dis-tance, and horizontal overlapping between incisors. Cor-relation of the AHI with MM was rs = 0.52 (p < 0.001), with SACS rs = 0.72 (p < 0.001), with BMI rs = 0.57 (p < 0.001), and with the MC rs = 0.56 (p < 0.001). The AUC from ROC curves did not differ among MM, SACS and BMI, while the MC performed significantly worse (Fig. 2). For diagnosing OSAS (AHI ≥ 5), a BMI ≥ 25 had the highest sensitivity, followed by SACS > 43, while the highest specificity was achieved by MM score of 70, followed by the MC IV (Table 2).
For our study population, we found that an MM score of 46 as a threshold had the highest positive likeli-hood ratio (LR+), at 3.4, sensitivity that exceeded
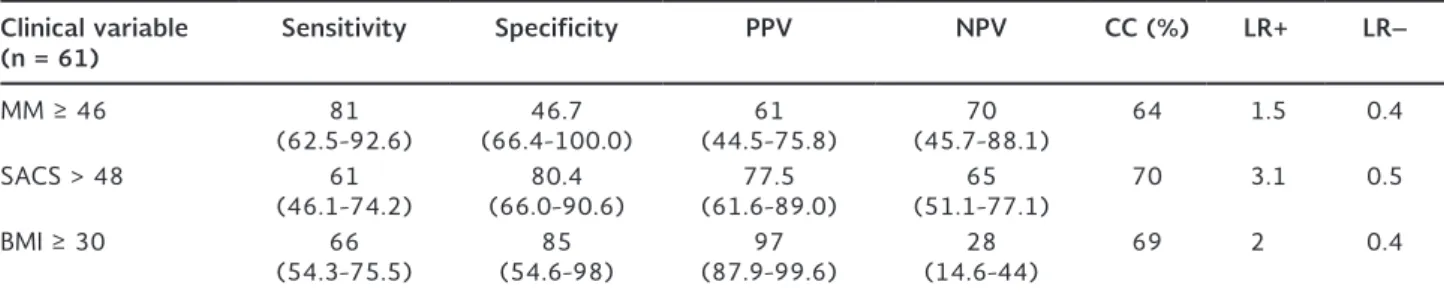
75% (95% CI: 61-86), specificity of 78% (95% CI: 40-97.2), and a correct classification rate of 75.4%. Given these results and our aim to determine the best clinical instrument for identifying severe OSAS cases (AHI ≥ 30), we analyzed adjusted neck circumference (SACS > 48) and the variable of obesity (BMI ≥ 30). Table 3 presents this analysis in detail.
On the other hand, the correlation of severe OSAS with the MM of 46 was rs = 0.29 (p = 0.14), with
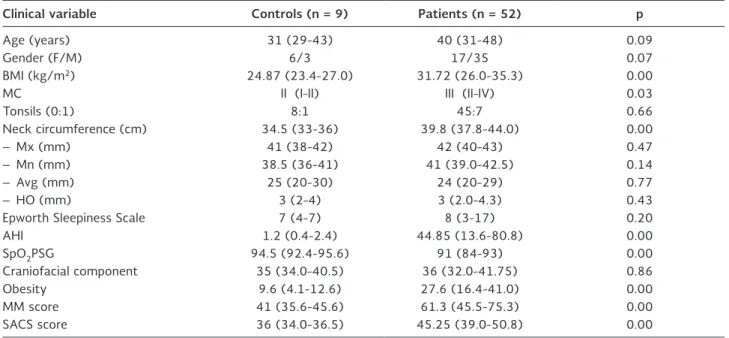
Table 1.General characteristics of the study population
Clinical variable Controls (n = 9) Patients (n = 52) p
Age (years) 31 (29-43) 40 (31-48) 0.09
Gender (F/M) 6/3 17/35 0.07
BMI (kg/m2) 24.87 (23.4-27.0) 31.72 (26.0-35.3) 0.00
MC II (I-II) III (II-IV) 0.03
Tonsils (0:1) 8:1 45:7 0.66
Neck circumference (cm) 34.5 (33-36) 39.8 (37.8-44.0) 0.00
– Mx (mm) 41 (38-42) 42 (40-43) 0.47
– Mn (mm) 38.5 (36-41) 41 (39.0-42.5) 0.14
– Avg (mm) 25 (20-30) 24 (20-29) 0.77
– HO (mm) 3 (2-4) 3 (2.0-4.3) 0.43
Epworth Sleepiness Scale 7 (4-7) 8 (3-17) 0.20
AHI 1.2 (0.4-2.4) 44.85 (13.6-80.8) 0.00
SpO2PSG 94.5 (92.4-95.6) 91 (84-93) 0.00
Craniofacial component 35 (34.0-40.5) 36 (32.0-41.75) 0.86
Obesity 9.6 (4.1-12.6) 27.6 (16.4-41.0) 0.00
MM score 41 (35.6-45.6) 61.3 (45.5-75.3) 0.00
SACS score 36 (34.0-36.5) 45.25 (39.0-50.8) 0.00
F: female; M: male; BMI: body mass index; Tonsils, 0: non-obstructive, 1: obstructive; AHI: apnea/ hypopnea index; SpO2PSG: average oxygen saturation during polysomnography; MC: Mallampati class; SACS: Sleep Apnea Clinical Score; Mx: maximum; Min: minimum; Avg: average; HO: horizontal overlap. Values are expressed in frequencies or median (interquartile interval p25-p75).
.r
e
hsi
l
b
u
p
e
ht
f
o
n
ois
si
mr
e
p
ne
tti
r
w r
oir
p
e
ht
t
u
o
hti
w
g
ni
y
p
oc
ot
o
h
p r
o
de
c
u
d
or
pe
r
e
b
ya
m
n
oit
aci
l
b
u
p s
i
ht
f
o t
ra
p
o
N
0.00 0.00 0.25 0.50 0.75 1.00
Sensitivity
0.25 0.50
1-Specificity
0.75 1.00
ROC Sidak
AUC Pr>χ2 Pr>χ2
MM 0.83
SACS 0.86 0.77 0.98
BMI 0.84 0.79 0.99
MALLAMPATI 0.71 0.26 0.60 MM= AUC: 0.83 (95% CI: 0.70-0.95)
BMI= AUC: 0.84 (95% CI: 0.72-0.95) SACS= AUC: 0.86 (95% CI: 0.7-1)MALLAMPATI= AUC: 0.71 (95% CI: 0.42-0.77)
Figure 2. Receiver operating characteristic curves comparing morphometric model, Sleep Apnea Clinical Score, body mass index and Mallampati Class. No statistical differences were observed between these diagnostic instruments.
MM: morphometric model; SACS: Sleep Apnea Clinical Score; BMI: body mass index. ROC: receiver operating characteristic; AUC: area under the curve.
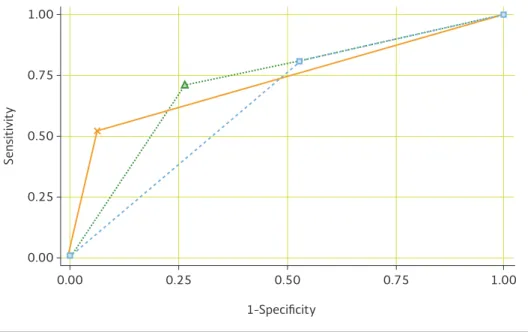
SACS > 48 rs = 0.51 (p < 0.001), and with BMI rs = 0.44 (p < 0.001). The largest AUC under these assumptions was for SACS > 48, although it was not statistically different from the other clinical tests (Fig. 3). In the logistical regression analysis for severe OSAS, SACS > 48 had an odds ratio (OR) of 12.5 (95% CI: 3.10-50.02, with a pseudo R2 of 0.20); for an MM of 46
the OR was 3.6 (95% CI: 2.2-20.6, with a pseudo R2
of 0.06); and for BMI ≥ 30 the OR was 6.7 (95% CI: 1.2-11.4, with a pseudo R2 of 0.15).
Because of the complexity involved in using MM, we conducted a reliability analysis of the results provided by the two otolaryngologists who examined the pa-tients. Inter-observer concordance was analyzed using the intra-class correlation coefficient (ICC) from a ran-dom sample of 22 participants (eight women, 14 men), of whom 19 were OSAS patients and three were con-trols. With respect to the height of the palate, the ICC was 0.40 (95% CI: 0.21-0.75) and the probability that
the two examiners would be similar, p = 0.03. For the intermolar maxillary distance, the result was 0.92 (95% CI: 0.85-0.99); for the intermolar mandibular distance, 0.91 (95% CI: 0.83-0.98); and for horizontal overlap-ping of incisors, 0.91 (95% CI: 0.84-0.94). For the cal-culation of MM, the ICC was 0.90 (95% CI: 0.81-0.98), and the probability that the measurements would be similar was statistically significant. Of the concordanc-es analyzed, we found that palate height measurement showed the largest variations between the two exam-iners, but the difference was not statistically significant and the calculation for the model was similar.
DISCUSSION
The morphometric model has been described as a clinical instrument with 100% sensitivity and speci-ficity with a cutoff point of 70, able to distinguish OSAS patients from controls17; however, our study
.r
e
hsi
l
b
u
p
e
ht
f
o
n
ois
si
mr
e
p
ne
tti
r
w r
oir
p
e
ht
t
u
o
hti
w
g
ni
y
p
oc
ot
o
h
p r
o
de
c
u
d
or
pe
r
e
b
ya
m
n
oit
aci
l
b
u
p s
i
ht
f
o t
ra
p
o
N
Table 3. The value of clinical instruments in the diagnosis of severe obstructive sleep apnea syndrome (Apnea/Hypopnea Index ≥ 30)
Clinical variable
(n = 61) Sensitivity Specificity PPV NPV CC (%) LR+ LR–
MM ≥ 46 81
(62.5-92.6) (66.4-100.0)46.7 (44.5-75.8)61 (45.7-88.1)70 64 1.5 0.4
SACS > 48 61
(46.1-74.2) (66.0-90.6)80.4 (61.6-89.0)77.5 (51.1-77.1)65 70 3.1 0.5
BMI ≥ 30 66
(54.3-75.5) (54.6-98)85 (87.9-99.6)97 (14.6-44)28 69 2 0.4
Values shown are percentages (95% CI). PPV: positive predictive value; NPV: negative predictive value; CC: correctly classified; LR+: positive likelihood ratio; LR–: negative likelihood ratio; MM: morphometric model; SACS: Sleep Apnea Clinical Score; BMI: body mass index
Table 2. The value of clinical instruments in the diagnosis of obstructive sleep apnea syndrome (Apnea/Hypopnea Index ≥ 5)
Clinical variable
(n = 61) Sensitivity Specificity PPV NPV CC (%) LR+ LR–
MM ≥ 70 37
(23.6-51.0) (66.4-100.0)100 (82.4-100.0)100 (10.3-36.8)21 46 1 0.6
SACS > 43 63
(51.6-73.4) (46.2-95.0)77 (85.1-98.9)95 (12.4-40.3)24 65 2.7 0.5
BMI ≥ 25 83
(69.7-91.8) (21.2-86.3)56 (79.6-97.6)92 (12.8-64.9)36 79 1.9 0.3
MC IV 32
(22.4-43.2) (64-100)92 (81.7-100.0)96 (9.3-28.4)17 40 4.2 0.74
Values shown are percentages (95% CI). PPV: positive predictive value; NPV: negative predictive value; CC: correctly classified; LR+: positive likelihood ratio; LR–: negative likelihood ratio; MM: morphometric model; SACS: Sleep Apnea Clinical Score; BMI: body mass index; MC: Mallampati Class.
was unable to reproduce these results. Our analysis of the craniofacial component showed no difference between OSAS patients and controls. In our study, the characteristic of obesity, not the craniofacial compo-nent, most accurately differentiated the two study groups. Craniofacial measurements were clearly lower (more normal) than those reported by Kushida, et al.17,a situation that might be related to differences
in facial structure. In the continuous data analysis, the AHI correlated moderately with MM, BMI, and MC, but the strongest correlation was found with adjusted neck circumference (SACS); likewise with the AUC, where the adjusted neck circumference was not statistically different from the other clinical variables. The MM has been studied in other populations. Jung et al., in a study of 70 Korean individuals22, 54 with OSAS
diag-nosed by PSG and 16 healthy, reported a sensitivity of 89%, specificity of 94%, positive likelihood ratio of 98%, and negative predictive value of 71%. Soares, et al.23 in Brazil studied a group of 80 patients, 60 of
whom were diagnosed with OSAS by PSG. Those au-thors proposed using the Kushida model as an instru-ment for classifying patients by degree of severity of OSAS, but were unsuccessful. All the scores they ob-tained using this model –including those of severe OSAS patients– were below 70, although they did observe a significant difference in the value of the model between groups.
There is still controversy over the role that different ethnicities may play in the obstruction of the upper airway during sleep. One review of the literature docu-mented that even in the presence of obesity, Asians had many more cases of severe apnea than Caucasians, and that Hispanic populations have seen an increase in the prevalence of OSAS related to obesity15,24. This
evidence is consistent with our findings. In one study in Japan, morphometric analysis was based on a tridimen-sional technique that obtained images using nuclear magnetic resonance. Those researchers found greater
.r
e
hsi
l
b
u
p
e
ht
f
o
n
ois
si
mr
e
p
ne
tti
r
w r
oir
p
e
ht
t
u
o
hti
w
g
ni
y
p
oc
ot
o
h
p r
o
de
c
u
d
or
pe
r
e
b
ya
m
n
oit
aci
l
b
u
p s
i
ht
f
o t
ra
p
o
N
0.00 0.00 0.25 0.50 0.75 1.00
Sensitivity
0.25 0.50 0.75 1.00
ROC Sidak
AUC Pr>χ2 Pr>χ2 SACS > 48 0.74
MM ≥ 46 0.64 0.1296 0.2424 BMI ≥ 30 0.72 0.7608 0.9428 SACS > 48 AUC = 0.74 (95% CI: 0.64-0.84)
BMI ≥ 30 AUC = 0.72 (95% CI: 0.61-0-84) MM ≥ 46 AUC = 0.64 (95% CI: 0.52-0.75) 1-Specificity
Figure 3. Receiver operating characteristic curves comparing morphometric model 46, Sleep Apnea Clinical Score > 48, and body mass index ≥ 30 kg/m2. No statistical differences were observed between these diagnostic instruments.
MM: morphometric model; SACS: Sleep Apnea Clinical Score; BMI: body mass index. ROC: receiver operating characteristic; AUC: area under the curve.
amplitude of mandibular divergence, and a shorter length and internal area of the base of the mandibular plane in OSAS patients compared with a control group, regardless of obesity. The tongue, soft palate, and lat-eral walls of the pharynx did not differ between groups25.
All of these findings lead us to think that other instru-ments should be included in the research of OSAS involv-ing different ethnicities. As derived from the diagnostic analysis of MM, the best cutoff point for our Mexican population was 46, a figure that markedly increased sen-sitivity without any considerable loss of specificity as 64% of participants were correctly classified.
The timely detection of patients with severe forms of OSAS is very important because they have a two- to three-fold higher risk of mortality from any cause, and this risk has been shown to be independent of obesity and cardiovascular disease26,27.It was this line
of thought that led us to test the diagnostic perfor-mance of MM 46, SACS > 48, and BMI of 30 kg/m2
in an effort to identify cases of OSAS that require urgent medical attention.
The reproducibility of the inter-observer measurements was adequate (inter-class correlation coefficient > 0.9), indicating that it is possible to obtain reliable mea-surements except for the height of the palate, since it requires an oral opening of exactly 20°. For this reason it achieved an ICC of only 0.4, although with greater variability but still acceptable for clinical work.
The SACS proved to be the clinical instrument that showed the best diagnostic properties in terms of sen-sitivity, specificity, and AUC, all of which combined to produce a higher proportion of individuals who were correctly identified. However, all of the clinical instru-ments tested in this study were useful in improving
.r
e
hsi
l
b
u
p
e
ht
f
o
n
ois
si
mr
e
p
ne
tti
r
w r
oir
p
e
ht
t
u
o
hti
w
g
ni
y
p
oc
ot
o
h
p r
o
de
c
u
d
or
pe
r
e
b
ya
m
n
oit
aci
l
b
u
p s
i
ht
f
o t
ra
p
o
N
simple clinical impressions, although MM may have the disadvantage of requiring more specialized training for its application and calculations.
Obstructive sleep apnea syndrome is a complex entity characterized by the collapse/obstruction of the upper airway during sleep. Physical examinations and explora-tions of the upper airway provide important data that may suggest the presence of this disease. While pre-dictive models cannot replace PSG as a diagnostic instrument, they have the potential to improve the efficiency in referring patients who require urgent study.
It is important to note that in our patient sample, we excluded 37% of the initial study population due to missing dental pieces, and that this is a significant limitation of predictive models in populations with unhealthy teeth.
The diagnostic value of an MM of ≥ 46 and adjusted neck circumference (SACS) were adequate for diag-nosing OSAS in patients with full dentition. In our study population, the best clinical instrument for identifying severe cases of OSAS was a SACS value of > 48.
REFERENCES
1. American Academy of Sleep Medicine. International classifica-tion of sleep disorders, 3rd ed. Darien, IL, USA. American Acad-emy of Sleep Medicine, 2014.
2. Bouscoulet LT, Vázquez-García JC, Muiño A, et al. PLATINO Group. Prevalence of sleep related symptoms in four Latin American cit-ies. J Clin Sleep Med. 2008;4:579-85.
3. Ward KL, Hillman DR, James A, et al. Excessive daytime sleepi-ness increases the risk of motor vehicle crash in obstructive sleep apnea. J Clin Sleep Med. 2013;9:1013-21.
4. Mulgrew AT, Nasvadi G, Butt A, et al. Risk and severity of motor vehicle crashes in patients with obstructive sleep apnoea/hy-popnoea. Thorax. 2008;63:536-41.
5. Durán-Cantolla J, Aizpuru F, Martínez-Null C, Barbé-Illa F. Obstruc-tive sleep apnea/hypopnea and systemic hypertension. Sleep Med Rev. 2009;13:323-31.
6. Alam I, Lewis K, Stephens JW, Baxter JN. Obesity, metabolic syndrome and sleep apnoea: All pro-inflammatory states. Obe-sity Rev. 2006;8:119-27.
7. Marin JM, Carrizo SJ, Vicente E, Agusti AG. Long-term cardiovas-cular outcomes in men with obstructive sleep apnoea-hypop-noea with or without treatment with continuous positive airway pressure: an observational study. Lancet. 2005;365:1046-53. 8. Smith R, Ronald J, Delaive K, et al. What are obstructive sleep
apnea patients being treated for prior to this diagnosis? Chest. 2002;121:164-72.
9. Ronald J, Delaive K, Roos L, et al. Health care utilization in the 10 years prior to diagnosis in obstructive sleep apnea syndrome patients. Sleep. 1999;22:225-9.
10. Leger D, Bayon V, Laaban JP, Philip P. Impact of sleep apnea on economics. Sleep Med Rev. 2012;16:455-62.
11. Schwab RJ. Upper airway and soft tissue anatomy in normal subjects and patients with sleep-disordered breathing. Am J Respir Crit Care Med. 1997;156:874-80.
12. Friedman M, Tanyeri H, La Rosa M, et al. Clinical predictors of obstructive sleep apnea. Laryngoscope. 1999;109:1901-7. 13. Schwab RJ, Gupta KB, Gefter WB, et al. Upper airway and soft
tissue anatomy in normal subjects and patients with sleep-dis-ordered breathing. Significance of the lateral pharyngeal walls. Am J Respir Crit Care Med. 1995;152:1673-89.
14. Li KK, Kushida C, Powell NB, Riley RW, Guilleminault C. Obstruc-tive sleep apnea syndrome: a comparison between Far-East Asian and white men. Laryngoscope. 2000;110:1689-93.
15. Villaneuva AT, Buchanan PR, Yee BJ, Grunstein RR. Ethnicity and obstructive sleep apnoea. Sleep Med Rev. 2005;9:419-36. 16. Mar J, Rueda JR, Durán J. Análisis Coste-Efectividad de los
Trat-amientos del Síndrome de la Apnea del Sueño en la Comunidad Autónoma del País Vasco. Investigación Comisionada. Vitoria-Gasteiz. Departamento de Sanidad, Gobierno Vasco, 2000. In-forme nº: Osteba D-01-01.
17. Kushida CA, Efron B, Guilleminault C. A predictive morphometric model for the obstructive sleep apnea syndrome. Ann Intern Med. 1997;127:581-7.
18. Flemons WW. Clinical practice. Obstructive sleep apnea. N Engl J Med. 2002;347:498-504.
19. Iber C, Ancoli-Israel, Chesson A, Quan SF. The AASM Manual for the Scoring of Sleep and Associated Events: Rules Terminology and Technical Specifications, 1st ed. Westchester, Illinois: Amer-ican Academy of Sleep Medicine, 2007.
20. NucktonT, Glidenn D, Warren S, Claman D. Physical examina-tion: Mallampati score as an independent predictor of obstruc-tive sleep apnea. Sleep. 2006;29:903-8
21. Seed PT, Tobias A. Stata 2004. Technical Bulletin. 2004;59:9-12. 22. Jung DG, Cho HY, Grunstein RR, Yee B. Predictive value of Kush-ida index and acoustic pharyngometry for the evaluation of upper airway in subjects with or without obstructive sleep ap-nea. J Korean Med Sci. 2004;19:662-7.
23. Soares MC, de Azeredo Bittencourt LR, Zonato AI, Gregório LC. Ap-plication of the Kushida morphometric model in patients with sleep-disordered breathing. Braz J Otorhinolaryngol. 2006;72:541-8. 24. Will MJ, Ester MS, Ramirez SG, et al. Comparison of
cephalo-metric analysis with ethnicity in obstructive sleep apnea syn-drome. Sleep. 1995;18:873-5.
25. Okubo M, Suzuki M, Horiuchi A, et al. Morphological analyses of mandible and upper airway soft tissue by MRI of patient with ob-structive sleep apnea/hypopnea syndrome. Sleep. 2006;29:909-15. 26. Punjabi NM, Caffo BS, Goodwin JL, et al. Sleep-disordered
breathing and mortality: A prospective cohort study. PLoS Med. 2009;6:e1000132.
27. Marshall NS, Wong KK, Liu PY, et al. Sleep apnea as an indepen-dent risk factor for all-cause mortality: The Busselton Health Study. Sleep. 2008;31:1079.
.r
e
hsi
l
b
u
p
e
ht
f
o
n
ois
si
mr
e
p
ne
tti
r
w r
oir
p
e
ht
t
u
o
hti
w
g
ni
y
p
oc
ot
o
h
p r
o
de
c
u
d
or
pe
r
e
b
ya
m
n
oit
aci
l
b
u
p s
i
ht
f
o t
ra
p
o
N