Green infrastructure design using GIS and spatial analysis: a proposal for the Henares Corridor (Madrid Guadalajara, Spain)
37
0
0
Texto completo
(2) Green Infrastructure design using GIS and spatial analysis: A proposal for the Henares Corridor (Madrid-Guadalajara, Spain) Since the late 20th century, the concept of green infrastructure (GI) has gained increasing recognition as a valuable approach to spatial planning. For example, the European Union is currently committed to the development of a Strategy on Green Infrastructure that promotes the use of nature-based green infrastructure solutions and contributes to conserving and improving our natural capital (EC, 2013a). Although GI is an eminently spatial element, there are still few instances where this type of infrastructure has been given explicit definition and delimitation. It is therefore necessary to develop methods capable of defining these infrastructures through explicit spatial suitability analysis of their component dimensions. Here, we present a methodology based on the use of Geographic Information Systems (GIS) to identify and map potential areas for inclusion in a GI in the Henares Corridor (Madrid-Guadalajara, Spain). As an first estimate of GI-related variables, for each point in the territory (pixel) we analysed four factors: the contribution to ecosystem services; ecological connectivity; ecological status; and proximity/potential accessibility to the public. The results of this analysis were combined using Multi-Criteria Evaluation (MCE) techniques, thus offering different alternatives for defining and designing GI. The GI maps obtained show better results in less restrictive situations, which could be considered to articulate the existing protected areas. Not only is our proposal a promising tool for defining this kind of infrastructure, but its implementation only requires a limited amount of base spatial datasets. Keywords: Green infrastructure, GIS, ecosystem services, ecological connectivity, OWA..
(3) 1. Introduction The various aspects of ecological planning have gained increasing importance since the last quarter of the 20th century (Botequilha-Leitao & Ahern, 2002; Ndubisi, 2003), giving rise to new methodologies and approaches to the planning process, as well as new concepts, among which green infrastructure (GI) is currently in ascendance. The Green Infrastructure Working Group (the first to use the term, Amundsen et al., 2009) defines GI as a network of interconnected green spaces that are planned and managed in a way that respects their ecological value and the benefits they can bring to man (Benedict & McMahon, 2002 and 2006). Other definitions add more detail to the concept, defining it as a multifunctional network of urban and rural, natural and seminatural spaces, new or existing (intercalated and connected), all of which share the capacity to provide the community with a variety of environmental and life-quality benefits by supplying a wide range of ecosystem services (Ahern, 2007; LUC, 2009; TCPA, 2012; Nature England, 2009; EC, 2013b). From these definitions, GI may be seen to be closely related to concepts like network, system or ecosystem services, to have a fundamentally spatial character, and to encompass different dimensions, for example: (1) multifunctionality, due to its potential to integrate different functions or activities in the same territory, different territorial elements, that is, which can provide numerous goods and services to community (Sbara et al., 2007; EC, 2010; EC, 2013a); (2) connectivity, both ecological and social (Pailet et al., 2017), since it consists of a network of natural and semi-natural areas and other environmental elements (EC, 2013b), which the public may access in order to enjoy the services and goods they can provide ; (3) conservation, because it promotes the conservation of valuable natural ecosystems and protects biodiversity; and (4).
(4) multiscalarity, since it is implemented on different scales, from the supranational to the local (TCPA, 2012). Although all these dimensions are of an eminently spatial nature (Mwirigi et al., 2012; Tzoulas et al., 2007), difficulties nevertheless arise in the spatially explicit design of territorial elements for inclusion in a GI. The increasing application of the concept to territorial planning makes it even more necessary to develop tools and procedures that help planners and local government, for example, to draw up spatial plans that identify and map potential elements for inclusion in a GI through suitability analysis. In this regard, several European regulations (EC, 2010; EC, 2013a and 2013b) provide general guidelines and recommendations for defining and establishing GI; similarly, several studies have already tried to map potentials areas for GI design, and thus, for example, Kopperoinen et al. (2014) used workshops and participatory techniques with different stakeholders to develop a method for assessing GI based primarily on mapping ES. Meanwhile, Kang and Kim (2015), employing a methodology based on landscape ecology, conducted a morphological spatial pattern analysis (MSPA) based on the study of the size, shape and connectivity of land-use patches, using the JCR software Guidos (Vogt, 2016). Along the same lines, Liquete et al. (2015) combined an ecosystem services and ecological connectivity-focused approach. To do this, they first assessed ecosystem services associated with land uses in order to identify core areas in the GI, after which they analysed the connectivity of these using some of the free applications most commonly employed in similar studies (Guidos and Linkage Mapper Connectivity Analysis Software). However, many of the proposals have focused on identifying core areas (Kang & Kim, 2015; Guo & Liu, 2016), either assessing the size of these (Kopperoinen et al., 2014) or, in the case of more integrated studies, excluding some of the dimensions that.
(5) might be considered crucial for their definition such as accessibility, i.e. the ease of public access to territorial elements, which is linked to the possibility of enjoying certain ecosystem services (Liquete et al., 2015). In order to overcome this lack of comprehensive approaches at the landscape or strategic non-urban level, this study presents a global methodological proposal for mapping GI through suitability analysis, using GIS and spatial analysis tools. We performed an analysis of related four factors: (1) the contribution of various territorial elements to ecosystem services; (2) the territory’s ecological connectivity; 3) its ecological status; and (4) the proximity to the population, in terms potential public accessibility. As a result, different suitability maps were obtained which permitted the subsequent testing of different MCE methods for integrating the selected factors in three GI design alternatives. The Ordered Weighted Average (OWA) method selected for this integration has been applied in many domains within and without the GIS environment, especially the evaluation of land use suitability for planning purposes (Malczewski, 2006; Boroushaki & Malczewski, 2008; Chen et al., 2011), because it can generate a wide range of decision strategies. Our proposal is aimed at providing support for practical planning and decisionmaking, especially in the European and, most particularly, the Spanish context, where there is a need for replicable methodologies that facilitate the application of the GI concept in spatial planning processes. Thus, the usually simplistic proposals typical of Spanish territorial planning, which resort to the schematic representation of potential GI-related territorial elements (e.g., connection axes or biological and ecological connectors, Figure 1) but give them no spatial specification (Rodríguez & Aguilera, 2016), might be superseded..
(6) Figure 1. Main biological connectivity axes. Source: DPTOP-gencat (2007). To test our proposal, we selected a highly dynamic area of urban growth in the metropolitan area of Madrid, Spain (the Henares Corridor). The paper is organised as follows: section 2 describes the study area and starting base datasets which were then used, in sections 3.1 and 3.2, to perform suitability analyses and to map potential areas for inclusion in the GI as a function of the factors considered. Section 4 reports the results of mapping the GI factors considered and their integration using MCE techniques, namely the OWA method, which allows several combination options and, therefore, offers different solutions for the selection of spaces to be incorporated in GI. Finally, in section 5 we discuss the results and present our conclusions..
(7) 2. Study area and base datasets 2.1. Study area The Henares Corridor, situated in the northeast sector of the Urban Region of Madrid, is one of the most dynamic zones in the metropolitan area. Encompassing 35 municipalities, it has a total surface area of more than 120 thousand ha. This important urban-industrial corridor traces the route of major linear infrastructures (the A-2 motorway and the Madrid-Barcelona high-speed railway, among others) and the course of the Henares River. Although it could be considered a single territorial element due to its homogeneous urban and industrial development, it nevertheless belongs to two different (regional) administrative units: the Autonomous Community of Madrid and the Community of Castile-La Mancha (Figure 2).. Figure 2. Location map of the Henares Corridor (Madrid-Guadalajara, Spain). Source: By the authors..
(8) The Henares Corridor began to take shape in the early 20th century when it underwent major territorial transformations due to rapid and intensive industrial and urban expansion from the 1960s onwards. In recent decades, it has witnessed renewed expansion because of the Spanish housing boom (Martori et al., 2016), as well as a productive restructuring process, with the replacement of many old industrial plants by large modern logistics plants distributing various types of first-order consumer goods. It currently has a population of around 750,000 inhabitants (NSI, 2017), more than 80% of whom reside in the municipalities in the axis of the Corridor. [Insert Figure 2] Despite intensive urban development, the Henares Corridor still contains areas with a significant rural component, located on its northern and southern margins. In addition, the area is home to many nature protection areas with different categories and degrees of protection in accordance with European Union regulations: the ‘Cuencas de los ríos Jarama y Henares’ (Community Interest Sites - CIS) and the ‘Estepas Cerealísticas de la Campiña, Cortados y Cantiles de los ríos Jarama y Manzanares’ and the ’Parque Regional del Sureste’ (Special Protection Areas - SPA), which, in spite of its high fragmentation, occupy a surface area close to 20% of the total of the study area. The Henares Corridor thus conforms an interesting laboratory for studying the spatial design of a GI that can offer interesting solutions for more sustainable territorial planning and the efficient and effective management of a complex territory. 2.2. Datasets The datasets used to develop our GI proposal are listed in Table 1. As our proposal uses a raster environment, vector data were rasterised with the same cell size as in the DEM used (25m)..
(9) Table 1. Database content. Source: by the authors. Database. Description. National Land Use and Land Cover Database, 1:25.000 SIOSE 2011 (IGN, 2015). Percentage of [Spanish Land coverage of different land uses Use and Land in each polygon. Categorical Cover maps of land use were derived, Information following a hierarchical model System] similar to Corine Land Cover (EEA, 2007). MDT25. BTN25. National Digital Elevation Model, 25-meter resolution (IGN, 2016b).. National Base Cartography (1:25.000), including boundaries, hydrography, transportation, etc. (IGN, 2016a).. Layer. GI Factors Proximity to Population (PP) Contribution to SE. Land uses categories. % coverage of land uses in each polygon DEM25. Ecological Connectivity (EC) Ecological Status (Est). Proximity to Population (PP). Pedestrian routes network Hydrography Community Interest Sites-CIS Special Protection AreasSPAs Protected Natural Spaces Contribution to SE Historical-culturalartistic heritage Livestock trails Irrigation channels. 3. Methods Our methodology for GI spatial design is based on assessing and mapping the four previously mentioned GI factors, with the aid of spatial analysis tools, GIS, landscape ecology and expert opinion. This proposal consists of two stages: (1) GI factor assessment and mapping; and (2) the integration of GI factor assessment and mapping using multi-criteria evaluation techniques (OWA method) to present different GI proposals for the Henares Corridor. Data processing and analysis were performed using several GIS software packages: TerrSet GIS, for raster suitability analysis of GI factors and their integration.
(10) through MCE techniques; ArcGIS 10.1, for map composition; and Fragstats v4.1 software (McGarigal, 2015), for landscape metrics calculation.. 3.1 Assessing and mapping GI factors The first stage consisted of assessing and mapping the four factors identified above (Figure 3).. Figure 3. General methodological process of the GI proposal. Source: By the authors.. 3.1.1. Mapping land use/ land cover contribution to Ecosystem Services (ES) The first factor considered was the cartography of the contribution of different land use/land cover to the provision of ecosystem services. The approach used to assess this consisted in the evaluation of the contribution of each one to ES supply through expert assessments (Hansen & Pauleit, 2014). The results were transferred to the study area.
(11) with the aid of a land uses map. In line with other participatory techniques such as workshops or focus groups involving different stakeholders in the planning process (Hansen & Pauleit, 2014; Kopperoinen et al., 2014), it was considered that a panel of experts might provide significant information about the contribution of the different land uses to ES, as well as being easier to plan and make operational for the purposes of this proposal. First, from the relationships and listings included in documents such as EC (2010), EEA (2011) or the Technical Information on Green Infrastructure for Europe (EC, 2013b), we selected land use and land cover categories present in the Henares Corridor that were susceptible to potential integration into a GI. Then, from among the multiple ES classifications and ratings available, such as the Economics of Ecosystems and Biodiversity (http://www.teebweb.org/resources/ecosystem-services/) and the Common International Classification of Ecosystem Services (http://cices.eu/) (Liquete et al., 2015), we opted for the European Environmental Agency’s classification (EEA, 2011) to determine the services (only those included in the second level of disaggregation) that should be evaluated by experts. Through a simple questionnaire addressed to twenty experts from different disciplines and areas related to planning and land management (geographers, ecologists and environmentalists), we carried out a semi-quantitative assessment of the contribution of each land use/land cover to the different services, employing a scale from 1 (no contribution) to 4 (maximum contribution). The different expert opinions were clustered via statistical mode to generate an assessment of the potential contribution to each ES and, later, through a simple arithmetic aggregation, to obtain an overall assessment of the contribution of each land use/land cover to the set of ES (Figure 4). Although it is far removed from other complex ES assessment frameworks (Burkhard et al., 2009 and 2012; Maes et al.,.
(12) 2012; Potschin & Haines Young, 2016, e.g.), this option offers a first and simple estimate of the contribution of each land use/land cover to all the ES considered for this semiautomatic GI design.. Figure 4. Sample questionnaire administered to the expert panel. Assessment of the contribution of land use to provision of ES. Source: By the authors.. 3.1.2. Mapping ecological connectivity (EC) The connectivity of a landscape or territory contributes to conserving the natural spaces it contains, increasing their resilience, ensuring and preserving biodiversity, and providing goods and services that meet the needs of the population (Sbara et al., 2007; EC, 2010; EC, 2013a). At the same time, it contributes to the proper functioning, continuity and coherence of the GI as a system (Gurrutxaga et al., 2015), and is an important dimension of the same. However, as it is a difficult concept to operationalise, it has given rise to numerous quantifying and mapping approaches (Pla et al., 2007). Different software packages or specific modules within these have been designed for connectivity analysis (e.g. Guidos, Fragstat and ArcGIS), and several studies have used cost analysis to model functional connectivity (e.g. Adriaensen et al., 2003; Marull & Mallarach, 2005; Theobald et al., 2006; Gonzales & Gergel, 2007;.
(13) Cushman et al., 2008). For our proposal, we used the methodology developed by Marull and Mallarach (2005) to assess landscape connectivity. This is a parametric methodology, solid and sufficiently tired and tested (e.g., Cook et al., 2009; Morgado et al., 2012; Dupras et al., 2016; Marull et al., 2018), and, above all, easily replicable in a GIS environment. The EC index is calculated in three consecutive stages: 1) on the basis of a topological analysis of the land uses, ecologically functional areas are identified, estimating areas of a sufficient size to sustain ecological functions; (2) the impact of barriers is calculated, estimating the impacts on connectivity of infrastructures, urban areas, etc.; and (3) finally, the results are integrated into the ecological connectivity index by applying GIS-based cost-distances analysis.. 3.1.3 Mapping ecological status (ESt) Our proposal tackles the approach to conservation, as another of the dimensions of the GI, by means of the cartography of the status of the land uses that make up the landscape in terms of their composition and configuration (McGarigal, 2015). To assess so-called ESt, we selected three characteristics of the spatial configuration of land uses: (1) the degree of naturalness of the land use/land cover SIOSE2011 map, (2) the size of the patches of these land uses, and (3) the contrast between adjacent land use patches. (1) Naturalness: most of the indexes developed to quantify this concept are based on calculating the proportion of natural cover in relation to the total surface area of the study area (Machado, 2001; Oñate et al., 2014). Because of their ease of use on the basis of available information, our proposal built on such indexes and adopted a naturalness scale on which the maximum score (4) indicated areas with a high extension percentage of natural cover (forest, scrub, wetlands, etc.) and the minimum (1) indicated areas dominated by artificial cover. To do this,.
(14) we used SIOSE2011 data on percentages of land use in each patch to generate naturalness values by patch and identify types of cover present. Overlay operations in GIS were then used to combine all the values obtained for each patch in order to assign each a single naturalness value (for example, the highest or lowest from among those obtained in each of patches) (Figure 5).. Figure 5. Methodological process to generate degrees of naturalness according to percentage of land-use cover. Source: By the authors. (2) Patch size: after rasterization of SIOSE2011 vector layer of land uses, patch size was obtained by assigning to each patch the resulting raster value for its size. (3) Contrast: understood as the magnitude of the difference between the ecological characteristics of one type of land use and those of adjacent ones (McGarigal, 2015), contrast has many ecological implications. One of these is related to the higher degree of isolation of patches surrounded by others that share few.
(15) characteristics (i.e. areas of high contrast), which could be associated with greater pressure or impact and therefore, with lower ecological value. Contrast was estimated using the Edge contrast (ECON_MN) metric on Fragstats software (McGarigal, 2015). However, to calculate this metric and obtain a value for all the pixels in the study area, it was necessary to use a moving window or kernel (Díaz-Varela et al., 2009; Díaz-Varela et al., 2016; Soria-Lara et al., 2016). This process involves calculation using a kernel, which yields a metric value for each pixel according to the land use in the kernel. Determining the most suitable kernel or window size is a key element in this approach (a description of this process is given in Díaz-Varela et al., 2009 and Soria-Lara et al., 2016). This should be the size from which percentage changes in the metric values are less than the percentage changes in window size. Moreover, ECON_MN metrics requires the definition of a contrast matrix for use/cover categories which specifies the degree of contrast between each pair of uses in a range of 0 to 1 (McGarigal, 2015). In this case, we selected a simple approach that established five levels of contrast between uses, starting from zero (0 value of contrast), 0.25 (low value), 0.5 (average value), 0.75 (high value) and 1 (maximum value). For the final ESt index, the three characteristics (naturalness, size and contrast) were normalised by linear function and then combined using MCE techniques, such as Weighted Linear Combination technique (Malczewski, 1999), an equal weighting being assigned to each.. 3.1.4 Mapping proximity to population (PP) Our proposal approaches this factor through accessibility analysis to determine those.
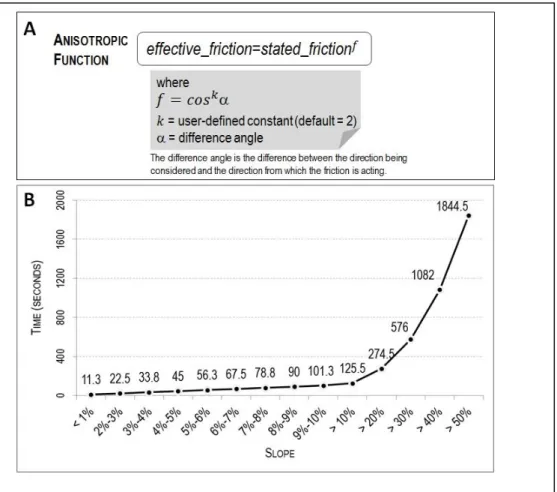
(16) spaces in the territory which are most accessible by the Corridor’s residents and that, therefore, would have greater potential for integration into the GI. This factor satisfies the principles that should guide the planning of such infrastructures in relation to equitable access and the multiple benefits (recreational, aesthetic, promoting social relations, sustainable mobility, enjoyment of nature, etc.) they can offer to the population (Pauleit et al., 2017). To map accessibility, GIS-based cost-distances analyses were again used, in this case displacement costs on foot and via the network of pedestrian routes (e.g. pathways and tracks, collected in BTN25) from all urban centres in the Corridor (identified in SIOSE2011 land uses and coverages layers). More specifically, we estimated anisotropic costs, which consider the friction of the displacement and the direction from which maximum frictional effect occurs, a procedure that is particularly suited to simulating pedestrian transit, among others. As for topographical variations in the study area, we based our calculation on a pedestrian travelling speed of 4km/hour (Wood & Schmidtlein, 2012), which fell as the slope increased; thus, the time taken to travel one pixel increased as the slope value rose, exponentially so from a certain degree of slope requiring extra effort (Figure 6). Lastly, effective friction varied depending on the direction of the slope (uphill or downhill estimated through surface aspect), according to the algorithm included in the VARCOST function of the TerrSet GIS software. The resulting surface friction was used to calculate time (in minutes) to access from the different population centres in the study area. Once this movement along the pedestrian routes had been calculated, those values were allocated to the rest of the territory by considering the distance from these routes in order to obtain one value of accessibility/proximity for the whole study area outside urban centres..
(17) Figure 6. (a) The anisotropic function used by VARCOST-TerrSet and (b) increasing the time to travel 1 pixel depending on the slope. Source: By the authors.. 3.2 Integration of factors using the OWA method The second stage of our proposal consisted of integrating the four mapped GI factors with the aid of MCE, assuming that areas with the highest values for the mapped factors will be the best suited for inclusion in the GI. As recommended for factor integration in MCE, regression analysis was used to check whether there was any correlation between the IG factors considered (Malczewski, 1999). Since they were not correlated, the values for each factor were standardised using monotonically increasing linear functions to values between 0 (minimum) and 255 (maximum) and then integrated using multi-criteria evaluation techniques. Then, we selected the OWA approach, an intermediate method between.
(18) compensatory and non-compensatory MCE techniques (Jiang & Eastman, 2000), which allows different alternatives to be obtained for the combination of weighted factors. This involves using criteria importance weights and a series of additional order weights. Each importance weight is assigned to each criterion map for all locations to indicate the relative importance of the attribute according to the decision maker’s preferences. The order weights are associated with the criterion values on a location-by-location basis, thereby controlling how the now-weighted factors are aggregated (Boroushaki & Malczewski, 2008). Through various combinations of ordered weights, the combination of factors can be located at any point in the decision space between fuzzy intersection (MIN or AND) and union (MAX or OR), with the weighted linear combination located in an intermediate position which amounts to averaging risk decision-making with full trade-off among criteria. This is considered a method to overcome the systematic problems related to risk and trade-off in MCE (Comber et al., 2010). By changing the order weights, one can generate a wide range of outcome decision strategy maps. Hence, using different aggregations of these values, it is possible to obtain different suitability maps of the territory for inclusion in the GI, which indicate situations of higher or lower risk and factor compensation (Malczewski, 1999) depending, for example, on the opinion expressed and agreed upon by a group of experts or, even, the design of different scenarios. In consequence, different alternatives that would enable a GI to be designed which was adapted to different contexts or goals, such as creating the most extensive GI as possible, or conversely, simply identifying core or high priority areas to include in the GI. Below, we describe three alternatives that were designed using different weightings for integration by means of the OWA method, which yields more or less compensation among the four factors considered..
(19) After obtaining the three GI suitability maps (ranging between 0 and 255), a suitability threshold was established to identify areas or pixels with the potential for inclusion in the GI. To do this, we analysed the frequency distribution of suitability values and selected a threshold value in the first quartile of the frequency distribution, restricting inclusion in the GI to the 25% of pixels with the highest values. In the first alternative, the so-called ‘restricted GI’, the OWA method was used to combine the four GI factors by assigning to each pixel the minimum value it obtained for each factor. This means that the factor with the lowest value of the four determined the final suitability of each pixel. Therefore, it amounts to a very restricted infrastructure design which, in so far that it avoids compensation among the values obtained for the four different factors, would be appropriate in cases where the goal was to incorporate priority areas into a GI. The second alternative (extended GI) was also the result of combination using OWA. However, in this case the highest value for any of the GI factors was the one that determined the final suitability of each pixel for inclusion in the infrastructure. This amounts to an extended GI design and would be suitable if the goal was to incorporate the largest amount of space into the GI, even though some of the spaces only presented a high value for one of the four GI dimensions. A halfway house between the first two, the third alternative was the outcome of combining the four factors with an equal weighting, similar to a weighted linear combination. This assumes that low values for one of the factors can be compensated by high values for the others. Thus, in contrast to the other two alternatives, definition of the GI is not marked by extreme values for one of the factors considered.. 4. Results Implementation of the proposed methodology yielded a map of the four factors.
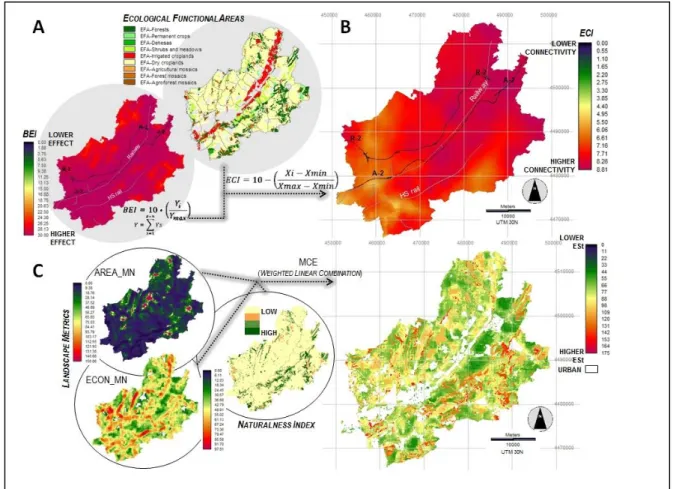
(20) considered in the Henares Corridor’s GI (Figures 7 and 8). Figure 7a shows the results of the ES assessment we carried out. Highest values were obtained in forest areas located along river courses and also in wooded and agroforestry patches on the slopes and steppes on the left bank of the Henares River. Many of these patches are also included within the existing protected areas in the Henares Corridor. Meanwhile, the results of the PP assessment, (Figure 7b) show high values throughout the Henares Corridor. This result is partially explained by the intensive urban development of the territory, especially in the central areas along the main roads, as well as by the existence of a dense, well-distributed network of tracks and paths, together with a predominantly flat topography.. Figure 7. Map of GI in the Henares Corridor (Madrid-Guadalajara, Spain). (a) Expert valuation of global contribution to provision of ES and (b) accessibility of the territory. Source: By the authors. As for EC, Figure 8a shows both the result of identifying ecologically functional areas as well as the effect that barriers (e.g. built-up areas, road infrastructures, etc.) impose on ecological connectivity. The result of the Barrier Effect Index (BEI) indicates that urban-industrial development stretching in a SW-NE direction along the valley of.
(21) the Henares River exerts a marked barrier effect hindering connectivity between the two sides of the corridor, which contain the areas of greatest environmental quality.. Figure 8. Map of GI for the Henares Corridor (Madrid-Guadalajara, Spain). (a) EFAs: Ecological functional areas, BEI: barrier effect index; (b) ECI: ecological connectivity index; and (c) ESt: ecological status associated to land-use cover. Source: By the authors. Lastly, the Ecological Connectivity Index (ECI) (Figure 8b) reveals deficiencies in some sectors of the Henares Corridor. For example, the southwest sector presents low ecological connectivity values, which could affect the function, continuity and cohesion of some of the ecosystems in this area. ESt results (Figure 8c) show some scattered patches with high values, especially on the slope and steppes on the left bank of the Henares River and around other river courses, whereas the rest of the territory presented intermediate ESt values, as was to be.
(22) expected in an area traditionally devoted to farming activities that is now highly urbanised and densely populated in some sectors. The combination of the four factors according to the OWA MCE method allowed us to obtain a map of the elements for inclusion in the GI for each alternative (Figure 9). We also included the nature protection areas in the study area on the assumption that a GI should help to ensure connectivity between these core elements and disseminate their values throughout the entire infrastructure. In first alternative (‘restricted GI’), the results show a small group of scattered spaces to be considered for inclusion in the GI (Figure 9a). These were usually associated with river courses and some were in protected areas (due to other environmental values) or wooded areas located on the slopes between the river plains and the steppes. In contrast, with a higher number of pixels for inclusion in the GI, second alternative (‘extended GI’) presented a more extensive and clustered distribution that incorporated river elements in the Special Protection Area ‘Estepas Cerealísticas de la Campiña’, zones in the northwest sector and wooded areas on the slopes of the moorland (Figure 9b). Meanwhile, the intermediate option (Figure 9c), where all the factors were combined with an equal weighting in a compensatory manner, yielded a more linear GI structure, in this case with elements that were usually associated with river courses (in some cases intermittent) and hillside areas..
(23) Figure 9. Proposed alternatives for the Henares Corridor’s GI. (a) ‘GI-reduced’ alternative; (b) ‘GI-extended’ alternative; and (c) intermediate GI alternative. Source: By the authors..
(24) 5. Discussion and conclusions We have presented a methodological proposal for spatially explicit GI design based on the use of spatial analysis, MCE techniques and landscape ecology. This method yielded three different GI design alternatives for the Henares Corridor (MadridGuadalajara, Spain). Our proposal has a markedly spatial nature and is aimed at providing an accessible, replicable and simple procedure based on tried and tested methods from other disciplines, including ecological connectivity by Marull and Mallarach (2005), analyses of landscape structure using moving-window metrics (DíazVarela et al., 2009) and the use of participatory techniques to assess contributions to ES provision (Kopperoinen et al., 2014). Our method is based on GIS (raster) analysis, which has proven to be a powerful tool enabling dimensions and elements to be integrated and spatialised for consideration in GI design by incorporating diverse sources of information and applying methods and tools from various disciplinary areas. On the other hand, the flexibility of the MCE technique as proposed (OWA) allows different GI design alternatives to be explored. This could favour more informed infrastructure and planning and developing different future scenarios, depending, for example, on the different preferences showed for the stakeholders involved on this planning process. However, our proposal has some possible limitations. First of all, it is based on the assessment of four GI-related factors whereas it might have been possible to incorporate some others (e.g. landscape, economics, etc.) with a view to enhancing the complexity of different dimensions present in the GI concept. However, this would have entailed new difficulties and challenges in the spatial definition of the proposal, as well as the need for new information and the selection of suitable methods for their definition, among others..
(25) Another possible limitation is related to the integration of factors using MCE techniques, a process that entails a degree of subjectivity in aspects such as weighting or establishing threshold values when selecting pixels to define the GI. In this respect, it would be interesting to take advantage of the flexibility offered by MCE to design participatory possible GI scenarios which are adjusted to the territorial and social reality of the area in question, where stakeholders and professionals with expert knowledge and involved in the planning process could help to reduce the subjectivity associated with the integration process. In addition, our proposal is based on the knowledge and use of a range of spatial tools and analysis techniques which, despite their tried and tested applicability and validity in the planning process, remain restricted to academia. This could hinder the transfer of methodologies such as the present proposal to professional practice, thus limiting its applicability. Consequently, as a continuation of our work we aim to explore participatory techniques (e.g. workshops, focus groups and interviews) as a way of testing implementation of the proposal and adapting it in light of the suggestions, needs and requirements the practitioners might have before implementing it in the real planning process (Hewitt et al., 2014; Soria-Lara et al., 2016). Lastly, in relation to the base datasets on land use and occupation, for our case study in Spain we used 1:25,000 scale SIOSE maps (IGN, 2015). These maps provide useful information about percentages of cover per patch and help to assess connectivity or naturalness, among other aspects. However, other analyses (e.g. accessibility, ES assessment) require categorisation and the assignment of predominant land use to each one of the polygons in the original database, and this is a complex procedure. Nonetheless, the analyses conducted in our study could be replicated with other categorical land use databases, for example Corine Land Cover (EEA, 2007) or similar,.
(26) although this would probably require higher spatial resolution to cater for the more detailed scales employed in the planning process. In conclusion, our methodology is an instrument with the capacity to facilitate a more sustainable and balanced planning approach to the design of new urban development in regional and municipal plans. An integrated proposal, at a landscape or strategic non-urban scale, it aims to cover various aspects related to the different GI dimensions (connectivity, ES provision, conservation, etc.) and to overcome the partial view offered by many existing proposals, which exclude some important aspects in the GI definition. Its advantages include: (1) the use of tried and tested methods, such as ecological connectivity, spatial metrics and proximity analyses based on anisotropic costs; (2) the development of a flexible and adaptable approach that can incorporate other factors or dimensions in its calculations and further allows the combination of different options using multi-criteria techniques, thereby facilitating the adjustment of the results to planning needs; (3) a reduced need for base datasets, thus making the methodology easy to use in places where access to information sources may be complex; and (4) the generation of spatial results that include spatially explicit territorial elements for inclusion in the GI, thereby superseding the use of graphic elements (e.g. arrows, diagrams) that are common in representations of the connection or the inclusion of concepts similar to a GI (Rodríguez & Aguilera, 2016) in spatial planning. Acknowledgements: Research for this paper was undertaken as part of Research Project ‘Instruments of Geo-simulation and environmental planning in the territorial planning of metropolitan areas. Application at intermediate scales, SIMURBAN2’ (Ref. CSO2012-38158-C02-01; http://geogra.uah.es/simurban/), financed by the Spanish Ministry of Economy and Competitiveness (Secretary of.
(27) State for Research, Development and Innovation). Website: http://geogra.uah.es/simurban/. References Adriaensen, E., Chardon, F. J. P., De Blust, G., Swinnen, E., Villalba, S., Gilinck, H., & Matthysen, E. (2003). The application of least cost modeling as a functional landscape model. Landscape an Urban Planning, 64 (4), 233-247. doi: http://dx.doi.org/10.1016/S0169-2046(02)00242-6. Ahern, J. (2007). Green infrastructure for cities. The spatial dimension. In V. Novotny (Ed.), Cities of the future. Towards integrated sustainable water and landscape management, 267–283. Retrieved from http://citeseerx.ist.psu.edu/viewdoc/download?doi=10.1.1.558.8386&rep=rep1&type=p df. Amudsen, O., Allen, W., & Hoellen, K. (2009). Green Infrastructure Planning: Recent Advances and Applications. PAS Memo. American Planning Association. Washington, DC, 14 pp. [Adobe Digital Editions version]. Retrieved from http://aii.transportation.org/Documents/EPGT/EPGT-PASMemo_May-June09.pdf. Benedict, M. A., & McMahon, E. T. (2002). Green infrastructure: Smart conservation for the 21st century. Washington, D.C.: Sprawl Watch Clearinghouse Monograph Series. Retrieved from http://www.sprawlwatch.org/greeninfrastructure.pdf. Benedict, M.A., & McMahon, E.T. (2006). Green Infrastructure. Linking Landscapes and Communities. Washington, D.C.: Island Press. Boroushaki, S., & Malczewski, J. (2008). Implementing an extension of the analytical hierarchy process using ordered weighted averaging operators with fuzzy quantifiers in.
(28) ArcGIS. Computers & Geosciences 34, 399-410. doi: http://dx.doi.org/10.1016/j.cageo.2007.04.003. Botequilha-Leitão, A., & Ahern, J. (2002). Applying landscape concepts and metrics in sustainable landscape planning. Landscape Urban Planning, 59 (2), 65-93. doi: http://dx.doi.org/10.1016/S0169-2046(02)00005-1. Burkhard, B., Kroll, F., Müller, F., & Windhorst, W. (2009). Landscapes’ capacities to provide ecosystem services – a concept for land-cover based assessments. Landscape Online 15, 1–22. doi:10.3097/LO.200915. Burkhard, B., Kroll, F., Nedkov, S., & Müller, F. (2012). Mapping ecosystem service supply, demand and budgets. Ecological Indicators 21 (2012), 17–29. doi: https://doi.org/10.1016/j.ecolind.2011.06.019. Chen, J., Zhang, X &, Zhu, Q. (2011). Multi-objective decision making for land use Planning with Ordered Weighted Averaging Method. Systems Engineering Procedia 2, 434-440. doi:10.1016/j.sepro.2011.10.063. Comber, A., Carver, S., Fritz, S., McMorran, R., Washtell, J., & Fisher, P. (2010). Different methods, different wilds: evaluating alternative mappings of wildness using fuzzy MCE and Dempster-Shafer MCE. Computers, Environment and Urban Systems 34, 142-152. doi: http://dx.doi.org/10.1016/j.compenvurbsys.2009.10.006. Cook, B., Puotinen, M. L., & Borah, R. (2009). Ranking habitat patches by contribution to network connectivity: tradeoffs between processing time and spatial realisation. 18th World IMACS / MODSIM Congress (Cairns, Australia 13-17 July 2009), 1922-1928. [Adobe Digital Editions version]. Retrieved from https://www.mssanz.org.au/modsim09/F4/cook_F4.pdf..
(29) Corredor Camargo, E.S., Fonseca Carreño, J.A., & Páez Barón, E.M. (2012). Los servicios ecosistémicos de regulación. Tendencias e impacto en el bienestar humano [Regulatory ecosystem services. Trends and impact on human well-being]. Revista de Investigación Agraria y Ambiental-RIAA, 1 (3), 77-83. Retrieved from https://dialnet.unirioja.es/descarga/articulo/4227147.pdf. Cushman, S. A., McKelvey, K. S., & Schwartz, M. K. (2008). Use of empirically derived source-destination models to map regional conservation corridors. Conservation Biology, 23 (2), 368-376. doi: 10.1111/j.1523-1739.2008.01111.x. Díaz Varela, E., Roces-Díaz, V., & Álvarez-Álvarez, P. (2016). Detection of landscape heterogeneity at multiple scales: use of Quadratic Entropy Index. Landscape and Urban Planning, 153, 149-159. doi: http://dx.doi.org/10.1016/j.landurbplan.2016.05.004. Díaz-Varela, E., Álvarez-López, C., & Marey-Pérez, M. P. (2009). Multiscale delineation of landscape planning units based on spatial variation of land-use patterns in Galicia, NW Spain. Landscape Ecological Engineering, 5 (1), 1-10. doi: 10.1007/s11355-008-0053-4. DPTOP-gencat (2007). Pla territorial parcial de Ponent (Terres de Lleida) [Partial territorial plan of Ponent (Terres de Lleida]. Departament de Politica Territorial i Obres Pùbliques. Generalitat de Catalunya. Retrieved from http://territori.gencat.cat/es/01_departament/05_plans/01_planificacio_territorial/plans_t erritorials_nou/territorials_parcials/ptp_de_ponent_terres_de_lleida/. Dupras, J., Marull, J., Parcerisas, Ll., Coll, F., Gonzalez, A., Girard, M., & Tello, E. (2016). The impacts of urban sprawl on ecological connectivity in the Montreal.
(30) Metropolitan Region. Environmental Science & Policy, 58 (2016), 61-73. doi: https://doi.org/10.1016/j.envsci.2016.01.005. EC (2010). Green Infrastructure, Directorate-General for the Environment. European Commission. [Adobe Digital Editions version]. Retrieved from http://ec.europa.eu/environment/nature/info/pubs/docs/greeninfrastructure.pdf. EC (2013a). Green Infrastructure (GI). Enhancing Europe’s Natural Capital. Communication from the Commission to the European Parliament, the Council, the European Economic and Social Committee and the Committee of the Regions (COM (2013) 249 final), Brussels 6.5.2013, European Commission. [Adobe Digital Editions version]. Retrieved from http://ec.europa.eu/environment/nature/ecosystems/docs/green_infrastructures/1_EN_A CT_part1_v5.pdf. EC (2013b). Technical information on Green Infrastructure for Europe, Commission Staff Working Document SWD (2013) 155 final, Brussels 6.5.2013, European Commission. [Adobe Digital Editions version]. Retrieved from http.//ec.europa.eu/environment/nature/ecosystems/docs/green_infrastructures/1_EN_au tre_document_travail_service_part1_v2.pdf. EEA (2007). CLC2006 technical guidelines (Technical report No 17/2007). European Environment Agency, Publications Office of European Union [Adobe Digital Editions version]. Retrieved from http://www.eea.europa.eu/publications/technical_report_2007_17. EEA (2011). Green infrastructure and territorial cohesion. The concept of green infrastructure and its integration into policies using monitoring systems (Technical.
(31) Report No 18/2011), European Environment Agency, Publications Office of European Union. [Adobe Digital Editions version]. Retrieved from http://www.eea.europa.eu/publications/green-infrastructure-and-territorial-cohesion. doi. 10.2800/88266. Gonzales, E. K., & S. E. Gergel (2007). Testing assumptions of cost surface analysis – a tool for invasive species management. Landscape Ecology, 22 (8), 1155 - 1168. doi: 10.1007/s10980-007-9106-6. Guo, Y., & Liu, Y. (2016). Connecting regional landscapes by ecological networks in the Greater Pearl River Delta. Landscape and Ecological Engineering, 2016, 1-14. doi: 10.1007/s11355-016-0318-2. Gurrutxaga, M., Marull, J., Domene, E., & Urrea, J. (2015). Assessing the Integration of Landscape Connectivity into Comprehensive Spatial Planning in Spain. Landscape Research, 40 (7), 817-833. doi: http.//dx.doi.org/10.1080/01426397.2015.1031096. Hansen, R., & Pauleit, S. (2014). From Mulifunctionality to Multiple Ecosystem Service? A Conceptual Framework for Multifunctionality in Green Infrastructure Planning for Urban Areas. AMBIO. A Journal of the Human Environment, 43 (4), 351529. doi: 10.1007/S13280-014-0510-2. Hewitt, R., van Delden, H., & Escobar, F. (2014). Participatory land use modelling, pathways to an integrated approach. Environmental Modelling & Software, 52, 49-165. doi: http://dx.doi.org/10.1016/j.envsoft.2013.10.019. IGN (2015). Sistema de Información de Ocupación del Suelo en España SIOSE2011: Documento Técnico [Land Use Information System in Spain SIOSE2011: Technical document]. [Adobe Digital Editions version]. Retrieved from.
(32) http.//www.siose.es/SIOSEthemetheme/documentos/pdf/Doc_tec_SIOSE2011_v1.1.pdf. IGN (2016ª). Base Topográfica Nacional 1.25.000 [National Topographic Base 1.25.000]. Retrieved from https.//www.ign.es/ign/layoutIn/actividadesBDGbtn25.do. IGN (2016b). Modelo Digital de Elevaciones MDT25. [Digital Elevation Model DEM25]. Retrieved from https.//www.ign.es/ign/layoutIn/modeloDigitalTerreno.do. Jiang, H., & Eastman, R. (2000). Application of fuzzy measures in multi-criteria evaluation in GIS. International Journal of Geographical Information Science, 14 (2), 173-184. doi: http://dx.doi.org/10.1080/136588100240903. Kang, S., & Kim, J-O. (2015). Morphological analysis of green infrastructure in the Seoul metropolitan area, South Korea. Landscape and Ecological Engineering, 11 (2), 259-268. doi: 10.1007/s11355-014-0268-5. Kopperoinen, L., Itkonen, P., & Niemelä, J. (2014). Using expert knowledge in combining green infrastructure and ecosystem services in land use planning. an insight into a new place-based methodology. Landscape Ecology, 29 (8), 1361-1375. doi: 10.1007/Ss10980-014-0014-2. LUC (2009). Natural England’s Green Infrastructure Guidance. London: Land Use Consultants. Retrieved from http.//publications.naturalengland.org.uk/publication/35033. Liquete, C., Kleeschulte, S., Dige, G., Maes, J., Grizzetti, B., Olah, B., & Zulian, G. (2015). Mapping green infrastructure based on ecosystem services and ecological.
(33) networks. A Pan-European case study. Environmental Science y Policy, 54, 268-280. doi: http.//dx.doi.org/10.1016/j.envsci.2015.07.009. Machado, A. (2004). An index of naturalness. Journal for Nature Conservation 12 (2), 95-110. doi:10.1016/j.jnc.2003.12.002. Maes, J., Egoh, B., Willemen, L., Liquete, C., Vihervaara, P., Schägner, J.P., Grizzetti, B., Drakou, E.G., La Notte, A., Zulian, G., Bouraoui, F., Paracchini, M.L., Braat, L., & Bidoglio, G. (2012). Mapping ecosystem services for policy support and decision making in the European Union. Ecosystem Services 1, 31–39. doi: https://doi.org/10.1016/j.ecoser.2012.06.004. Malczewski, J. (1999). GIS and Multicriteria Decision Analysis. New York: John Wiley & Sons, Inc. Malczewski, J. (2006). Ordered weighted averaging with fuzzy quantifiers: GIS-based multicriteria evaluation for land-use suitability analysis. International Journal of Applied Earth Observation and Geoinformation, 8, 270-277. doi:10.1016/j.jag.2006.01.003. Martori, J.C., Madariaga, R., & Oller, R (2016). Real estate bubble and urban population density: six Spanish metropolitan áreas 2001-2011. The Annals of Regional Science, 56 (2), 369-392. doi:10.1007/s00168-016-0743-z. Marull, J., Cunfer, G., Sylvester, K., & Tello, E. (2018). A landscape ecology assessment of land-use change on the Great Plains-Denver (CO, USA) metropolitan edge. Regional Environmental Change, 2018, 1-18. doi: https://doi.org/10.1007/s10113018-1284-z..
(34) Marull, J., & Mallarach, J.M. (2005). A GIS methodology for assessing ecological connectivity. application to the Barcelona Metropolitan Area. Landscape and Urban Planning 71 (2-4), 243–262. doi: http://dx.doi.org/10.1016/j.landurbplan.2004.03.007. McGarigal. K. (2015). Fragstats help. [Adobe Digital Editions version]. Retrieved from http.//www.umass.edu/landeco/research/fragstats/documents/fragstats.help.4.2.pdf. Morgado, P., Toger, M., Abrantes, P., & Fiegel, J. (2012). A Bottom Up Approach to Modelling Habitat Connectivity Dynamics Through Networks Analysis. In Curkovic, S. (Ed.), Sustainable Development - Authoritative and Leading Edge Content for Environmental Management. [Adobe Digital Editions version]. Retrieved from https://www.intechopen.com/books/sustainable-development-authoritative-and-leadingedge-content-for-environmental-management/a-bottom-up-approach-to-modelinghabitat-connectivity-dynamics-through-networks-analysis. doi: 10.5772/45939. Mwirigi M’Ikiagu, M., QianNa, W., & Kinoshita, I. (2012). Green Infrastructure Gauge: A tool for evaluating green infrastructure inclusion in existing and future urban areas. Procedia. Social and Behavioral Sciencia, 68, 815-825. doi: http://dx.doi.org/10.1016/j.sbspro.2012.12.269. Natural England (2009). Green Growth for Green Communities. A selection of regional case studies. ParkCity Conference 2009. Retrieved from http.//publications.naturalengland.org.uk/. Ndubisi, F. (2003). Ecological Planning. A Historical and Comparative Synthesis. Baltimore: John Hopkins University Press. NSI (2017): Continuous Municipal Register Statistics. Spanish National Statistics Institute. Retrieved from.
(35) http://www.ine.es/jaxi/menu.do?type=pcaxis&path=%2Ft20%2Fe245&file=inebase&L =1. Oñate, J.J., Pereira, D., Acebes, P., & García, E. (2014). Propuesta metodológica para identificación y valoración de Sistemas de Alto Valor Natural: Proyecto SAVN [Methodological proposal for the identification and valuation of High Value Natural Systems: SAVN Project]. Madrid: WWF-España. [Adobe Digital Editions version]. Retrieved from awsassets.wwf.es/downloads/wwf_savn_propuesta_metodologica_def.pdf. Pailet, S., Hansen, R., Rall, E.L., Zölch, T., Andersson, E., Luz, A.C., Szaraz, L., Tosics, I., & Vierikko, K. (2017). Urban Landscapes and Green Infrastructure. Environment and Human Health, Management and Planning. Online Publication. doi: 10.1093/acrefore/9780199389414.013.23. Pla, M., Brotons, L., & Campeny, R. (2007). Obtención de mapas de conectividad funcional de vertebrados para su utilización en planificación territorial. Aplicación en la planificación de espacios libres de la Provincia de Barcelona [Mapping of functional connectivity of vertebrates for use in territorial planning. Application in the planning of free spaces of the Province of Barcelona]. Proceedings SIGTECO 8 Aplicaciones de los Sistemas de información geográfica y la Teledetección en la Ecología. 15-17 de febrero de 2007, Mérida (España). [Adobe Digital Editions version]. Retrieved from http.//www.minuartia.com/data/publicacions/bio/3108091002_0701bioconnectividadsig tecoespminuartia.pdf. Potschin, M., & Haines-Young, R. (2016). Defining and measuring ecosystem services. In Potschin, M., Haines-Young, R. , Fish, R., Turner, R. (Ed.). Routledge Handbook of Ecosystem Services. London: Routledge, 25-44. [Adobe Digital Editions version]..
(36) Retrieved from https://unstats.un.org/unsd/envaccounting/workshops/ES_Classification_2016/Potschin _Haines-Young_2016.pdf. Rodríguez Espinosa, V.M., & Aguilera Benavente, F. (2016). ¿Infraestructuras Verdes en la planificación territorial española? [Green infrastructures in Spanish territorial planning?]. Ciudad y Territorio. Estudios Territoriales-Ministerio de Fomento, 189, 399-418. Sbara, A., Cueto Rúa, V., Moroni, L., Waslet, C., & Murace, P. (2007). El pensamiento proyectual en la escala regional: El verde como infraestructura territorial [Project thinking on the regional scale: Green as territorial infrastructure]. Pampa. Revista Interuniversitaria de Estudios Territoriales, 3, 91-101. [Adobe Digital Editions version]. Retrieved from http.//dialnet.unirioja.es/servlet/articulo?codigo=2756301. Soria-Lara, J.A., Aguilera-Benavente, F., & Arranz-López, A. (2016). Integrating land use and transport practice through spatial metrics. Transport Research, 91 (Part A), 330–345. doi: http://dx.doi.org/10.1016/j.tra.2016.06.023. Theobald, D.M., Norman, J.B., & Sherburne, M.R. (2006). FunConn v1 User‘s Manual. ArcGIS tools for Functional Connectivity Modeling. Natural Resource Ecology Lab, Colorado State University. [Adobe Digital Editions version]. Retrieved from http.//www.stat.colostate.edu/~nsu/starmap/learningmaterials/technicalreports/FunConn .Users.Guide.pdf. TCPA (2012). Planning for a Healthy Environment. Good Practice Guidance for Green Infrastructure and Biodiversity. London: Town and Country Planning Association and The Wildlife Trusts [Adobe Digital Editions version]. Retrieved from.
(37) https://www.tcpa.org.uk/good-practice-guidance-for-green-infrastructure-andbiodiversity. Tzoulas,K., Korpela, K., Venn, S., Yli-Pelkonen, V., Kazmierczak, A., Niemela, J., & James, P. (2007). Promoting ecosystem and human health in urban areas using Green Infrastructure: A literature review. Landscape and Urban Planning, 81 (3), 167-178. doi: http://dx.doi.org/10.1016/j.landurbplan.2007.02.001. Vogt, P. (2016). GuidosToolbox (Graphical User Interface for the Description of image Objects and their Shapes). Retrieved from http://forest.jrc.ec.europa.eu/download/software/guidos. doi: http://dx.doi.org/10.13140/RG.2.1.2633.8320. Wood, N.J., & Schmidtlein, M.C (2012). Anisotropic path modeling to assess pedestrian-evacuation potential from Cascadia-related tsunamis in the US Pacific Northwest. Natural Hazards 62 (2), 275-300. doi: 10.1007/s11069-011-9994-2..
(38)
Figure


+7


Documento similar
In the previous sections we have shown how astronomical alignments and solar hierophanies – with a common interest in the solstices − were substantiated in the
We advance the hypothesis that fraudulent behaviours by finan- cial institutions are associated with substantial physical and mental health problems in the affected populations.
Mapping the spatial distribution of pH, carbonates, organic matter, and clay fractions in soils through geostatistical studies and the use of GIS should facilitate and help
What is perhaps most striking from a historical point of view is the university’s lengthy history as an exclusively male community.. The question of gender obviously has a major role
remained unstudied. Yet, such fundamental knowledge as spatial ecology, behaviour and habitat use are critical for understanding the conservation and management needs of the
If the concept of the first digital divide was particularly linked to access to Internet, and the second digital divide to the operational capacity of the ICT‟s, the
1. S., III, 52, 1-3: Examinadas estas cosas por nosotros, sería apropiado a los lugares antes citados tratar lo contado en la historia sobre las Amazonas que había antiguamente
Firm location, interaction, and local characteristics: A case study for Madrid’s electronics sector*
We model firm location decisions as a spatial point process that depends on local environmental characteristics, such as proximity to local public goods, and on the existence
