Liver stiffness assessed by transient elastography in
patients with
βββββ
thalassaemia major
Giovanna Ferraioli,* Raffaella Lissandrin,* Carmine Tinelli,† Luigia Scudeller,† Federico Bonetti,‡ Mabel Zicchetti,* Filomena Longo,§ Mauro Murgia,|| Stefano Bernuzzi,¶ Marco Zecca,‡ Paolo Casula,|| Antonio Piga,§ Carlo Filice*
* Ultrasound Unit, Infectious Diseases Department, Fondazione IRCCS Policlinico San Matteo, University of Pavia, Italy. † Clinical Epidemiology and Biometric Unit, Fondazione IRCCS Policlinico San Matteo, Pavia, Italy. ‡ Pediatric Haematology Oncology, Fondazione IRCCS Policlinico San Matteo, Pavia, Italy. § Department of Clinical and Biological Sciences, University of Turin, Turin, Italy. || Immuno-ematologia e Medicina Trasfusionale, Ospedale San Martino, Oristano, Italy. ¶ Department of “Medicina Diagnostica e dei Servizi”, Fondazione IRCCS Policlinico San Matteo, Pavia, Italy.
A B S T R A C T A B S T R A C T A B S T R A C T A B S T R A C T A B S T R A C T
Rationale for the study. Rationale for the study.Rationale for the study. Rationale for the study.
Rationale for the study. This cross-sectional multicenter study was conducted to investigate any difference in liver stiffness measurements (LSM), evaluated by transient elastography, between patients affected by β thalassaemia major, with and without he-patitis C virus (HCV) infection, and healthy blood donors (controls). Secondary aim was to assess any correlation between transient elastography and serum ferritin, liver magnetic resonance imaging (MRI) T2* or superconductive quantum interference device (SQUID) liver susceptometry values. Materials and methods.Materials and methods.Materials and methods.Materials and methods.Materials and methods. The study involved three centers. Transient elastography and MRI T2* examinations were performed in all centers. SQUID liver susceptometry was performed in center1 and center2. T-test for independent data or Mann-Whitney U test was used to analyse differences between two groups. Univariate Pearson’s r coefficient was used to test correlations between liver stiffness measurements and all other variables. Results.Results.Results.Results. In a study with 119 patientsResults. and 183 controls, patients who had never been infected with HCV showed significantly higher LSMs than controls [5.7 (95% CI, 5.2-6.2) kPa vs. 4.3 (95% CI, 4.1-4.4) kPa, p < 0.0001]. A moderate correlation between LSMs and ferritin values, adjusted for gender and age, was found in patients (r = 0.49, p < 0.0001) but not in controls (r = -0.22, p = 0.6). No correlation between LSMs and MRI T2* or SQUID liver susceptometry values was observed. In conclusion, compared to controls β thalassaemia major patients had a significant increase in LSMs independently from HCV infection.
Key words. Key words.Key words. Key words.
Key words. Sonoelastography. Magnetic resonance imaging. Superconductive quantum interference device. Liver fibrosis.
May-June, Vol. 15 No. 3, 2016: 410-417
INTRODUCTION
Beta thalassaemia major (TM) is a hereditary anaemia caused by the absence of beta-globin chains that constrains patients to life-long periodical transfusion. Liver iron overload, both due to recurrent transfusion and increased iron gastrointestinal absorption, is a common conse-quence that can lead to the development of liver fibrosis.1
Patients who received blood transfusion before effective virological screening procedures were instituted could also be infected with hepatitis C virus (HCV) and their prognosis is related to the amount of fibrosis due to liver iron concentration and viral infection.1-5
Liver biopsy, which is the gold standard for the evalua-tion of liver fibrosis and hepatic iron overload, is an
inva-sive and painful procedure which has several limitations. Additionally, inhomogeneous distribution of the hepatic iron can lead to under or over-estimation of the degree of iron amount.6,7
Serum ferritin is a parameter easy to obtain and it is widely used to indirectly evaluate the overall iron load. Several studies have assessed its correlation with a poor prognosis in TM patients.4,8,9 However, serum ferritin
val-ues can be influenced also by inflammation.10,11
Because liver iron concentration and total amount of iron in different tissue are critical parameters that deter-mine clinical outcome in patients with TM, non-invasive methods for detecting iron overload –such as T2 star mag-netic resonance imaging (MRI T2*) and superconductive
quantum interference device (SQUID) liver susceptometry–
The Official Journal of the Mexican Association of Hepatology, the Latin-American Association for Study of the Liver and
the Canadian Association for the Study of the Liver
Manuscript received: Manuscript received: Manuscript received: Manuscript received:
Manuscript received: July 27, 2015. Manuscript accepted:Manuscript accepted:Manuscript accepted:Manuscript accepted:Manuscript accepted: September 06, 2015.
have been developed.12-15 The parameters obtained with
MRI T2* and SQUID liver susceptometry are well
ac-cepted surrogate of the liver iron concentration.16-20
The availability of new drugs for treating hepatic iron overload, together with the possibility to noninvasively di-agnose iron overload, has improved the survival of patients with TM. However, the risk of developing liver fibrosis and cirrhosis is also associated with HCV infection and a correct estimate of liver fibrosis is important for accurate patient’s monitoring, prognosis assessment and follow-up. On this regard, several studies have proved that transient elastography (TE) is a reliable method to differentiate se-vere fibrosis from absent or milder degrees of fibrosis.21-26
Recently, it has been shown that TE is a reliable diagnos-tic tool to assess hepadiagnos-tic fibrosis also in TM patients.27-30
Nonetheless, the influence of iron overload on TE values in a large series of TM patients has not been clarified yet.
The main aim of our study was to investigate any dif-ference in liver stiffness measurements –evaluated by tran-sient elastography– between patients affected by β
thalassaemia major, with and without HCV infection, and healthy blood donors. Secondary aim was to assess any correlation between TE, serum ferritin, MRI T2* or liver
iron concentration (LIC) assessed with SQUID suscep-tometry.
MATERIAL AND METHODS
This was a cross-sectional multicentre study. From May 2013 to January 2014, consecutive TM patients in clinical follow-up at paediatric department of Fondazione IRCCS Policlinico San Matteo (centre1), Microcitemie Unit of San Luigi Gonzaga University Hospital (centre2), and Microcitemie Unit of S. Martino Hospital (centre3) were enrolled.
Inclusion criterion was the presence of TM. Exclusion criteria were decompensated liver cirrhosis, pregnancy, and age younger than 10 years because for children under that age it could be difficult to stay still without sedation during the magnetic resonance examination. HCV infec-tion status was assessed by HCV-RNA. One hundred and nineteen patients with TM were enrolled: 32 in centre1, 41 in centre2 and 46 in centre3.
Total iron load was evaluated by means of serum ferri-tin whereas the iron load in the liver was assessed with he-patic MRI T2* and SQUID liver susceptometry.
TE and MRI T2* examinations were performed in all
the three centres. TE examinations were carried out by two experienced operators (RL and MZ) in patients refer-ring to centre1 and centre3, and by one experienced opera-tor (FL) in patients referring to centre2. SQUID liver susceptometry examinations were performed only in pa-tients followed up at centre1 and centre2 by an
experi-enced operator (FL). Serum ferritin, MRI T2* and LIC
values were analysed only when they were obtained with-in six months from non-with-invasive liver stiffness evaluation.
Subject characteristics, epidemiological data, and bio-chemical parameters were recorded.
A ferritin value ≥ 500 ng/mL was considered indicative of iron overload.
The TE results obtained in TM patients were com-pared to that of a control group that was constituted of blood donors regularly followed with laboratory investi-gations, including testing for infection by hepatotropic vi-ruses, at centre1. All blood donors had normal values of aminotransferases and none of them had a history of liver disease or were using medication. The alcohol intake was < 20 g/day for all of them. Liver disease was ruled out by patient’s history, normal laboratory values and findings of normal liver size, smooth liver surface, sharp liver edge and normal parenchymal echo-texture on conventional ul-trasound. The blood donors were part of a series of sub-jects whose data have already been reported in a published study aimed at assessing the reproducibility of the con-trolled attenuation parameter.31
MRI T2*
MRI T2* liver examinations were performed using the
Philips Achieva 1.5 Tesla MR systems (Philips Health-care, the Netherland) in centre1 and centre2, and Siemens Avanto RM 1.5 Tesla system (Siemens Healthcare, Ger-many) in centre3. The procedure was performed accord-ing to previous report.32 Normal values were ≥ 6.3 ms.
SQUID liver susceptometry
SQUID liver susceptometry is able to evaluate the re-sponses of tissue to an applied magnetic field. The values are related to the magnetic properties of the tissue. The response of iron stored in ferritin and hemosiderin depos-its is directly correlated to the iron concentration. The procedure was performed according to Fischer, et al.15
us-ing Model 5700 Tristan Technology, San Diego, Califor-nia. Three measurements for each patient were obtained. Normal LIC values were ≤ 1.2 mg/g dry weight (dw).2,17
Transient elastography
stiffness measurements (LSM)s and interquartile range less than 30% of the median LSM value were included.25 A
cut-off value < 7.0 kilopascal (kPa) was considered indic-ative for not significant fibrosis.24
The study protocol was approved by the institutional Ethics Committee of Fondazione IRCCS Policlinico San Matteo. The study was performed in accordance with the Helsinki Declaration of 1975. CT and LS analysed the data. All authors had access to the data. Participants gave their informed written consent.
Statistical analysis
Descriptive statistics were produced for demographic characteristics for this study sample of patients. The Sha-piro-Wilk test was used to test the normal distribution of quantitative variables. When quantitative variables were normally distributed, the results were expressed as the mean value and standard deviation (SD), otherwise medi-an medi-and interquartile rmedi-ange (IQR; 25th-75th percentile) were reported. T-test for independent data or Mann-Whitney U test was used to analyse differences between two groups, depending on the data distribution; ANOVA analysis (or equivalent non-parametric Kruskal-Wallis test for skewed distribution) was used for more than two groups. Qualitative variables were summarized as counts and percentages and differences were analysed with χ2 test.
Univariate Pearson’s r coefficient was used to test correla-tions between LSMs and all other variables, and a log transformation was performed if they were not normally distributed. Furthermore, as age and gender could be asso-ciated with LSMs,32-34 all correlations were examined with
multivariable linear regression models to adjust for possi-ble confounders due to these two variapossi-bles. P < 0.05 was
considered statistically significant. All tests were two-sided. The data analysis was been performed with the STATA statistical package (release 13.1, 2014, Stata Corporation, College Station, Texas, USA).
RESULTS
Fifty-nine of 119 patients had splenectomy during childhood or young adulthood. All patients were receiv-ing regular blood transfusion to maintain pre-transfusional haemoglobin values at 9-9.5 g/L and were treated with iron chelating therapy as follows: 61/119 (51.3%) with defera-sirox; 12/119 with deferoxamina; 8/119 with deferiprone; 38/119 with combined therapy. The overall adherence to iron chelating therapy was > 90% in 108/119 patients. None patient showed clinical signs of cardiac insufficiency. Fifty-two of 119 TM patients had never been infected with HCV; 41/119 were chronically infected with HCV; 26/119 were anti-HCV positive but not viremic because 17 of them had spontaneously cleared the C virus and nine had successfully been treated and had achieved viral clear-ance. The parameters obtained in the study cohort are re-ported in table 1 and the parameters obtained in TM patients with and without active HCV infection are report-ed in table 2.
LSMs were performed in all the 119 TM patients and the 183 subjects of the control group. No failure or unre-liable measurements were obtained in TM patients whereas 2 failures occurred in the control group. No sta-tistically significant differences were observed between the LSMs obtained in the three centres. A significant fibrosis (LSM ≥ 7.0 kPa) was present in 40/119 TM patients: 23/40 were chronically infected with HCV; 10/40 had never been infected with HCV, 4/40 had spontaneously cleared
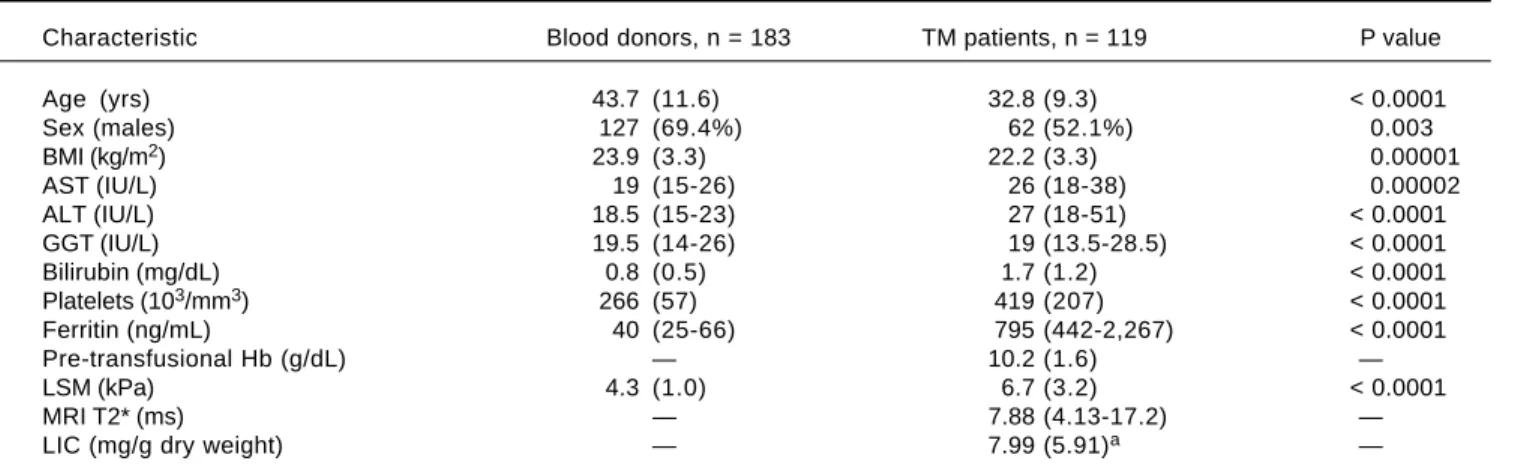
Table 1. Main clinical and demographic characteristics of the study population.
Characteristic Blood donors, n = 183 TM patients, n = 119 P value
Age (yrs) 43.7 (11.6) 32.8 (9.3) < 0.0001
Sex (males) 127 (69.4%) 62 (52.1%) 0.003
BMI (kg/m2) 23.9 (3.3) 22.2 (3.3) 0.00001
AST (IU/L) 19 (15-26) 26 (18-38) 0.00002
ALT (IU/L) 18.5 (15-23) 27 (18-51) < 0.0001
GGT (IU/L) 19.5 (14-26) 19 (13.5-28.5) < 0.0001
Bilirubin (mg/dL) 0.8 (0.5) 1.7 (1.2) < 0.0001
Platelets (103/mm3) 266 (57) 419 (207) < 0.0001
Ferritin (ng/mL) 40 (25-66) 795 (442-2,267) < 0.0001
Pre-transfusional Hb (g/dL) — 10.2 (1.6) —
LSM (kPa) 4.3 (1.0) 6.7 (3.2) < 0.0001
MRI T2* (ms) — 7.88 (4.13-17.2) —
LIC (mg/g dry weight) — 7.99 (5.91)a —
a71 patients. TM: β thalassaemia major. BMI: body mass index. AST: aspartate aminotransferase. ALT: alanine aminotransferase. GGT: gamma glutamyl
the C virus, and 3/40 were sustained responders to antivi-ral treatment.
Serum ferritin values were available for all but one TM patients and for all controls. In one TM patient the serum ferritin value was obtained more than six months before the TE examination, thus it was not included in the statis-tical analysis. Thirty-four of 118 patients had values ≤ 500 ng/mL. No statistically significant difference between the mean serum ferritin values of TM patients with and with-out HCV infection was found [1,239 (IQR: 436- 2,782) ng/ mL vs. 691 (IQR: 442-2,016) ng/mL, p = 0.3]. Patients who had splenectomy presented higher serum ferritin values compared to the other TM patients, but this difference was not statistically significant [725 (IQR, 354-2776) ng/mL vs. 555 (IQR, 398-881) ng/mL, p = 0.2].
Four patients didn’t undergo to MRI T2* examination
because of the young age (n = 1) or the presence of metal plaque (n = 3). Ten cases were excluded from the statisti-cal analysis because the examination was performed more than six months before LSM. Thus, MRI T2* values were
analysed in 105 patients. No statistically significant differ-ence was found between the values obtained in the three centres. Sixty-three (60.0 %) patients had a normal amount of iron in the liver as assessed by MRI T2*. No
statistical-ly significant difference between the values obtained in pa-tients with and without HCV infection was found [7.9 (IQR, 5-18.3) ms vs. 7.7 (IQR, 3.5- 16.0) ms, p = 0.3]. Pa-tients who had splenectomy presented higher MRI T2*
values compared to the other TM patients, but the differ-ence was not statistically significant [8.8 (IQR, 5.2-19.5) ms vs. 7.1 (IQR, 3.3- 14.1) ms, p = 0.6].
SQUID liver susceptometry was performed in all 73 patients of centre1 and centre2. It was unsuccessful in two patients for inability to hold the breath during the
procedure, thus the results obtained in 71 patients were analysed. All but one patient presented LIC values above the normal range. There was not a statistically significant difference between the LIC values obtained in patients of the centre1 and those of centre2. LIC value was slightly higher in patients with HCV infection, but this difference did not reach a statistical significance [8.5 (IQR, 5.5-11.3) mg/gr/dw vs. 5.7 (IQR, 3.8-9.0) mg/gr/dw, p = 0.1]. No statistically significant difference between the LIC values obtained in patients with and without splenectomy was found [6.6 (IQR, 4.4-9.6) mg/gr/dw vs. 6.6 (IQR, 5.1-11.8) mg/gr/dw, p = 0.6].
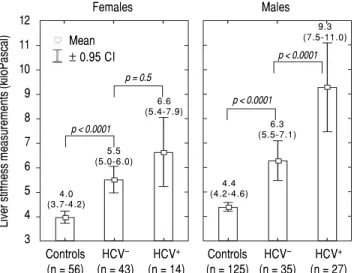
LSM values in TM patients
LSMs obtained in the TM patients with and without HCV infection and in the subjects of the controls group are reported in figure 1. As reported in the literature,32-34 we
also found that females presented lower values of LSM both in the TM patients and the controls; thus, the results were adjusted by gender. All differences were statistically significant (p < 0.0001) except for LSMs differences in TM females with and without HCV infection that showed only a trend toward significance (p = 0.05). Moreover, the 52 TM patients who had never been infected with HCV pre-sented significantly higher LSMs compared to the controls [5.7 (95% CI, 5.2-6.2) kPa vs. 4.3 (95% CI, 4.1-4.4) kPa, p < 0.0001]. With respect to the controls, the mean increase of LSM in TM patients not chronically infected with HCV was 2.4 (95% CI, 1.6-3.3) kPa (p < 0.0001) in males and 1.6 (95% CI, 0.8-2.5) kPa (p < 0.0001) in females. In TM pa-tients with HCV infection the mean increase of LSM was 5.3 (95% CI, 4.4-6.2) kPa (p < 0.0001) in males and 2.7 (95% CI, 1.5-3.8) kPa (p < 0.0001) in females. In the controls the
Table 2. Main demographic and clinical characteristics of the HCV-RNA negative and positive TM patients.
Characteristic HCV-RNA neg, n = 78 HCV-RNA pos, n = 41 P value
Age (yrs) 30.4 (10.1) 37.3 (5.3) 0.002
Sex (males) 35 (44.9%) 27 (65.8%) 0.03
BMI (kg/m2) 22.1 (3.4) 22.4 (3.2) 0.6
Pre-transfusional Hb (g/dL) 10.2 (1.9) 10.2 (0.8) 0.9
AST (IU/L) 21 (17-27) 38 (26-52) < 0.0001
ALT (IU/L) 21.5 (13.5-35.5) 49 (33-95) < 0.0001
GGT (IU/L) 17 (12-23) 24 (16-44) 0.0001
Bilirubin (mg/dL) 1.74 (1.31) 1.68 (0.73) 0.8
Platelets (103/mm3) 398.0 (207.9) 458.4 (201.2) 0.1
Ferritin (ng/mL) 691 (442-2016) 1,239 (436-2,782) 0.3
LSM (kPa) 5.9 (2.1) 8.4 (4.2) < 0.0001
MRI T2* (ms) 7.7 (3.5-16) 7.9 (5-18.3) 0.3
LICa (mg/g dry weight) 5.7 (3.8-9.0) 8.5 (5.5-11.3) 0.1
a LIC was estimated in 71 patients (44 HCV-RNA negative and 27 HCV-RNA positive). TM: β thalassaemia major. BMI: body mass index. AST: aspartate
difference in LSMs between males and females was not sta-tistically significant [0.4 kPa (95% CI, -0.3-1.0; p = 0.2)].
Correlations
In univariate analysis LSM showed a fair correlation with the age, and a high correlation with AST and ALT in the TM patients but not in the controls. LSM showed a strong correlation with GGT in the TM patients and a weak correlation in the controls. A weak correlation with the serum ferritin, which increased after adjustment for age and gender, was found in TM patients (Figure 2). No correlation with all other variables was found in the TM patients or in the controls. The corresponding r val-ues for the correlations between LSMs and the other vari-ables in the TM patients and in the controls are reported in table 3. MRI T2* and LIC values showed a moderate
correlation with serum ferritin (r = -0.47, p < 0.0001 and
r = 0.47, p <0.0001, respectively). A weak correlation between MRI T2* and LIC values was found (r = -0.38,
p = 0.002) whereas a lack of correlation between LSM and MRI T2* or LIC values was observed.
DISCUSSION
The results of this study showed that, compared to the controls, TM patients had a significant increase in liver stiffness independently from the HCV infection. To the best of our knowledge, this is the first study aimed at com-paring the results of LSMs in TM patients to that of a con-trol group. It should be underlined that, compared to the TM patients, the controls were older and had a higher BMI. It has been reported that age does not affect the liver stiffness whereas subjects with a high BMI could have an
increase of LSM.33-35 However, in our series neither age
nor BMI were correlated with LSMs results in the con-trols, whereas a correlation with age but not with BMI was found in TM patients. This relationship could be due to the significant increase in liver stiffness of HCV-infect-ed TM patients, who were also significantly older com-pared to the other TM patients.
In the series of Di Marco, et al.29 the TM patients free
of HCV infection showed a mean LSM of 5.2 kPa. This value is higher than that obtained in healthy volunteers.33,34 Figure 1.
Figure 1. Figure 1. Figure 1.
Figure 1. Liver stiffness measurements in the controls and in the patients with β thalassaemia major. The results are shown by gender.
Figure 2. Figure 2.Figure 2.
Figure 2.Figure 2. Correlation between liver stiffness measurements and serum fe-rritin in the patients with β thalassaemia major and in the controls.
Liver stiffness measurements (kiloPascal)
Table 3. Correlations between liver stiffness measurements and other variables in the TM patients and in the controls.
Variable TM patients Controls
Age r = 0.21 r = 0.05
p = 0.02 p = 0.5
Body mass index r = 0.08 r = 0.14 p = 0.4 p = 0.06
AST r = 0.57 r = 0.12
p < 0.0001 p = 0.1
ALT r = 0.45 r = 0.13
p < 0.0001 p = 0.09
GGT r = 0.62 r = 0.32
p < 0.0001 p < 0.0001
Ferritin r = 0.33 (0.49)a r = -0.04 (-0.22)a
p < 0.0001 p = 0.6
MRI T2* r = -0.07 —
p = 0.4 —
LIC r = -0.04 —
p = 0.7 —
a Gender and age adjusted. TM: β thalassaemia major. AST: aspartate
aminotransferase. ALT: alanine aminotransferase. GGT: gamma glutamyl transpeptidase. MRI T2*: magnetic resonance imaging T2 star. LIC: liver iron concentration.
28 26 24 22 20 18 16 14 12 10 8 6 4 2 0
4 5 6 7 8 9 10
Serum Log ferritin HCV–: r = 0.35; p = 0.002
HCV+: r = 0.26; p = 0.1
Liver stiffness measurements (kiloPascal)
12
11
10
9
8
7
6
5
4
3
Females Males
Mean ± 0.95 CI
Controls HCV– HCV+
(n = 56) (n = 43) (n = 14)
Controls HCV– HCV+
(n = 125) (n = 35) (n = 27)
HCV–
HCV+
4.0 (3.7-4.2)
5.5 (5.0-6.0)
6.6 (5.4-7.9)
p = 0.5
p < 0.0001
4.4 (4.2-4.6)
6.3 (5.5-7.1)
9.3 (7.5-11.0)
p < 0.0001
As observed in our series, a significant difference in LSMs between TM patients infected with HCV and those free of infection was observed.
In our series, serum ferritin was correlated with LSMs, MRI T2* and LIC values. A positive correlation of LSMs
with serum ferritin has also been found in other stud-ies.27,36 LSMs did not show any correlation with the values
obtained with MRI T2* or SQUID liver susceptometry,
techniques that have been shown to be accurate in the as-sessment of iron overload. This finding is similar to that of Fraquelli, et al.27 who did not find any correlation
be-tween TE and MRI T2* in a series of 115 patients with β
thalassaemia major or intermedia. Likewise, in the study of Di Marco, et al.29 liver stiffness increased proportionally
to liver fibrosis staging independently from liver iron con-centration. Also in the series of Poustchi, et al.30 the
in-crease in LSMs in patients with thalassaemia and HCV infection was independent of MRI T2* values. The only
study with different results is that of Sinakos, et al.37 who
found a correlation of LSM with MRI T2* values in a
co-hort of 49 TM patients without HCV infection.
We believe that the lack of correlation between MRI T2* or LIC values and LSMs could mean that the storage of
iron in the liver does not directly influence the stiffness, whereas the increase in liver stiffness could be explained by the effects of iron on the liver cells. Indeed, it has been shown that iron determines multiple cellular lesions and pathological changes that may lead to liver fibrosis.5,38,39 The
increase in liver stiffness occurred despite the fact that in our cohort the overall adherence to iron chelating therapy was > 90% in 108/119 patients and the MRI T2* values
were within the normal range in 60% of cases.
As expected, the TM patients with HCV infection showed higher LSMs compared to the TM patients free of infection and they were older. Due to repeated blood transfusion, TM patients were at high risk of HCV infec-tion before blood screening for the virus was available. In our series, none patient born after 1983 was infected with HCV. TM patients with HCV infection showed higher values of serum ferritin, even though the difference with TM HCV-negative patients was not statistically signifi-cant. This finding is in accordance with literature data that have shown an increase of serum ferritin in chronic viral hepatitis.40 In our series 40 (33.6%) patients showed LSMs
≥ 7 kPa, which is a cut-off value for significant fibrosis in patients with chronic hepatitis C.24 It is of note that, in our
cohort, 25% of TM patients with significant fibrosis had never been infected with HCV and another 10% had spon-taneously cleared the C virus. Thus, the increase in LSMs in these patients is related to factors other than viral infec-tion. On the other hand, we may have underestimate the liver fibrosis because the threshold for the detection of significant fibrosis in TM patients could be different
de-pending to different HCV status. In fact, in the series of Mirault, et al.,28 that comprised patients without detectable
HCV-RNA, a cut-off value of 6.25 kPa was able to predict severe fibrosis.
Our study has limitations. First, we did not compare the results of non-invasive assessment of liver fibrosis or hepatic iron overload to that of liver biopsy. Nonetheless, the accuracy of TE in the assessment of liver fibrosis in TM patients as well as that of MRI T2* or SQUID liver
susceptometry in quantifying hepatic iron overload have been assessed in previous studies. Furthermore, the value of TE in discriminating different stages of liver fibrosis in TM patients was not the aim of our study. Second, SQUID liver susceptometry was not performed in all pa-tients. It should be noted that the SQUID liver suscep-tometry is a technique available only in few centres around the world.
CONCLUSION
In conclusion, the liver stiffness is increased in TM pa-tients free of HCV infection. Follow up studies will clarify whether the increase in liver stiffness in TM patients -for whom iron overload is the only risk factor -for liver fi-brosis - is stable over time.
ABBREVIATIONS
• dw: dry weight. • HCV: hepatitis C virus. • IQR: interquartile range. • kPa: kiloPascal.
• LIC: liver iron concentration. • LSM: liver stiffness measurement.
• MRI T2*: T2 star magnetic resonance imaging.
• SD: standard deviation.
• SQUID: superconductive quantum interference de-vice.
• TE: transient elastography. • TM: beta thalassaemia major.
FUNDING
There was no funding for this research.
ACKNOWLEDGMENTS
Malfitano, MD; Giuseppe Michelone, MD; Lorenzo Mi-noli, MD; Mario U. Mondelli, MD; Stefano Novati, MD; Savino F.A. Patruno, MD; Gianluigi Poma, MD; Paolo Sacchi, MD; Domenico Zanaboni, MD.
The authors would also like to thank Ms. Nadia Loc-atelli, the secretary of the Ultrasound Unit, for her valua-ble help in complying with the study protocol.
REFERENCES
1. Prati D, Maggioni M, Milani S, Cerino M, Cianciulli P, Coggi G, Forni GL, et al. Clinical and histological characterization of liver disease in patients with transfusion-dependent beta-thalassemia. A multicenter study of 117 cases. Haematolog-ica 2004; 89: 1179-86.
2. Olivieri NF, Brittenham GM. Iron-chelating therapy and the treatment of thalassemia. Blood 1997; 89: 739-61.
3. Cunningham MJ, Macklin EA, Neufeld EJ, Cohen AR; Tha-lassemia Clinical Research Network. Complications of beta-thalassemia major in North America. Blood 2004; 104: 34-9. 4. Telfer PT, Prestcott E, Holden S, Walker M, Hoffbrand AV,
Wonke B. Hepatic iron concentration combined with long-term monitoring of serum ferritin to predict complications of iron overload in thalassaemia major. Br J Haematol 2000; 110: 971-7.
5. Angelucci E, Muretto P, Nicolucci A, Baronciani D, Erer B, Gaziev J, Ripalti M, et al. Effects of iron overload and hepati-tis C virus positivity in determining progression of liver fibro-sis in thalassemia following bone marrow transplantation. Blood 2002; 100: 17-21.
6. Emond MJ, Bronner MP, Carlson TH, Lin M, Labbe RF, Kowd-ley KV. Quantitative study of the variability of hepatic iron concentrations. Clin Chem 1999; 45: 340-6.
7. St Pierre TG, Clark PR, Chua-anusorn W, Fleming AJ, Jeffrey GP, Olynyk JK, Pootrakul P, et al. Noninvasive measurement and imaging of liver iron concentrations using proton mag-netic resonance. Blood 2005; 105: 855-61.
8. Olivieri NF, Nathan DG, MacMillan JH, Wayne AS, Liu PP, Mc-Gee A, Martin M, et al. Survival in medically treated patients with homozygous beta-thalassemia. N Eng J Med 1994; 331: 574-8.
9. Borgna-Pignatti C, Rugolotto S, De Stefano P, Zhao H, Cap-pellini MD, Del Vecchio GC, Romeo MA, et al. Survival and complications in patients with thalassemia major treated with transfusion and deferoxamine. Haematologica 2004; 89: 1187-93.
10. Hearnshaw S, Thompson NP, McGill A. The epidemiology of hyperferritinaemia. World J Gastroenterol 2006; 12: 5866-9. 11. Lambrecht RW, Sterling RK, Naishadham D, Stoddard AM, Rogers T, Morishima C, Morgan TR, et al. Iron levels in hepa-tocytes and portal tract cells predict progression and out-come of patients with advanced chronic hepatitis C. Gastroenterology 2011; 140: 1490-500.
12. Anderson LJ, Holden S, Davis B, Prescott E, Charrier CC, Bunce NH, Firmin DN, et al. Cardiovascular T2-star (T2*) magnetic resonance for the early diagnosis of myocardial iron overload. Eur Heart J 2001; 22: 2171-9.
13. Wood JC, Enriquez C, Ghugre N, Tyzka JM, Carson S, Nelson MD, Coates TD. MRI R2 and R2* mapping accurately esti-mates hepatic iron concentration in transfusion-dependent thalassemia and sickle-cells disease patients. Blood 2005; 106: 1460-5.
14. Brittenham GM, Farrell DE, Harris JW, Feldman ES, Danish EH, Muir WA, Tripp JH, et al. Magnetic-susceptibility
meas-urement of human iron stores. N Eng J Med 1982; 307: 1671-5.
15. Fischer R, Tiemann CD, Engelhardt R, Nielsen P, Dürken M, Gabbe EE, Janka GE. Assessment of iron stores in children with transfusion siderosis by biomagnetic liver susceptome-try. Am J Hematol 1999; 60: 289-99.
16. Fischer R, Longo F, Nielsen P, Engelhardt R, Hider RC, Piga A. Monitoring long-term efficacy of iron chelation therapy by deferiprone and desferrioxamine in patients with beta-thalassaemia major: application of SQUID biomagnetic liver susceptometry. Br J Haematol 2003; 121: 938-48.
17. Fischer R, Harmatz PR. Non-invasive assessment of tissue iron overload. Hematology. Am Soc Hematol Educ Program 2009; 215-21.
18. Nielsen P, Engelhardt R, Duerken M, Janka GE, Fischer R. Using SQUID biomagnetic liver susceptometry in the treat-ment of thalassemia and other iron loading diseases. Trans-fus Sci 2000; 23: 257-8.
19. Fung EB, Fischer R, Pakbaz Z, Fagaly RL, Vichinsky E, Starr TN, Ewing T, et al. The new SQUID biosusceptometer at Oak-land: first year of experience. Neurol Clin Neurophysiol 2004; 2004: 5.
20. Busca A, Falda M, Manzini P, D’Antico S, Valfrè A, Loc-atelli F, Calabrese R, et al. Iron overload in patients receiv-ing allogeneic hematopoietic stem cell transplantation: quantification of iron burden by a superconducting quan-tum interference device (SQUID) and therapeutic effec-tiveness of phlebotomy. Biol Blood Marrow Transplant 2010; 16: 115-22.
21. Sandrin L, Fourquet B, Hasquenoph JM, Yon S, Fournier C, Mal F, Christidis C, et al. Transient elastography: a new non-invasive method for assessment of hepatic fibrosis. Ultra-sound Med Biol 2003; 29: 1705-13.
22. Ziol M, Handra-Luca A, Kettaneh A, Christidis C, Mal F, Ka-zemi F, de Lédinghen V, et al. Noninvasive assessment of liver fibrosis by measurement of stiffness in patients with chronic hepatitis C. Hepatology 2005; 41: 48-54.
23. Castéra L, Vergniol J, Foucher J, Le Bail B, Chanteloup E, Haaser M, Darriet M, et al. Prospective comparison of tran-sient elastography, Fibrotest, APRI, and liver biopsy for the assessment of fibrosis in chronic hepatitis C. Gastroenter-ology 2005; 128: 343-50.
24. Tsochatzis EA, Gurusamy KS, Ntaoula S, Cholongitas E, Davidson BR, Burroughs AK. Elastography for the diagnosis of severity of fibrosis in chronic liver disease: a meta-anal-ysis of diagnostic accuracy. J Hepatol 2011; 54: 650-9. 25. Castera L, Forns X, Alberti A. Non-invasive evaluation of
liv-er fibrosis using transient elastography. J Hepatol 2008; 48: 835-47.
26. Berzigotti A, Castera L. Update on ultrasound imaging of liv-er fibrosis. J Hepatol 2013; 59: 180-2.
27. Fraquelli M, Cassinerio E, Roghi A, Rigamonti C, Casazza G, Colombo M, Massironi S, et al. Transient elastography in the assessment of liver fibrosis in adult thalassemia patients. Am J Hematol 2010; 85: 564-8.
28. Mirault T, Lucidarme D, Turlin B, Vandevenne P, Gosset P, Ernst O, Rose C. Non-invasive assessment of liver fibrosis by transient elastography in post transfusional iron overload. Eur J Haematol 2008; 80: 337-40.
29. Di Marco V, Bronte F, Cabibi D, Calvaruso V, Alaimo G, Borsellino Z, Gagliardotto F, et al. Noninvasive assessment of liver fibrosis in thalassaemia major patients by transient elastography (TE) - lack of interference by iron deposition. Br J Haematol 2010; 148: 476-9.
elastogra-phy in hepatitis C virus-infected patients with beta-tha-lassemia for assessment of fibrosis. Hepatol Res 2013; 43: 1276-83.
31. Ferraioli G, Tinelli C, Lissandrin R, Zicchetti M, Rondanelli M, Perani G, Bernuzzi S, et al. Interobserver reproducibility of the controlled attenuation parameter (CAP) for quantifying liv-er steatosis. Hepatol Int 2014; 8: 576-81.
32. Di Tucci AA, Matta G, Deplano S, Gabbas A, Depau C, Deru-das D, Caocci G, et al. Myocardial iron overload assessment by T2* magnetic resonance imaging in adult transfusion de-pendent patients with acquired anemias. Haematologica 2008; 93: 1385-8.
33. Sirli R, Sporea I, Tudora A, Deleanu A, Popescu A. Transient elastographic evaluation of subjects without known hepatic pathology: does age change the liver stiffness? J Gastroin-testin Liver Dis 2009; 18: 57-60.
34. Corpechot C, El Naggar A, Poupon R. Gender and liver: is the liver stiffness weaker in weaker sex? Hepatology 2006; 44: 513-4.
35. Roulot D, Czernichow S, Le Clésiau H, Costes JL, Vergnaud AC, Beaugrand M. Liver stiffness values in apparently healthy subjects: influence of gender and metabolic syn-drome. J Hepatol 2008; 48: 606-13.
36. Musallam KM, Motta I, Salvatori M, Fraquelli M, Marcon A, Taher AT, Cappellini MD. Longitudinal changes in serum ferri-tin levels correlate with measures of hepatic stiffness in
transfusion-independent patients with β-thalassemia inter-media. Blood Cells Mol Dis 2012; 49: 136-9.
37. Sinakos E, Perifanis V, Vlachaki E, Tsatra I, Raptopoulou-Gigi M. Is liver stiffness really unrelated to liver iron concen-tration? Br J Haematol 2010; 150: 247-28.
38. Fanni D, Fanos V, Gerosa C, Piras M, Dessi A, Atzei A, Van EP, et al. Effects of iron and copper overload on the human liver: an ultrastructural study. Curr Med Chem 2014; 21: 3768-74.
39. Jensen PD, Jensen FT, Christensen T, Nielsen JL, Ellegaard J. Relationship between hepatocellular injury and transfu-sional iron overload prior to and during iron chelation with desferrioxamine: a study in adult patients with acquired anemias. Blood 2003; 101: 91-6.
40. Bonkovsky HL, Banner B F, Rothman AL. Iron and chronic viral hepatitis. Hepatology 1997; 25: 759-68.
Correspondence a reprint request:
Giovanna Ferraioli, M.D.
Ultrasound Unit, Infectious Diseases Department, Fondazione IRCCS Policlinico San Matteo, University of Pavia,
Via Taramelli 5, 27100 Pavia, Italy. Tel.: +39 0382 502887. Fax: +39 0382 501505