Introduction
Coarse woody debris (CWD) is one of the most important functional and structural components of forest ecosystems (Harmon et al. 1986, McComn & Lindenmayer 1999). CWD affects nutrient cycling, carbon storage and hydrological processes. It also serves as an essential substrate for a multitude of spe-cies, including numerous rare and endan-gered species (von Oheimb et al. 2007).
Numerous studies have examined the role of CWD in maintaining biodiversity (Esseen et al. 1997, Angelstam 1998), estimating the
decomposition rates of many important tree species (Yatskov et al. 2003), evaluating the effect of CWD in carbon and nutrient cycles (Krankina et al. 1999, Hyvonenn et al. 2000, Merganicôvá & Merganic 2010) and analy-zing the quantity, structure and dynamics of CWD in managed and unmanaged forests (Green & Peterken 1997, Linder et al. 1997, Siitonen et al. 2000, Lombardi et al. 2008). In unmanaged forests, the amount of CWD is the result of tree mortality and dead wood decay rates, both of which are affected by climate, site productivity, tree species
com-position, disturbance regime, previous forest stand characteristics and the successional stage of the forest (Harmon et al. 1986, Spies et al. 1988). In managed forests, CWD quantities are typically kept very low, to avoid pest problems and fire hazards and to maximize the commercial value of the har-vest. Where economics and accessibility al-low, trees affected by insects, diseases, and fire are usually removed immediately, before they die or deteriorate (DeBell et al. 1997, Green & Peterken 1997). Plantation forests are typically managed on short rotations and are generally subject to intensive harvesting methods, resulting in structurally homoge-nous stands without significant amounts of CWD (Harmon et al. 1986, deMaynadier & Hunter 1995). However, silvicultural activi-ties such as thinning, pruning and harvesting can create woody debris (Carlyle 1995). The increasing importance of biodiversity and carbon storage favors the maintenance and promotion of CWD in managed forests. Lea-ving some live and dead trees during logging operations, or even killing trees to create CWD, are some of the operational means for meeting biodiversity needs in managed fo-rests (Esseen et al. 1997).
The amount and distribution of CWD can be a criterion for assessing and determining baseline silvicultural practices. This type of data is available for different types of forests, but the geographic extent and focus of most studies is limited to one or a few specific stands. There is very little information on continental or global CWD quantities and distribution patterns or on how management affects these patterns. Comparison of diffe-rent forest ecosystems makes it possible to examine the effects of site productivity and stand structure on CWD amounts and de-composition rates. It also improves under-standing of how different management prac-tices affect CWD as a resource, which is vi-tal to formulating guidelines and strategies for increasing carbon storage on forest lands.
In light of this information gap, the aim of this paper was to quantify the amount, qua-lity and distribution of CWD in four pine ecosystems in NW Spain, NW Russia and NW USA: three diverse geographical loca-tions with different species and histories of human activity and disturbance. In NW Spain, we find relatively young, actively managed and moderately productive planta-tions. Even-age silvicultural management is typically used on public lands in this region and consists of clearcutting followed by na-tural regeneration, pre-commercial thinning and a low thinning regime when economi-cally feasible. Previous research has indica-ted that thinning increased CWD abundance in this area (Herrero et al. 2010). Forestry in NW Russia is characterized by an establi-shed, relatively long rotation system with (1) Sustainable Forest Management Research Institute, Uva-INIA, University of
Valladolid, Avda. Madrid 44, C.P. 34071 Palencia (Spain); (2) Department of Forest Science, Oregon State University, 321 Richardson Hall, 97331 Corvallis, Oregon (USA); (3) USDA Forest Service, Pacific Northwest Research Station, 3200 Jefferson Way, 97331 Corvallis, Oregon (USA)
@
@
Celia Herrero de Aza (chdeaza@pvs.uva.es) Received: May 21, 2012 - Accepted: Jul 28, 2013Citation: Herrero C, Krankina O, Monleon VJ, Bravo F, 2014. Amount and distribution of coarse woody debris in pine ecosystems of north-western Spain, Russia and the United States. iForest 7: 53-60 [online 2013-10-28] URL: http://www.sisef.it/iforest/contents/? id=ifor0644-006
Communicated by: Renzo Motta
Amount and distribution of coarse woody
debris in pine ecosystems of north-western
Spain, Russia and the United States
Celia Herrero
(1), Olga Krankina
(2), Vicente J Monleon
(3), Felipe Bravo
(1)The quantity and characteristics of coarse woody debris (CWD) were examined in four distinct pine ecosystems of north-western (NW) Spain, NW Russia and the NW USA. The average CWD volume and biomass ranged from 3.76 m3 ha-1,
1.55 Mg ha-1 in pine plantations in NW Spain to 24.86 m3 ha-1, 6.69 Mg ha-1
in Scots pine forest in NW Russia to 55.35 m3 ha-1, 20.38 Mg ha-1 and 77.04 m3
ha-1, 28.84 Mg ha-1 in ponderosa and lodgepole pine forests in the NW USA.
Des-pite differences in species, ecological conditions and management histories, in all four ecosystems the mean snag volume was less than that of logs, most of the CWD mass was in an intermediate degree of decay, and mature stands had the greatest amount of CWD mass, followed by middle-age and then young stands. The CWD ratio (ratio of dead to live wood volume) ranged from 2.8% to 126.6%, depending on pine ecosystem and stand age, and was influenced by the type of natural and human disturbance. The difference in CWD amount and distribution among the regions studied reflected differences in disturbance his-tory and management practices. Only in NW USA was the sample size large enough to examine the effect of disturbance type on CWD amount and distribu-tion. There, fire and insect damage were found to considerably influence the amount of CWD in both lodgepole and ponderosa pine forests. Comparison of how different factors affect the amount and distribution of CWD in different ecosystems could be useful in developing ecologically sustainable forest mana-gement guidelines.
few natural stands remaining. Disturbances are frequent and windthrow fairly wide-spread (Krankina & Harmon 1995). Clear-cutting followed by natural regeneration has been the dominant silvicultural system in this region. However, the current trend is to-ward more site-specific approaches that fa-vor partial cutting or cutting and regenera-tion, with methods that recognize forest pe-culiarities and environmental conditions. Fi-nally, NW USA features a relatively recent initial expansion of timber harvesting in pre-viously unmanaged forests where natural disturbance regimes continue to play a major role, in addition to forests that have never been managed. The current landscape is a mixture of different conditions including managed stands, protected areas, and second growth forests that originated after extensive harvesting in the 1920’s. Of particular im-portance has been the suppression of the na-tural, low-severity fire regime that favored fire-tolerant species and kept tree density low (Hessburg et al. 2005). Current forests are affected by natural disturbances such as fire or damage from insect plagues and di-seases. The three regions are representative of typical land-use histories throughout the world, which are assumed to influence CWD stores.
This study was structured around the fol-lowing specific objectives: (1) to quantify the amount of CWD in the different pine ecosystems; (2) to study CWD distribution among decay classes and stand ages; and (3) to determine the impact of natural and hu-man disturbances on CWD in NW USA pine ecosystems.
Material and methods
Study areas
The first study region was located in NW Spain (42° N, 4° W) at an altitude of 800-1000 m a.s.l. It is a transitional area between forest and cropland, with low mountains and valleys. The Mediterranean climate features long, cold winters and warm, dry summers. January temperatures range between -2 °C and 6 °C, July temperatures between 9 °C and 21 °C, and mean annual rainfall is 633 mm. Soils are mainly acidic, with some neu-tral soil and limestone areas (Oria de Rueda et al. 1996). Forest covers 61 570 ha (33.0%) of the total area. Thanks to an ex-tensive plantation program that started in the 1970s, pine stands cover 41.5% of the total forested area. The three main species are Scots pine (Pinus sylvestris L. - 43.6%), black pine (Pinus nigra Arn. - 43.9%) and maritime pine (Pinus pinaster Ait. - 12.5%). Plantations are typically a mixture of these three species, with homogeneous 30 to 60 year-old stands managed for wood produc-tion.
The second study area was situated on the
East-European plain in the St. Petersburg re-gion of NW Russia (58-61° N, 29-34° E), at an elevation range of 0-250 m a.s.l. The cool maritime climate features wet summers and long, cold winters. July mean temperatures are 16 - 17 °C, January minimum tempera-tures range from -7 to -11 °C and mean an-nual precipitation is 700 mm. The flat terrain rests on ancient sea sediment covered by a layer of moraine deposits. Soils are mostly podzols on deep loamy to sandy sediment. Forest covers 55% of this 8.1 million ha area. The natural vegetation and dominant conifer species consist mainly of southern taiga, Scots pine (Pinus sylvestris L.) and Norway spruce (Picea abies Karst.), growing in pure and mixed stands. Forest manage-ment in this region began in the 18th century. Most forests are second-growth and harve-sted on a 60-120 year rotation.
The third region was located in NW USA, specifically eastern and central Oregon (42-46° N, 117-123° W), and includes the east-ern Cascades Range, the pumice plateau of south-central Oregon, and the Blue Moun-tains. Elevation of the forested areas ranges between 900 and 2000 m a.s.l. The climate is characterized by low summer rainfall, cold winters and a short growing season. Average January minimum temperatures range between -7 and -11 °C, average July maxi-mum temperatures are 27 to 31 °C. The 350 to 700 mm of average annual precipitation falls mostly in the form of snow. Soils range from relatively young, poorly developed, mineral deficient and highly porous volcanic types to more developed basaltic types (Franklin & Dyrness 1973). Forests in the study area were dominated by ponderosa pine (Pinus ponderosa Dougl. ex Laws) and lodgepole pine (Pinus contorta Dougl. ex Loud), which covered 2.1 and 0.8 million ha, respectively (Donnegan et al. 2008).
Sampling design
NW Spain
In NW Spain, sixty-seven plots were selec-ted in Pinus spp. plantations on a systematic grid with a density of one plot per 2 km2. Pine plantations were grouped in two stand development stages: young (≤ 40 years old) and middle-age (40-80 years old). A total of 36 plots (11 young and 25 middle-age) were located in stands that had been thinned (Tab. 1). Plots were composed of four circular subplots (15 m radius) joined by two perpen-dicular transects 50 m long.
Snags in the four subplots, stumps in two of the four subplots, and logs on the tran-sects were inventoried. Snags were defined as standing dead trees with a diameter at breast height greater than 7.5 cm. Species, height, diameter at breast height (dbh), decay class, presence of excavated cavities, azi-muth and distance to plot center were
recor-ded for each snag. The number, mean dia-meter and height of stumps in each plot were measured and recorded. Finally, line inter-sect sampling (LIS - Warren & Olsen 1964) was used to estimate the log volume. Logs were defined as dead trees with a diameter greater than 7.5 cm, either on the ground or suspended by one extreme at an inclination greater than 45° from vertical. Species, dia-meter at the transect intersection point, length, inclination, decay class and wildlife use were recorded for each log (Forsee Pro-ject 2005). All pieces of woody debris were assigned to one of five decay classes ranging from nearly sound wood to the most advan-ced stages of decomposition, according to criteria described by Goodburn & Lorimer (1998).
NW Russia
Fifty Scots pine plots were studied in NW Russia (Tab. 1), distributed among 7 diffe-rent stands, ranging in age from 15 to 150 years. Of these, 38% of the plots were loc-ated in young stands (≤ 40 years old), 36% in middle-age stands (40-80) and the remai-ning 26% in mature stands (>80 years old). Eight plots (7 middle-age, 1 mature) had been thinned. The plots were also classified according to whether disturbance (wind-throw) was apparent or not. Only 3 plots, all in mature stands, showed signs of distur-bance.
CWD (snags, logs and stumps) was mea-sured in fixed-area plots ranging in size from 0.2 to 1.0 ha. Within each plot, the large- and small-end diameters, length, species and decay class were recorded for each log >10 cm in diameter and >1m in length. Stumps and snags were measured regardless of their height. Measurements varied by CWD type and condition, and were designed to charac-terize the volume of each piece. A detailed description of field methods can be found in Harmon & Sexton (1996). The same five-class system for categorizing decay was used as in the NW Spain survey.
NW USA
per point, resulting in a total transect length of 143.60 m per plot. Large- and small-end diameters, diameter at the point of intersec-tion with the transect, species, decay class and length were recorded for each log. The decay class of each CWD piece was rated ac-cording to a five-class decay scale similar to that used in NW Spain and NW Russia. When distinct forest conditions were found within a plot, such as changes in ownership or forest type, they were mapped and de-scribed. Individual snags and logs were as-signed to the condition where they fell. A host of other relevant variables were collec-ted for each condition, including ownership, stand age, disturbance and management his-tory. As in the other regions, plots were clas-sified as young (≤ 40 years old), middle-age (40-80) or mature stands (> 80 years old). More detailed information about the field methods and sampling procedures can be found in USDA Forest Service (2007).
Stand age in the ponderosa pine forest type ranged from 1 to 350 years old. Most plots were located in middle-age (43.6%) or ma-ture stands (44.5%). The plots were divided into two types: plots without apparent dis-turbance (n=228) and plots with distur-bances in the previous 10 years. A variety of disturbance types were observed: 99 plots had a history of fire (prescribed or natural, crown or ground fire), 75 plots presented in-sect or disease damage and 64 plots showed signs of different types of harvesting. The disturbance types were not mutually exclu-sive; any plot could have incurred two or more types of disturbance.
Stand age in the lodgepole pine forest type ranged from 3 to 200 years old. As with pon-derosa pine forests, plots were classified as young (≤ 40 years old), middle-age (40-80) or mature stands (> 80 years old) and were divided into plots without disturbances (n=86) and plots with disturbances. Thirty-four plots presented fire disturbances (pre-scribed or natural crown or ground fire), 48 plots had insect or disease damage and 22 plots showed signs of different types of har-vesting. The frequency of disturbed plots varied according to the age category of the stand (Tab. 1).
Calculation of volume and mass
In NW Spain, snag volume (m3) was calcu-lated using equations from the Spanish Na-tional Forest Inventory (DGCN 1996). The volume of each stump was calculated using Huber’s formula (Harmon & Sexton 1996). Snag and stump volumes (m3) were then ex-panded to the hectare. Log volume (m3 ha-1) was estimated using the following equation (Warren & Olsen 1964, Van Wagner 1968 - eqn. 1):
where Vi is the estimated log volume in the i -th plot (m3 ha-1); d
ij the intersection diameter of the j-th log in the i-th plot (cm); and L transect length, in our case 100 m.
In NW Russia, volume estimates were cal-culated from field measurements of each piece of CWD using local volume tables for intact snags and appropriate volume formu-las (Newton, paraboloid, frustrum of a cone or neiloid) for other CWD conditions and types. The individual volumes were summed for each plot and plot values scaled up to ob-tain a value per hectare.
In NW USA, snag volume was computed using a standard set of US Forest Inventory volume equations based on diameter and height. Mean estimates of the total volume and volume per hectare were computed ac-cording to the methods of Bechtold & Scott (2005). Log volume and mass estimates were computed using the same procedures as in NW Spain (Woodall & Monleon 2008).
In the three regions, the CWD volume was aggregated by decay class. To estimate CWD mass, the estimated volume was multiplied by the wood bulk density. In NW Russia and NW USA, published bulk density values by species and decay class were used (Yatskov et al. 2003, Harmon et al. 2008). In Spain, bulk density was estimated by collecting 33 logs of different decay classes in the field. Large diameter, end diameter, midpoint dia-meter and length were measured to calculate the volume using Newton’s equation (Har-mon & Sexton 1996 - eqn. 2):
where Vi is the volume of the log, L is the length, and Ab, Am and At were the cross-sec-tional areas at the base, middle and top of the log, respectively. Dry weights of logs were determined after drying at 75 °C to constant weight. The estimated mean bulk densities (in Mg m-3 ± standard error) were
0.441 ± 0.075, 0.351 ± 0.079, 0.281 ± 0.101, 0.199 ± 0.042 and 0.044 ± 0.013 for decay classes 1 through 5, respectively.
Though standard and consistent sampling designs were applied in the three regions, there were slight differences with regard to the CWD components tallied and piece defi-nitions. Snags, logs and stumps were mea-sured in NW Spain and NW Russia, but only snags and logs were measured in NW USA. Additionally, the minimum size threshold used for piece definitions varied: the mini-mum diameter was 7.5 cm in NW Spain and NW USA and 10 cm in NW Russia. In order to assess the impact of this difference, the volume of CWD with diameters between 7.5 and 10 cm was calculated for NW Spain and NW USA.
For each sample plot, volume and mass of total CWD were calculated as the sum of the volume and mass of the different compo-nents (snags, logs and stumps). Averages were computed by pine ecosystem and stand age class. Only in NW USA was the sample size large enough to compute the average amount of CWD by natural (fire, insect da-mage) or anthropogenic (harvesting) distur-bance regime. Finally, live tree volume was calculated to compute the CWD ratio (ratio of dead to live wood volume) in each plot. The CWD ratio was also calculated by age class in the three regions and by disturbance types in NW USA pine ecosystems.
Statistical methods
For each pine ecosystem, descriptive and graphical analyses of the estimated mean CWD volume and mass by components (snags, logs and stumps), decay class, age class and disturbance type were examined. To determine statistically significant diffe-rences in volume and mass of CWD, logs, snags and stumps, a linear mixed model (LMM) was used for the following factors and their interactions: pine ecosystem with
Tab. 1 - Main characteristics of the pine ecosystems included in the study. Plots with evi-dence of natural disturbance are plots affected by natural disturbances such as fire, insect and disease damage or windthrow.
Species Age Class Years
Stand volume (m3 ha-1)
Total
plots Thinnedplots
Plots with evidence of
natural disturbance
Pinus spp.
(NW Spain ) YoungMiddle-age 0-40>40 103.14102.49 2542 1125 00 Pinus sylvestris
(NW Russia)
Young 0-40 63.06 13 0 0
Middle-age 40-80 187.84 32 7 0
Mature >80 415.3 5 1 3
Pinus ponderosa
(NW USA) YoungMiddle-age 40-80 0-40 124.9653.2 18751 1033 2272
Mature >80 199.18 191 21 80
Pinus contorta
(NW USA) YoungMiddle-age 40-80 0-40 129.2244.02 6562 107 3031
Mature >80 182.31 44 5 21
Vi=
π2
∑
dij2
8L
Vi=
four levels: 1 (pine plantations in NW Spain), 2 (Scots pine in NW Russia), 3 (pon-derosa pine in NW USA), and 4 (lodgepole pine in NW USA); age class with three le-vels: 1 (young stands), 2 (middle-age stands) and 3 (mature stands). Only two pine ecosys-tem levels (NW Spain and NW Russia) were used for the analysis of stump volume and mass. The LMM allowed us to correct the heteroscedasticity of variance caused by the pine ecosystem factor. Differences among age classes in each pine ecosystem were evaluated by individual contrasts. The SAS 9.1 PROC MIXED statistical program was
used for the analyses (SAS Institute Inc 2010).
Results
There were significant differences (p<0.0001) in the volume and biomass of logs and snags among pine ecosystems, age classes and the interaction between the two factors. The stump pool showed significant differences among age classes in pine eco-systems of NW Spain and NW Russia (p<0.0002).
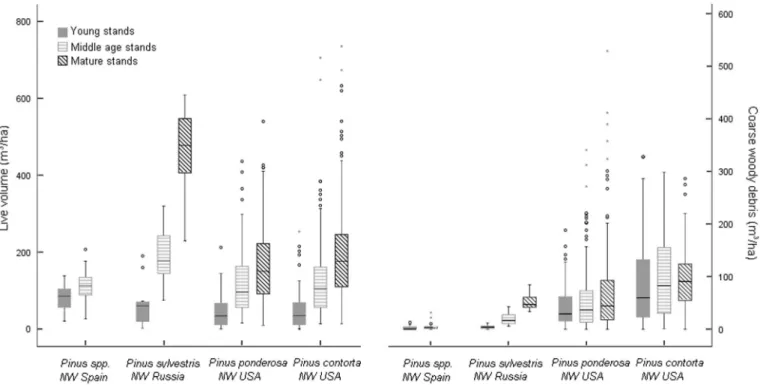
The amount of CWD varied greatly between pine ecosystems (Fig. 1). The CWD
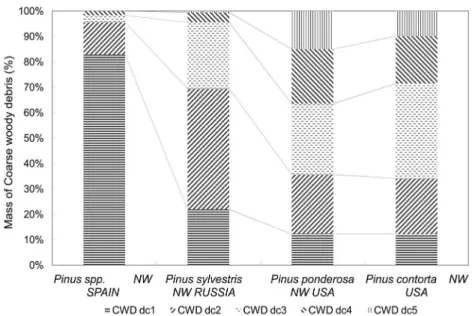
averages in plots without recorded distur-bances ranged from 3.76 m3 ha-1 (1.55 Mg ha-1) in pine plantations in NW Spain to 77.04 m3 ha-1 (28.84 Mg ha-1) in lodgepole pine in NW USA (Tab. 2). Between these two extremes, 24.86 m3 ha-1 (6.69 Mg ha-1) was estimated for Scots pine in NW Russia and 55.35 m3 ha-1 (20.38 Mg ha-1) for pon-derosa pine in NW USA. CWD distribution by decay class also varied among pine eco-systems (p<0.0001 - Fig. 2). In the NW Spain plantations, decay class 1 material was the most abundant due to recent thinning, and mass in decay classes 3-5 was the
scar-Fig. 1 - Live and CWD volume by pine ecosystem and age class. Distribution of live and coarse woody debris volume by pine ecosystem and age class.
Tab. 2 CWD volume and mass for logs, snags and stumps by age class and pine ecosystem. Letters indicate statistically significant diffe -rences among age classes (p<0.05) within each pine ecosystem evaluated with individual contrasts. CWD ratio is the ratio of dead to live wood volume.
Species AgeClass
Log Snag Stump Total CWD Live
volume (m3 ha-1)
CWD ratio
(%) Volume
(m3 ha-1)
Mass (Mg ha-1)
Volume (m3 ha-1)
Mass (Mg ha-1)
Volume (m3 ha-1)
Mass (Mg ha-1)
Volume (m3 ha-1)
Mass (Mg ha-1)
Pinus spp. (NW Spain)
All 1.28 0.49 1.04 0.43 1.44 0.63 3.76 1.55 102.73 3.66
Young 0.68 a 0.29 a 0.83 a 0.34 a 1.12 a 0.49 a 2.64 a 1.12 a 103.14 a 2.56 a Middle-age 1.64 a 0.61 a 1.17 a 0.48 a 1.62 a 0.71 a 4.43 a 1.62 a 102.49 b 4.32 a
Pinus sylvestris
(NW Russia) YoungAll 15.161.31 a 3.700.25 a 1.788.41 a 2.770.51 a 0.841.29 a 0.220.15 a 24.863.94 a 0.916.69 a 248.3163.06 a 10.016.25 a Middle-age 11.30 b 2.90 b 7.05 b 2.31 b 0.87 a 0.15 a 19.22 b 5.36 b 187.84 b 10.23 a Mature 32.04 c 7.71 c 15.88 c 5.29 c 2.20 a 0.37 a 50.13 c 13.38 c 460.18 c 10.89 a
Pinus ponderosa
(NW USA) YoungAll 45.2939.33 a 15.0717.46 a 10.062.33 a 0.522.91 a -- -- 55.3541.66 a 20.3815.59 a 141.2462.59 a 39.1966.56 a Middle-age 42.57 a 16.49 a 5.68 a 1.38 a - - 48.24 a 17.87 a 116.45 b 41.43 b Mature 49.98 a 19.22 a 17.07 b 5.27 b - - 67.04 b 24.49 b 191.03 c 35.09 b
Pinus contorta
cest. In NW Russia, CWD mass for Scots pine was greatest in decay classes 1, 2 and 3. Ponderosa and lodgepole pine ecosystems in NW USA showed a relatively homogeneous CWD mass distribution across decay classes.
For all regions, log volume was higher than snag volume, especially in NW USA, where log volume was 1.8 times greater than that of snags in both forest types (Tab. 2). Examina-tion by decay class showed the same pattern.
The interaction between pine ecosystem and age class was also statistically signifi-cant, indicating that CWD and component distribution by age class differed among pine ecosystems. Most individual contrasts sho-wed a statistically significant higher amount of CWD in older stands. In general, the greatest amount of total CWD was found in mature stands, followed by middle-age and then young stands (Tab. 2). In NW USA however, although the total amount of live volume was greatest in the oldest age classes (Fig. 1), the CWD ratio was greatest in young stands (Tab. 2). This suggests a lega-cy effect from past disturbances. For several decay classes of the NW USA forest ecosys-tems there was more CWD in middle-age stands than in mature stands (Tab. 3). Large amounts of CWD were found in recently dis-turbed ponderosa pine areas, mainly due to
insect and disease damage and harvesting (Fig. 3). Young stands had the highest log volume (97.05 m3 ha-1). The CWD ratio in lodgepole pine stands with evidence of fire disturbance was very large in all age classes,
but more so in young stands.
The role of disturbance was difficult to compare across regions because the sample size for disturbed plots was insufficient in all regions except NW USA. However, results
Fig. 2 - Mass by decay class. Percentage CWD mass by decay class in the different pine eco-systems. CWD dci is the mass of CWD in decay class i.
Tab. 3 - Log and snag mass in the different decay classes by age class and pine ecosystem. dc1 to dc5 are the decay class level ranges from 1 = nearly sound wood with bark intact to 5 = the most advanced stages of decomposition.
Species Age Class Log mass (Mg ha
-1) Snag mass (Mg ha-1)
dc1 dc2 dc3 dc4 dc5 dc1 dc2 dc3 dc4 dc5
Pinus spp. (NW Spain)
Young 0.24 0.05 0 0 0 0.24 0.1 0 0 0
Middle-age 0.39 0.12 0.06 0.04 0 0.37 0.1 0.01 0 0
Pinus sylvestris
(NW Russia) YoungMiddle-age 00.04 0.010.98 0.191.85 0.030.04 00.01 0.930.17 1.220.29 0.160 00.05 00
Mature 0.72 4.08 2.32 0.54 0.07 2.45 2.7 0.14 0 0
Pinus ponderosa
(NW USA) YoungMiddle-age 0.240.48 1.463.67 5.174.96 4.454.35 2.943.85 0.590.25 0.40.2 0.090.05 0.260.02 0.010.03
Mature 2.07 4.77 5.7 3.95 2.72 2.60 1.64 0.78 0.06 0.18
Pinus contorta (NW USA)
Young 0.87 5.35 10.05 3.08 1.34 1.37 0.08 0.05 0 0
Middle-age 1.92 6.14 8.79 6.8 3.76 2.97 0.55 0.12 0.02 0
Mature 0.91 5.3 13.96 7.23 4.15 3.04 1.9 0.29 0.09 0
Fig. 3 - CWD ratio and volume by age class in NW USA ecosystems. Estimated ratios of CWD to live tree volume (grey bars) and CWD
from the 3 plots affected by windthrow in NW Russia showed an average log, snag and stump volume of 162.72 m3 ha-1, 26.25 and 2.62 m3 ha-1, respectively. In these plots, log volume after windthrow disturbance accoun-ted for more than 80% of total CWD (Fig. 4).
Finally, we estimated the volume of woody debris with diameters between 7.5 and 10 cm in NW Spain and NW USA in order to as-certain the importance of the smallest CWD pieces with respect to total volume. This class constituted 1.9% and 3.4% of total CWD in the ponderosa and lodgepole pine ecosystems of NW USA, respectively, and 6% of total CWD volume in Spain.
Discussion
In this study, we quantified and compared amounts of coarse woody debris (snags, logs and stumps) in four different pine ecosys-tems from three different geographical re-gions with distinct site conditions, forest his-tories and legacies, in order to understand the spatial and temporal distribution of dead wood under different forest management re-gimes.
The amount of dead wood varied greatly among the different pine ecosystems, but the distribution of CWD among decay classes and stand age are consistent with other stu-dies of CWD stores. In northern Europe, Siitonen et al. (2000) found 14 m3 ha-1 of CWD in mature stands (dominant spruces <120 years old) and 22 m3 ha-1 in over-ma-ture stands (>120 years old) in southern Fin-land. Stand history, successional stage and exogenous disturbances in individual stands were the explanatory factors for CWD varia-tion. In the USA, Spetich et al. (1999) found 30 m3 ha-1 CWD in mid-western second-growth forests. In the Pacific Northwest, Spies et al. (1988) reported higher values for Douglas fir: 423 m3 ha-1 mean CWD volume for young stands (age 65), 250 m3 ha-1 for mature forests (age 121), and 534 m3 ha-1 for old-growth forests (age 404). Results from the present study for the average CWD mass of Pinus contorta (28.84 Mg ha-1) fell within the range identified by Tinker & Knight (2000) for undisturbed Pinus contorta stands in Wyoming. Finally, our results are in
agreement with those of several studies of managed Mediterranean forests. Relatively low CWD estimates of less than 25 m3 ha-1 have been reported in France (Vallauri et al. 2003), Turkey (Atici et al. 2008) and Italy (Motta et al. 2006, Lombardi et al. 2008). Higher values were observed in unmanaged forest or older stands (Marage & Lemperiere 2005, Lombardi et al. 2010).
The distribution of CWD by decay class is important, because decay influences wood density and consequent carbon and nutrient content. Though Linder et al. (1997) obser-ved large amounts of CWD in decay classes 4 and 5 in stands dominated by Scots pine in northern Sweden, our results are more in line with those of other studies in which the greatest amount of CWD was found in the intermediate decay classes (Harmon et al. 1986, Spetich et al. 1999, Lombardi et al 2008).
The results of this study indicate that logs are more abundant than snags, a finding that corroborates other studies (Krankina et al. 2002). In considering the benefits for nature conservation, Butler & Schlaepfer (2004) suggested that snags should account for at least 50% of CWD volume in managed fo-rests, because they provide a critical habitat for many species of cavity-nesting birds (Da-vis 1983, Harmon et al. 1986, Jakoby et al. 2010). The relatively lower proportion of snags found in all regions studied may re-flect the transitory nature of this component. The number of snags can increase tempora-rily after a period of increased tree mortality, but they eventually fall over and become downed logs. To promote biodiversity, the proportion, size and longevity of snags should be taken into consideration in develo-ping forest management guidelines (Jakoby et al. 2010).
A review of north American forest struc-ture literastruc-ture suggests a “U-shaped” distri-bution of CWD volume, mass, and density as a function of stand age. In other words, CWD is greatest after disturbance in very young stands, decreases in developing stands and increases slightly in mature stands, as tree mortality increases (Harmon et al. 1986, Spies et al. 1988). Our results only support those findings in Scots pine ecosystems in
NW Russia, where log volume in mature stands was more than double that of middle-age stands, and log volume in young stands was more than eight times greater. This pat-tern was less apparent in the other three pine ecosystems, where different mechanisms (partial disturbance, prior management his-tory) affected CWD distribution during stand development. In NW USA, the legacy of dis-turbance in the 10 years prior to the study determined CWD distribution across age classes. In ponderosa pine, the large amount of CWD could be related to the combination of drought and bark beetle plague in the early 1990s (Laudenslayer 2005). Though fire is historically the most common morta-lity agent in ponderosa pine forests, its sup-pression also resulted in greater accumula-tion of dead wood (Hessburg et al. 2005). Fire disturbance in lodgepole pine systems led to high CWD levels and a high ratio of dead to live wood volume in young stands. Tinker & Knight (2000) showed that burned stands contained more than twice the amount of CWD than clear cut stands, largely due to the removal of live trees in harvested stands and the presence of snags in burned stands. The results of the present study also indica-ted that the proportion of logs vs. snags in stands with fire disturbances varied across the age classes. While the volume of logs (84.58 m3 ha-1) and snags (56.91 m3 ha-1) was similar in young stands, logs dominated the total CWD volume (120.61 m3 ha-1) vs. snag volume (20.44 m3 ha-1) in middle-age stands.
Despite the small sample size, results from the NW Russia pine ecosystem showed that windthrow disturbance can create a high volume of CWD in a stand. Finally, harve-sting can produce drastic changes in CWD quantity and quality. Tree removal decreases the CWD input and harvesting can affect wood pools indirectly through the fragmen-tation of decaying ground wood caused by machinery (Ranius et al. 2003). In NW Spain, thinning could have a significant ef-fect on CWD amounts in young stands, where higher log and stump volumes were found in thinned stands, and where logging waste such as crown debris or pruning residues is commonly left on the ground.
Comparing CWD estimates from different studies requires caution due to variations in field measurement methods, plot selection, the area of the region studied and calculation procedures among studies (Fridman & Wal-heim 2000, Grove 2001). One limitation of this study is that the sampling methods, designs and minimum piece sizes in the three regions were not exactly the same, though they all are standard procedures for sampling CWD in different parts of the world. While a common method for sampling CWD would be ideal, researchers argue that no unique method can be adopted for all forest types due to differences in forest structure,
resea-Fig. 4 - Log volume in disturbed and
un-disturbed stands in NW Russia.
rch objectives and resources (e.g., Wolden-dorp et al. 2004). There is also disagreement regarding the definition of the different CWD components. For example, Woodall et al. (2009) surveyed the methods used in the National Forest Inventories of 30 countries that sample CWD. They found that “the definitions of down woody (DW) variables varied among countries that inventory DW. Common minimum diameters at breast height for standing dead trees were 5, 7, 10, and 12 cm.” They reported that 33% of the countries used a minimum diameter of 7.0 to 7.6 cm and 27% used 10 cm. They also noted that the 7.5 cm threshold is very close to 3 inches, the cut-off measurement used to differentiate between fine and heavy fuels in fire behavior models. In this study, NW Spain and NW USA used a minimum dia-meter threshold of approximately 7.5 cm, while NW Russia used 10 cm. Therefore, we would expect the estimated CWD volume in NW Russia to be somewhat less than if a 7.5 cm threshold had been used. However, the number of small pieces and their contribu-tion to total volume and biomass resulted in a very small difference that does not signifi-cantly alter the results and conclusions of this study.
The study shows that stand histories affect amounts of CWD, legacy wood and distribu-tion relative to live volume. Forest manage-ment and response after natural disturbance or harvesting activities have a great influ-ence on CWD quantity and quality in a fo-rest ecosystem. After disturbances, logging residues and snags may be removed to avoid the outbreak of bark beetle and other insect populations that could damage living trees. After commercial thinning, harvested trees are also removed because the available tech-nology and demand for wood has resulted in greater utilization of smaller and poorer quality trees. Reduction of CWD can reduce forest health risks, but can also contribute to a decline in biological diversity and nutrient cycling. The characterization of CWD amounts and distribution can inform forest management decisions by improving under-standing of how diverse conditions, beyond those that might be encountered in a single location, can affect CWD dynamics. The ma-ture stands without disturbances in NW USA allowed us to examine deadwood accumula-tion in a context similar to primary forest or forest with stand development stages ap-proaching naturalness. In contrast, CWD was scarce in the short-rotation, managed fo-rest sites of NW USA and NW Spain, where natural stage development was interrupted early on (Duvall & Grigal 1999, Vandeker-khove et al. 2009).
Managers need to know how much CWD to leave or create in a stand. Here, we have examined deadwood accumulation in stands ranging from short rotation managed forest
to those approaching levels of naturalness. The results can inform guidelines for pre-scribing adequate levels of CWD in terms of density, size, and amount in different decom-position classes, as well as for attaining op-timal response after disturbances. The rele-vance of such information cannot be under-stated in the current context of forest mana-gement linked to intensive silviculture. The significant role of dead wood in carbon pooling linked to biodiversity is becoming clearer and competes with a growing interest in harvesting logging residues for energy production.
Conclusions
Four pine ecosystems were compared in three regions with different site conditions, forest histories and legacies. The results of this paper show that the quantity of dead wood varies greatly according to pine eco-system and stand age class. The large diffe-rences in CWD stores and successional pat-terns appear to correspond to variations in natural conditions, management practices, legacy and disturbance history in the regions studied. Coarse woody debris ranged from 3.76 m3 ha-1 (1.55 Mg ha-1) for Pinus spp. NW Spain to 24.86 m3 ha-1 (6.69 Mg ha-1) for Pinus sylvestris in NW Russia to 55.35 m3 ha-1 (20.38 Mg ha-1) for Pinus ponderosa and 77.04 m3 ha-1 (28.04 Mg ha-1) for Pinus
contorta, both in NW USA.
The common assumption of a “U-shaped” CWD accumulation pattern was not suppor-ted in NW USA forest ecosystems. Fire and insect damage disturbances affected CWD amounts in all age classes in both Pinus con-torta and Pinus ponderosa forests. Dead to live wood volume ratios were found to be closely related to natural and human pertur-bations.
Acknowledgments
We want to express our gratitude to Becky Fasth, Mark Harmon, Mikhail Yatkov, Susan Morré and Valentín Pando for providing help with data support, analysis and the Eng-lish language. This work was made possible through the INTERREG III B FORSEE pro-ject financed by the European Union and through the University of Valladolid grant program. The authors thank Andrea Blanch for her helpful English review and the ano-nymous referees for their valuable comments on the manuscript.
References
Angelstam PK (1998). Maintaining and restoring biodiversity in European boreal forests by devel-oping natural disturbance regimes. Journal of Vegetation Science 9: 593-602. - doi: 10.2307/ 3237275
Atici E, Colak AH, Rotherham ID (2008). Coarse dead wood volume of managed oriental Beech (Fagus orientalis Lipsky) stands in Turkey.
Forest systems 17 (3): 216-227. [online] URL:
http://www.inia.es/gcontrec/pub/216-227_ Coarse_Dead_1229946186781.pdf
Bechtold WA, Scott CT (2005). The forest inven-tory and analysis plot design. In: “The enhanced forest inventory and analysis program” (Bechtold WA, Patterson PL eds). Gen. Tech. Rep. SRS-GTR-80, USDA Forest Service, Asheville, NC, USA, pp. 27-42.
Butler R, Schlaepfer R (2004). Dead wood in managed forests: how much is enough? Sch-weizerische Zeitschrift für Forstwesen 155 (2): 31-37. - doi: 10.3188/szf.2004.0031
Carlyle JC (1995). Nutrient management in a
Pinus radiata plantation after thinning: the effect of thinning and residues on nutrient distribution, mineral nitrogen fluxes, and extractable phos-phorus. Canadian Journal of Forest Research 25: 1278-1291. - doi: 10.1139/x95-141
Davis JW (1983). Snags are for wildlife. In: “Pro-ceedings of the symposium on snag habitat man-agement” (Davis JW, Goodwin GA, Ockenfels RA eds). Gen. Tech. Rep. RM-99, USDA Forest Service, Flagstaff, Arizona, USA, pp. 4-9. Duvall MD, Grigal DF (1999). Effects of timber
harvesting on coarse woody debris in red pine forests across the Great Lakes states, USA. Ca-nadian Journal of Forest Research 29 (12): 1926-1934. - doi: 10.1139/x99-158
DeBell DS, Curtis RC, Harrington CA, Tappeiner JC (1997). Shaping stand development through silvicultural practices. In: “Creating forestry for the 21st century (Kohm LA, Franklin JF eds). The
science of ecosystem management. Island Press, Washington, DC, USA, pp. 141-151.
deMaynadier PG, Hunter MLJr (1995). The rela-tionship between forest management and amphi-bian ecology: a review of the North American li-terature. Environmental Research 3: 230-261. DGCN (1996). Segundo inventario forestal
nacio-nal completo: 1986-1996. Parques Nacionacio-nales, Madrid, Spain. [in Spanish]
Donnegan J, Campbell S, Azuma D (2008). Ore-gon’s forest resources, 2001-2005. Gen. Tech. Rep. PNW-GTR-765, USDA Forest Service, Portland, Oregon,USA, pp. 186.
Esseen PA, Ehnstrom B, Sjoberg K, Ericson L (1997). Boreal forests. In: “Boreal ecosystems and landscapes: structures, processes and conser-vation of biodiversity” (Hanson L ed). Ecologi-cal Bulletins 46, pp. 16-47. [online] URL:
http://www.jstor.org/stable/20113207
Forsee Project (2005). Proyecto FORSEE (20) IN-TERREG III B Espacio atlántico [online] URL:
http://www.iefc.net/index.php?affiche_page= projet_FORSEE
Franklin JF, Dyrness CT (1973). Natural vegeta-tion of Oregon and Washington. General Tech-nical Report PNW-8, USDA Forest Service, Portland, Oregon, USA, pp. 417.
Fridman J, Walheim M (2000). Amount, struc-ture, and dynamics of dead wood on managed forestland in Sweden. Forest Ecology and Mana-gement 131: 23-36. - doi: 10.1016/S0378-1127 (99)00208-X
and coarse woody debris in old-growth and ma-naged northern hardwood forests in Wisconsin and Michigan. Canadian Journal of Forest Re-search 28: 427-438. - doi: 10.1139/x98-014
Green P, Peterken GF (1997). Variation in the amount of dead wood in woodlands of the Lower Wye Valley, UK in relation to the intensity of management. Forest Ecology and Management 98: 229-228. - doi: 10.1016/S0378-1127(97) 00106-0
Grove SJ (2001). Extend and composition of dead wood in Australian lowland tropical rainforest with different management histories. Forest Ecology and Management 154: 35-53. - doi:
10.1016/S0378-1127(00)00618-6
Harmon ME, Franklin JF, Swanson FJ, Sollins P, Gregory SV, Lattin JD, Anderson NH, Cline SP, Aumen NG, Sedell JR, Lienkaemper GW, Cromack K Jr, Cummins KW (1986). Ecology of coarse woody debris in temperate ecosystems. Advances in Ecological Research 15: 133-302. - doi: 10.1016/S0065-2504(08)60121-X
Harmon M, Sexton J (1996). Guidelines for mea-surements of woody detritus in forest ecosys-tems. Publication no. 20, US/LTER Network Of-fice, University of Washington, Seattle, WA, USA.
Harmon ME, Woodall CW, Fasth B, Sexton J (2008). Woody detritus density and density re-duction factors for tree species in the United States: a synthesis. Gen. Tech. Rep. NRS-GTR-29, USDA Forest Service, Northern Research Station, Newtown Square, Pennsylvania, USA, pp. 65.
Herrero C, Pando V, Bravo F (2010). Modelling coarse woody debris in Pinus spp. plantations. A case study in Northern Spain. Annals of Forest Science 67: 708-716. - doi: 10.1051/forest/ 2010033
Hessburg PF, Agee JK, Franklin JF (2005). Dry forests and wildland fires in the inland North-west USA: contrasting the landscape ecology of the pre-settlement and modern eras. Forest Eco-logy and Management 211: 117-139. - doi:
10.1016/j.foreco.2005.02.016
Hyvonenn R, Olsson AB, Lundkvist H, Staaf H (2000). Decomposition and nutrient release from
Picea abies (L.) Karst. and Pinus sylvestris L. logging residues. Forest Ecology and Manage-ment 126: 97-112. - doi: 10.1016/S0378-1127 (99)00092-4
Jakoby O, Rademacher C, Grimm V (2010). Mo-delling dead wood islands in European beech forests: how much and how reliably would they provide dead wood? European Journal of Forest Research 129: 659-668. - doi: 10.1007/s10342-010-0366-3
Krankina ON, Harmon ME (1995). Dynamics of the dead wood carbon pool in Northwestern Rus-sian boreal forest. Water Air and Soil Pollution 82 (1/2): 227-238. - doi: 10.1007/BF01182836
Krankina ON, Harmon ME, Griazkin AV (1999). Nutrient stores and dynamics of woody detritus in a boreal forest: modelling potential implica-tions at the stand level. Canadian Journal of Forest Research 29: 20-32. - doi:
10.1139/x98-162
Krankina ON, Harmon ME, Kukuev YA, Treyfeld RF, Kashpor NN, Kresnov VG, Skudin VM, Protasov NA, Yatskov M, Spycher G, Povarov ED (2002). Coarse woody debris in forest re-gions of Russia. Canadian Journal of Forest Re-search 32: 768-778. - doi: 10.1139/x01-110
Laudenslayer WF (2005). Effects of site on the demographics of standing dead trees in eastside pine forests. In: Proceedings of the Symposium “Ponderosa pine: issues, trends, and manage-ment” (Ritchie MW, Youngblood A, Maguire DA eds). Gen. Tech. Rep. PSW-GTR-198, USDA Forest Service, California, USA, pp. 171-181.
Linder P, Elfving B, Zackrisson O (1997). Stand structure and successional trends in virgin boreal forest reserves in Sweden. Forest Ecology and Management 98: 17-33. - doi: 10.1016/S0378-1127(97)00076-5
Lombardi F, Lasserre B, Tognetti R, Marchetti M (2008). Deadwood in relation to stand manage-ment and forest type in central Apennines (Moli-se, Italy). Ecosystems 11: 882-894. - doi:
10.1007/s10021-008-9167-7
Lombardi F, Chirici G, Marchetti M, Tognetti R, Lasserre B, Corona P, Barbati A, Ferrari B, Di Paolo S, Giuliarelli D, Mason F, Iovino F, Nic-olaci A, Bianchi L, Maltoni A, Travaglini D (2010). Deadwood in forest stands close to old-growthness under Mediterranean conditions in the Italian Peninsula. Italian Journal of Forest and Mountain Environments 65: 481-504. - doi:
10.4129/ifm.2010.5.02
Marage D, Lemperiere G (2005). The manage-ment of snags: a comparison in managed and un-managed ancient forests of the southern French Alps. Annals of Forest Science 62: 135-142. - doi: 10.1051/forest:2005005
Merganicôvá K, Merganic J (2010). Coarse woody debris carbon stocks in natural spruce forests of Babia hora. Journal of Forest Science 56: 397-405. [online] URL: http://www.agricul-turejournals.cz/publicFiles/27548.pdf
McComn W, Lindenmayer D (1999). Dying, dead, and down trees. In: “Maintaining Bio-diversity in Forest Ecosystems” (Malcon L, Hunter JR eds). Cambridge University Press, Cambridge, UK, pp. 335-372.
Motta R, Berretti R, Lingua E, Piussi P (2006). Coarse woody debris, forest structure and regen-eration in the Valbona Forest Reserve, Panaveg-gio, Italian Alps. Forest Ecology and Manage-ment 235: 155-163. - doi: 10.1016/j.foreco. 2006.08.007
Oria de Rueda JA, Díez J, Rodríguez M (1996). Guía de las plantas silvestres de Palencia. Cálamo, Palencia, Spain. [in Spanish]
Ranius T, Kindvall O, Kruys N, Jonsson BG (2003). Modelling dead wood in Norway spruce stands subject to different management regimes. Forest Ecology and Management 182: 13-29. - doi: 10.1016/S0378-1127(03)00027-6
SAS Institute Inc (2010). SAS/STATTM User’s Guide, Relase 9.1. Cary, NC, USA.
Siitonen J, Martikainen P, Punttila P, Rauh J
(2000). Coarse woody debris and stand charac-teristics in mature managed and old-growth boreal mesic forests in southern Finland. Forest Ecology and Management 128: 211-225. - doi:
10.1016/S0378-1127(99)00148-6
Spetich MA, Shifley SR, Parker GR (1999). Coar-se woody debris in midwestern old-growth fo-rests. Forest Science 45: 302-313.
Spies TA, Franklin JF, Thomas TB (1988). Coarse woody debris in Douglas-fir forests of western Oregon and Washington. Ecology 69: 1689-1702. - doi: 10.2307/1941147
Tinker DB, Knight DH (2000). Coarse woody debris following fire and logging in Wyoming lodgepole pine forests. Ecosystems 3: 472-483. - doi: 10.1007/s100210000041
USDA Forest Service (2007). Forest inventory and analysis program: field instructions for the annual inventory of Washington, Oregon and California. Pacific Northwest Research Station, Portland, OR, USA, pp. 172. [online] URL: [on-line] URL: http://www.fs.fed.us/pnw/fia/publica-tions/fieldmanuals.shtml
Vallauri D, Andre J, Blondel J (2003). Dead wood - a typical shortcoming of managed forests. Re-vue Forestiere Francaise 55 (2): 99-112. - doi:
10.4267/2042/5172
Van Wagner CE (1968). The line-intersect method in forest fuel sampling. Forest Science 14: 20-26. Vandekerkhove K, De Keersmaeker L, Menke N,
Meyer P, Verschelde P (2009). When nature takes over from man. Dead wood accumulation in previously managed oak and beech woodlands in north-western and central Europe. Forest Eco-logy and Management 258 (4): 425-435. - doi:
10.1016/j.foreco.2009.01.055
von Oheimb G, Westphal C, Härdtle W (2007). Diversity and spatio-temporal dynamics of dead wood in a temperate near-natural beech forest (Fagus sylvatica). European Journal of Forest Research 126: 359-370. - doi: 10.1007/s10342-006-0152-4
Warren WG, Olsen PF (1964). A line-intersect technique for assessing logging waste. Forest Science 10: 267-276.
Woldendorp G, Keenan RJ, Barry S, Spencer RD (2004). Analysis of sampling methods for coarse woody debris. Forest Ecology and Management 198: 133-148. - doi: 10.1016/j.foreco.2004.03. 042
Woodall CW, Monleon VJ (2008). Sampling pro-tocol, estimation, and analysis procedures for the down woody materials indicator of the FIA Pro-gram (2nd edition). Gen. Tech. Rep.
NRS-GTR-22, USDA Forest Service, St. Paul, MN, USA. Woodall CW, Rondeux J, Verkerk PJ, Stahl G
(2009). Estimating dead wood during national forest inventories: a review of inventory method-ologies and suggestions for harmonization. En-vironmental Management 44: 624-631. - doi:
10.1007/s00267-009-9358-9