Sweetened beverages intake,
hyperuricemia and metabolic syndrome.
The Mexico City Diabetes Study
Rubén López-Molina, MSc,
(1)Socorro Parra-Cabrera, DSc,
(1)Ruy López-Ridaura, MD, PhD,
(1)María E González-Villalpando, MD,
(2)Ele Ferrannini, MD,
(3)Clicerio González-Villalpando, MD.
(1,2)(1) Unidad de Investigación en Diabetes y Riesgo Cardiovascular, Instituto Nacional de Salud Pública. México. (2) Centro de Estudios en Diabetes. México.
(3) Department of Medicine, School of Medicine, University of Pisa. Italy.
Received on: February 22, 2013 • Accepted on: July 1, 2013
Corresponding author: Dr. Clicerio González-Villalpando. Unidad de Investigación en Diabetes y Riesgo Cardiovascular, Instituto Nacional de Salud Pública. Sur 136 # 116-309, 01120 México DF.
E-mail: cliceriogonzalez@hotmail.com
López-Molina R, Parra-Cabrera S, López-Ridaura R, González-Villalpando ME, Ferrannini E, González-Villalpando C. Sweetened beverages intake, hyperuricemia and metabolic
syndrome. The Mexico City Diabetes Study. Salud Publica Mex 2013;55: 557-563.
Abstract
Objective
. To determine prevalence of hyperuricemia and
its relation with intake of sweetened beverages (SB) and
metabolic syndrome (MS) in low income urban Mexican
population.
Materials and methods.
A cross-sectional
analysis of The Mexico City Diabetes Study, a prospective
population-based investigation (1 173 participants) was
per-formed. We used logistic regression, adjusted by pertinent
variables. We determined prevalence of hyperuricemia and
explored associations of uric acid levels with MS and intake
of SB.
Results
. Prevalence of hyperuricemia was 26.5 and
19.8% in males and females respectively. In an adjusted
multivariate model, body mass index, waist circumference,
and triglyceride were higher as uric acid quartiles increased
(
p
<0.005-0.001). The odds ratio for MS was 1.48 for 3rd uric
acid quartile and 2.03 for 4th quartile. Higher consumption
of SB was associated with higher uric acid levels (
p
<0.001).
Conclusion.
Prevalence of hyperuricemia is high. Potential
association with intake of SB, resulting in metabolic
altera-tions should be considered.
Key words: hyperuricemia; beverages; metabolism; Mexico
López-Molina R, Parra-Cabrera S, López-Ridaura R,
González-Villalpando ME, Ferrannini E, González-Villalpando C. Ingesta de bebidas endulzadas, hiperuricemia y síndrome metabólico. Estudio de la Diabetes en la Ciudad de México. Salud Publica Mex 2013;55: 557-563.
Resumen
Objetivo.
Determinar prevalencia de hiperuricemia en
po-blación mexicana urbana de bajos ingresos, relación con
inges-ta de bebidas endulzadas y síndrome meinges-tabólico.
Material y
métodos.
Análisis transversal del Estudio de la Diabetes en la
Ciudad de México (1 173 participantes), utilizando regresión
logística, ajustada por variables pertinentes. Se determinó
prevalencia de hiperuricemia, se exploraron asociaciones de
niveles de ácido úrico con síndrome metabólico y bebidas
endulzadas.
Resultados
. La prevalencia de hiperuricemia fue
26.5 y 19.8%, hombres y mujeres, respectivamente. El índice
de masa corporal, circunferencia de cintura y triglicéridos
fueron más altos con cada cuartil de ácido úrico (
p
<0.005 -
0.001). La razón de momios para síndrome metabólico fue
1.48 para el tercer cuartil y 2.03 para el cuarto. Se encontró
mayor consumo de bebidas endulzadas a mayores niveles de
acido úrico (
p<
0.001).
Conclusión
. La prevalencia de
hipe-ruricemia es alta. La asociación con bebidas endulzadas y las
alteraciones metabólicas resultantes deben considerarse.
T
he interest in serum uric acid (UA) has re-emerged
due to its possible role as a cardiovascular risk factor.
Moreover, hyperuricemia (HU) contributes to the
devel-opment of renal disease, a cardiovascular risk factor.
1The
mechanism by which UA enhances these risks remains
under investigation. Excessive dietary intake of fructose
has recently emerged as a relevant association, since it
is an ingredient in foods and beverages consumed in
increasing quantities in Mexico.
2,3In studies in healthy
subjects, physiological increments in insulin
concentra-tion acutely decreased renal UA clearance jointly with
an increased sodium reabsorption. Hence, the chronic
hyperinsulinemia associated with insulin resistance
imposes a chronic antiuricosuric and antinatriuretic
pressure on the kidney, eventually influencing both UA
and blood pressure levels.
4,5Moreover, HU has been
re-lated to endothelial dysfunction and it is considered an
independent risk factor for high blood pressure (HBP).
The suggested mechanism is UA-mediated glomerular
hypertension, cortical vasoconstriction, glomerular
damage, and tubular ischemia. The intricacies and the
specific sequence of pathophysiologic events remain still
a matter of scientific investigation. Recent studies have
shown that lowering serum UA by reducing fructose
intake and/or the administration of allopurinol, results
in improvement of the metabolic alterations.
6In view of
the high prevalence of the components of the metabolic
syndrome (MS) in the Mexican population,
7the high
carbohydrate content in the Mexican diet,
8,9and the
significant consumption of sweetened beverages with
high fructose content in Mexico
10,11we explored the
prevalence of HU, the possible role of sweetened
bever-age intake and its association with the MS components
as elements possibly implicated in the chronic kidney
disease epidemic in the country. We present the results
of an analysis performed in the latest follow-up phase
of the Mexico City Diabetes Study (MCDS).
Materials and methods
The MCDS is a population-based, prospective,
investiga-tion designed to characterize the prevalence, incidence
and natural history of type 2 diabetes (T2D) and
cardio-vascular risk factors, in low-income urban inhabitants
of Mexico City. The methodology and its results have
been previously reported.
12,13The baseline phase started
in 1990 with 2 282 men and non-pregnant women (35
to 64 years). For the present analysis, we used the data
corresponding to the latest follow-up (2008). In this
phase, there were 1 174 participants, 463 (39%) men. One
subject did not have UA determination. Therefore, the
total cohort was 1 173 subjects. To estimate prevalence,
we assumed that self-reported allopurinol users (n=13)
had HU independently of their serum UA level. We
ex-cluded subjects who self-reported the use of thiazides,
(n=39). For the association with MS, we further excluded
allopurinol users (n=13) and subjects with incomplete
information on metabolic markers (n=5). The final cohort
therefore consisted of 1 116 subjects, 438 (39%) males. The
Institutional Review Board of both the Instituto Nacional
de Salud Pública and the Centro de Estudios en Diabetes
approved the study protocol. Informed consent was
obtained from the participating subjects in accordance
with the ethical principles for medical research involving
human subjects. All participants underwent a physical
exam. Blood pressure (BP) was measured three times,
using a calibrated sphygmomanometer, in the sitting
position after five min of rest, the mean of the last two
readings was used.
14Height and weight were measured
without shoes and upper garments. Body mass index
(BMI) was calculated as weight (kilograms) divided by
height (meters) squared. Waist circumference (WC) was
measured using standard methods. Participants
previ-ously diagnosed by a physician with HBP, and reporting
use of antihypertensive medication were considered
hy-pertensives regardless of their blood pressure values. For
subjects that were not known as hypertensives, we used
the criteria of the Joint Commission for The Diagnosis
& Treatment of Hypertension (JNC VII).
15Participants
who self-reported that they had a previous diagnosis of
T2D by a physician and were receiving pharmacologic
treatment for diabetes, were considered to have T2D
regardless of their blood glucose values. For subjects not
known to be diabetic we used the American Diabetes
Association diagnostic criteria (fasting glucose ≥126
mg/dL, or two-hour plasma glucose ≥200 mg/dL after
a standard, 75-g oral glucose load).
We used the Food Frequency Questionnaire (FFQ)
approach to estimate participant’s usual diet. This
in-strument was applied at baseline, and it was previously
validated in the Mexican population.
16,17This method
is useful to measure dietary patterns in long-term
co-horts.
18To determine the habitual sweetened beverages
intake in this population, we established four categories:
less than one bottle per week, one bottle per week to less
than one bottle a day, one bottle per day and more than
one per day. Smoking was defined by self-reporting as
current, past smoker or never smoker. Fasting venous
blood samples were taken for laboratory determination:
Total cholesterol, triglycerides, glucose, creatinine, and
uric acid were done in an auto-analyser.
19HbA
1c
was
measured using ion-exchange chromatography all at
the clinical laboratory of the ABC Hospital, Mexico City.
Glomerular Filtration Rate (eGFR) was estimated using
the Cockroft-Gault formula. HU was defined using the
-tions: ≥7mg/dL and ≥6mg/dL for men and women,
respectively).
20For each of the following four MS
components, we used the criteria established in Adult
Treatment Panel, (ATP-III): 1) Hyperglycemia (FPG ≥100
mg/dL or pharmacologic treatment for hyperglycemia),
2) Hypertriglyceridemia (fasting triglycerides levels
≥150mg/dl or current use of lipid lowering drugs), 3)
Abdominal obesity (WC ≥102 cm and ≥88cm for males
and females, respectively), and 4) HBP (blood pressure
≥130/85 mmHg or current use of antihypertensive
drugs).
21HDL was not used because it was not measured
in this follow up. We classified participants as having
none, only 1, any 2, any 3 or all 4 criteria, and defined
MS with at least any of 3 of these components.
Data are presented as mean±SD, Student
t
test was
used for group comparisons of continuous variables. For
the prevalence estimates, we calculated 95% confidence
intervals (CI) using the Agresti-Coull binomial confi
-dence intervals for proportions. To explore the possible
relationships between UA and the MS components, the
population was divided into quartiles of UA
concen-trations including both male and female participants.
To determine if there was an association between MS
components and UA quartiles, we calculated odds ratios
(OR) and 95% CI, using logistic regression models for the
combination of at least three of the MS components. Tests
for trend across quartiles were calculated by modelling
UA quartiles linearly, using the median value of each
quartile; a
p
-value of <0.05 was considered statistically
significant. All models were gender and age adjusted.
Additionally, we calculated another model adjusting by
years of study, current smoking, glomerular filtration rate
and sweetened beverage intake. All statistical analyses
were performed using the Stata 12.0 software.
Results
The mean age of the population was 62.8±7 years.
Overall, 120 men and 135 women met HU criteria, only
13 (5.3 %) of these subjects were receiving treatment
for HU. The mean value of UA level was 5.3 mg /dL
for the entire population (1 134 participants excluding
thiazide takers). After excluding allopurinol users, the
mean UA level was 8.1 ± 0.9 mg/dL and 7.1 ± 1.1 mg/
dL for hyperuricemic men and women, respectively.
There were no statistically significant differences be
-tween the diabetic and hypertensive subgroups as
shown in table I.
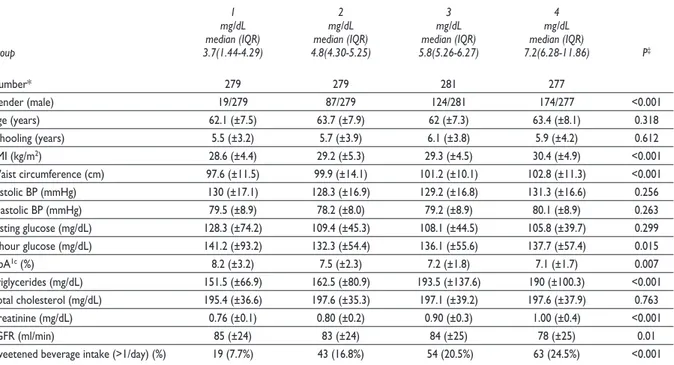
Upon stratifying the study population by quartile
of UA concentrations (table II), BMI, WC, and
triglyc-erides were significantly higher as UA concentrations
increased. Mean values for both systolic and diastolic
blood pressure levels tended to be similar in all uric
acid quartiles. Fasting, 2-hour glucose levels and HbA
1ctended to be high in all groups, reflecting the high preva
-lence of dysglicemia in this population. Surprisingly,
glucose and HbA
1clevels decreased across UA quartile.
Renal function, as estimated by serum creatinine levels
or eGFR, was progressively worse at higher UA levels.
The proportion of subjects with high intake of sweetened
beverage (> 1 bottle/day) increased steadily with UA
quartile (
p
<.001). We estimated that the intake of 1 bottle
of sweetened beverage per day could provide 45.9% of
total daily fructose intake.
Table I
P
revalenceofhyPeruricemiabyagegrouP,
gender,
andcondition.*
t
hem
exicoc
ityd
iabetess
tudy,
thirdfollowuP(2008-2009)
Age group All T2D With HBP Without HBP & T2D
Males Females Males Females Males Females Males Females (n=452) (n=682) (n=112) (n=175) (n=199) (n=320) (n=204) (n=285)
<64 years 25.1 16.0 28.0 10.7 24.8 14.7 22.1 18.4
(n=686) (20-30) (12.7-20) (19.6-39.5) (5.9-18.3) (17.9-33.2) (10.3-20.7) (15.8-30) (13.3-25)
≥ 65 years 29.1 25.1 20.0 27.8 20.5 24.8 38.3 22.0
(n=448) (22-36) (20.4-30.4) (9.7-36.2) (18.7-39.1) (12.9-30.9) (18.3-32.7) (28-49.8) (15.6-30.6)
Total HU 26.5 19.8 25.9 17.7 23.1 23.1 27.9 20.0
(n=255) (22-30) (17-23) (18.6-34.7) (12.7-24) (17.7-29.5) (17.8-29.5) (22.2-34.5) (15.7-25)
* Entries are % and 95% CI for 1 134 subjects, including allopurinol users (n=13) and excluding thiazide takers (n=39)
HU= hyperuricemia HBP= high blood pressure T2D= type 2 diabetes
Table II
c
linicalandmetaboliccharacteristicsbyquartileofserumuricacidconcentrations.*
t
hem
exicoc
ityd
iabetess
tudy,
thirdfollowuP(2008-2009)
1 2 3 4
mg/dL mg/dL mg/dL mg/dL
median (IQR) median (IQR) median (IQR) median (IQR)
Group 3.7(1.44-4.29) 4.8(4.30-5.25) 5.8(5.26-6.27) 7.2(6.28-11.86) P‡
Number* 279 279 281 277
Gender (male) 19/279 87/279 124/281 174/277 <0.001
Age (years) 62.1 (±7.5) 63.7 (±7.9) 62 (±7.3) 63.4 (±8.1) 0.318 Schooling (years) 5.5 (±3.2) 5.7 (±3.9) 6.1 (±3.8) 5.9 (±4.2) 0.612 BMI (kg/m2) 28.6 (±4.4) 29.2 (±5.3) 29.3 (±4.5) 30.4 (±4.9) <0.001
Waist circumference (cm) 97.6 (±11.5) 99.9 (±14.1) 101.2 (±10.1) 102.8 (±11.3) <0.001 Systolic BP (mmHg) 130 (±17.1) 128.3 (±16.9) 129.2 (±16.8) 131.3 (±16.6) 0.256 Diastolic BP (mmHg) 79.5 (±8.9) 78.2 (±8.0) 79.2 (±8.9) 80.1 (±8.9) 0.263 Fasting glucose (mg/dL) 128.3 (±74.2) 109.4 (±45.3) 108.1 (±44.5) 105.8 (±39.7) 0.299 2-hour glucose (mg/dL) 141.2 (±93.2) 132.3 (±54.4) 136.1 (±55.6) 137.7 (±57.4) 0.015 HbA1c (%) 8.2 (±3.2) 7.5 (±2.3) 7.2 (±1.8) 7.1 (±1.7) 0.007
Triglycerides (mg/dL) 151.5 (±66.9) 162.5 (±80.9) 193.5 (±137.6) 190 (±100.3) <0.001 Total cholesterol (mg/dL) 195.4 (±36.6) 197.6 (±35.3) 197.1 (±39.2) 197.6 (±37.9) 0.763 Creatinine (mg/dL) 0.76 (±0.1) 0.80 (±0.2) 0.90 (±0.3) 1.00 (±0.4) <0.001
eGFR (ml/min) 85 (±24) 83 (±24) 84 (±25) 78 (±25) 0.01
Sweetened beverage intake (>1/day) (%) 19 (7.7%) 43 (16.8%) 54 (20.5%) 63 (24.5%) <0.001
* entries are mean (±SD) or n (%) for 1 116 subjects excluding allopurinol (n=13) and thiazide takers (n=39)
‡ P for trend
BMI= body mass index BP= blood pressure
eGFR= estimated glomerular filtration rate HbA1c= glycosylated hemoglobin
IQR= interquartile range
Categorical data were analyzed by χ2 test
The proportion of individual MS components in
the UA quartiles is shown in table III. The prevalence
of obesity (BMI ≥30 kg/m
2) was higher with each
in-cremental level as was the proportion of subjects with
high waist circumference. The proportion of individuals
with high triglycerides rose above 60% in the top two
UA quartiles. We explored the association of various MS
components with UA quartiles by gender. There were
402 women with a mean UA concentration of 4.9±0.6
mg/dL who had less than three MS components, and
275 women with a mean UA level of 5.1±0.08 mg/dL
presenting more than three components (
p
=0.09). In
men, 313 individuals with a mean UA of 5.9±0.8 mg/dL
had less than three MS components, while 125 subjects
with a mean UA of 6.3±0.13 mg/dL had more than three
components (
p
=0.008) (data not shown in table III).
We evaluated the association between UA quartile,
MS risk (three or more components) and sweetened
beverage intake by means of logistic regression (table
IV). In model 1 adjusting for age and gender, we
found a 62% increased risk for the highest quartile. In
model 2, after also adjusting for smoking and
school-ing, the associations between uric acid quartiles and
MS did not change significantly. When entering eGFR
(model 3), MS risk was increased at the 3
rdUA quartile
(OR=1.48; 95% CI 1.02-2.14,
p
< 0.036), and the 4th
quartile (OR=2.03; 95% CI 1.37-3.00,
p
<0.001). Finally,
when adding sweetened beverage intake (model 4),
the association between MS and UA remained
statisti-cally significant (
p
<0.002). However we did not
dem-onstrated an additional effect, moreover the
p
value
Table III
P
roPortionofmetabolicsyndromecomPonentsbyuricacidquartiles.
t
hem
exicoc
ityd
iabetess
tudy,
thirdfollowuP(2008-2009)
1 2 3 4
mg/dL mg/dL mg/dL mg/dL
median (IQR) median (IQR) median (IQR) median (IQR)
Group 3.7(1.44-4.29) 4.8(4.30-5.25) 5.8(5.26-6.27) 7.2(6.28-11.86) ‡p value
Number* 279 279 281 277
BMI ≥30 kg/m2 100/279 (35.8%) 113/279 (40.5%) 126/281 (44.8%) 128/277 (46.2%) 0.007 WC ≥102 cm males 15/53 (28.3%) 23/87 (26.5%) 53/124 (42.8%) 80/174 (46.0%) 0.001 WC ≥88cm females 178/226 (78.8%) 170/192 (88.5%) 140/157 (89.2%) 93/103 (91.2%) 0.001 BP ≥130/85 mmHg 134/279 (48%) 118/279 (42.3%) 127/281 (45.2%) 140/277 (50.5%) 0.438 TG ≥150 mg/dL 113/279 (40.5%) 136/279 (48.7%) 170/281 (60.5%) 169/277 (61.0%) <0.001 FPG ≥100 mg/dL 89/279 (31.9%) 72/279 (25.8%) 70/281 (24.9%) 74/277 (26.7%) 0.167
Number of MS components
None 30/279 (10.8%) 30/279 (10.8%) 21/281 (7.5%) 22/277 (7.9%) 0.134 Only 1 65/279 (23.3%) 67/279 (24%) 58/281 (20.6%) 62 /277 (22.4%) 0.599 Any 2 88/279 (31.5%) 90/279 (32.3%) 97/281 (34.5%) 85 /277 (30.7%) 0.994 Any 3 73/279 (26.2%) 61/279 (21.9%) 74/281 (26.3%) 69 /277 (24.9%) 0.932 All 4 23/279 (8.2%) 31/279 (11.1%) 31/281 (11%) 38 /277 (13.7%) 0.05 At least any 3 MS criteria 96/279 (34.4%) 92/279 (33.0%) 105/281 (37.4%) 107/277 (38.6%)) 0.159
* Entries are n (%) for 1 116 subjects excluding allopurinol (n=13) and thiazide takers, (n=39)
‡ P for trend
IQR= interquartile range BMI= body mass index WC= waist circumference BP= Blood Pressure TG= Triglycerides FPG= Fasting Plasma Glucose MS= Metabolic Syndrome
Categorical data were analyzed by χ2 test
Table IV
m
ultiPlelogisticregressionmodelstoassessassociationofmetabolicsyndromeriskwithserumuricacidquartiles
. t
hem
exicoc
ityd
iabetess
tudy,
thirdfollowuP(2008-2009)
Model 1 Model 2 Model 3 Model 4
OR 95%CI p value OR 95%CI p value OR 95%CI p value OR 95%CI p value
Q1, 3.74 (1.44-4.29) 1.00 - - 1.00 1.00 - - - - 1.00 - -Q2, 4.79 (4.3-5.25) 0.99 0.69-1.41 0.968 0.99 0.70-1.42 0.999 1.01 0.69-1.46 0.950 1.06 0.71-1.58 0.773 Q3, 5.75 (5.26-6.27) 1.34 0.95-1.92 0.104 1.33 0.93-1.90 0.112 1.48 1.02-2.14 0.036 1.47 0.99-2.18 0.059 Q4, 7.19 (6.28-11.86) 1.62 1.11-2.34 0.012 1.59 1.09-2.31 0.015 2.03 1.37-3.00 <0.001 1.88 1.23-2.87 0.003
p for trend 0.004 0.005 <0.001 <0.002
Age, years 1.01 0.99-1.02 0.154 1.00 0.98-1.01 0.882 1.04 1.02-1.07 <0.001 1.05 1.02-1.07 <0.001 Gender, male vs. female 0.50 0.39-0.67 <0.001 0.56 0.42-0.75 <0.001 0.44 0.32-0.60 <0.001 0.46 0.32-0.65 <0.001 Smoking, current - - - 0.83 0.45-1.52 0.548 0.79 0.42-1.49 0.472 0.84 0.44-1.61 0.597 Schooling, years - - - 0.94 0.90-0.98 0.004 0.94 0.90-0.98 0.004 0.94 0.90-0.98 <0.001 Glomerular filtration rate (mL/min) - - - 1.02 1.01-1.03 <0.001 1.03 1.02-1.04 <0.001 Sweetened beverage
intake (1/week-<1/day) - - - 1.07 0.72-1.57 0.737 Sweetened beverage intake (1/day) - - - 1.38 0.88-2.15 0.157 Sweetened beverage intake (>1/day) - - - 1.36 0.83-2.23 0.227 Q= Quartiles. Entries Mean (range)
Discussion
The biochemical pathway linking fructose metabolism to
UA is known. Fructose phosphorylation by fructokinase
depletes intracellular ATP, thereby pushing both UA
synthesis (via inosine-monophosphate) and triglyceride
formation (via glycerol-3-phosphate).
22Experimental
evidence in laboratory animals and humans has
con-firmed that excessive fructose ingestion raises UA levels
inducing features of metabolic syndrome.
23, 24The prevalence of HU was found to be 26.5%
(95%CI, 22.7-30.8) in men and 19.8% (95%CI, 17-23)
in women. Although others have reported a relatively
high prevalence of HU in the Mexican population, we
find higher rates as compared with other estimates.
This might be due to age structure differences of the
study population, ours being older (62.8±7.7 years).
25, 26Alarmingly, in a small sample of medical students, 17 to
23 years old, the prevalence of HU was 19.8%.
27Similar
figures are seen in other countries: In 1 661 Brazilian
individuals (25-64 years old), prevalence of HU was of
13.2% (95%CI, 11.4-15%), statistically higher in men 16%
(95%CI, 14-18%) than women 10.7% (95%CI, 9-12%).
28In
a subsample of approximately 9 000 US adults a 18.9%
prevalence of HU has been found.
29Most HU cases were undiagnosed; consequently,
few were under medical treatment. Since the majority
of participants (98%) had healthcare access, lack of
medical management suggests insufficient public and
professional awareness. The previously reported high
prevalence of the various components of the MS, as
well as its consequences,
30makes undiagnosed HU a
significant finding. In fact, HU likely enhances risk for
chronic kidney disease (CKD)
31in a population already
with a high prevalence of nephropathy, as implicated
by the frequent occurrence of microalbuminuria.
32-34Overall, MS (at least three MS components) was
pres-ent in one third of our cohort, with most of MS
compo-nents (BMI, WC and triglycerides) increasing in frequency
across increasing UA quartiles. The association between
UA and the MS components in our population is so
con-sistent, as to suggest HU as an additional component of
MS, contributing along with disglycemia, hypertension,
and dislipidemia
35and even other nephrotoxic agents
such as lead
36to both cardiovascular and renal damage.
Perhaps a more robust public health intervention to
pre-vent CKD and atherosclerotic cardiovascular disease in
México, could be to deal with this cluster of conditions
in a comprehensive approach.
The reduction in glycemia and A1C levels across
the uric acid quartiles parallels the reduction in renal
function, as estimated by creatinine and eGFR. These
are related phenomena since it is known that the kidney
plays an important role in insulin metabolism and a
dimi-nution in renal capability is also a reduction in insulin
metabolism resulting in higher insulin effect, which is
reflected in decrements in glycemia and glycohemoglo
-bin values. This is a cohort effect, since the participants
in this phase of the MCDS are older adults.
In our population, sweetened beverage intake is
high.
37We found that its consumption increases across
UA quartiles, suggesting at least a possible role in the
differences seen in the prevalence of HU. Our results
support findings of a recent study
38demonstrating
the association of sweetened beverage intake with the
prevalence of HU and CKD.
39We recognize several limitations in our study;
namely: The diet assessment was obtained at baseline
only, without taking into account possible modifications
during follow-up. The estimate of sweetened beverage
intake was done using a FFQ. We did not include HDL
as part of the metabolic syndrome because it was not
measured in this follow up. A potential cohort effect
might explain the high prevalence of diabetes,
hyper-tension and dyslipidemia in our population. However,
our findings coincide with others and likely reflect a
growing health problem in Mexico.
Acknowledgements
The Mexico City Diabetes Study grants support : RO1HL
24799 from the National Heart, Lung and Blood Insti
-tute, USA; Consejo Nacional de Ciencia y Tecnología
(2092, M9303, F677-M9407, 251M & 2005-C01- 14502,
SALUD 2010-2-151165).
Declaration of conflict of interests. The authors declare that they have no conflict of interests.
References
1. Gagliardi AC, Miname MH, Santos RD. Uric acid: A marker of in-creased cardiovascular risk. Atherosclerosis 2009; 202:11-17.
2. Rho YH, Zhu Y, Choi HK. The epidemiology of uric acid and fructose. Semin Nephrol 2011;31:410-419.
3. Rivera JA, Muñoz-Hernández O, Rosas-Peralta M, Aguilar-Salinas CA, Popkin BM, Willett WC. [Beverage consumption for a healthy life: recommendations for the Mexican population]. Salud Publica Mex 2008;50:173-195.
4. Quiñones-Galván A, Natali A, Baldi S, Frascerra S, Sanna G, Ciociaro D, et al. Effect of insulin on uric acid excretion in humans. Am J Physiol 1995;268: E1-5.
5. Muscelli E, Natali A, Bianchi S, Bigazzi R, Galvan AQ, Sironi AM, et al. Effect of insulin on renal sodium and uric acid handling in essential hyper-tension. Am J Hypertens 1996;9:746-752.
7. Marquez-Sandoval F, Macedo-Ojeda G, Viramontes-Horner D, Fernández Ballart JD, Salas- Salvadó J, et al. The prevalence of metabolic syndrome in Latin America: a systematic review. Public Health Nutr 2011;14:1702-1713.
8. Barquera S, Campos-Nonato I, Hernández-Barrera L, Flores M, Du-razo-Arvizu R, Kanter R, et al. Obesity and central adiposity in Mexican adults: results from the Mexican National Health and Nutrition Survey 2006. Salud Publica Mex 2009;51 (Suppl 4):S595-603.
9. Aguilar-Salinas CA, Gómez-Pérez FJ, Rull J, Villalpando S, Barquera S, Rojas R. Prevalence of dyslipidemias in the Mexican National Health and Nutrition Survey 2006. Salud Publica Mex 2010; 52 (Suppl 1): S44-53. 10. Ventura EE, Davis JN, Goran MI. Sugar content of popular sweetened beverages based on objective laboratory analysis: focus on fructose content. Obesity 2011;19:868-874.
11. Encuesta Nacional de Ingresos y Gastos de los Hogares 2004. ENIGH. La Estructura, Distribución y Monto de los Ingresos de los Hogares 2004.[monografia en internet] Aguascalientes, Ags. Instituto Nacional de Estadística Geografía e Informática [consultado 2013 junio 4] Disponible en: http //www.inegi.gob.mx/prod.../encuestas/hogares/enigh/2004/ enigh_2004.pdf
12. Stern MP, González-Villalpando C, Mitchell BD, Villalpando E, Haffner SM, Hazuda HP. Genetic and environmental determinants of type II diabe-tes in Mexico City and San Antonio. Diabediabe-tes 1992; 41: 484-492. 13. Hunt KJ, González ME, Lopez R Haffner SM, Stern MP, González-Vil-lalpando C. Diabetes is more lethal in Mexicans and Mexican-Americans compared to Non-Hispanic whites. Ann Epidemiol 2011; 21:899-906. 14. Haffner S, González-Villalpando C, Hazuda H, Valdez R, Myk-känen L, Stern M. Prevalence of hypertension in Mexico City and San Antonio,Texas. Circulation 1994;90:1542-1549.
15. Chobanian AV, Bakris GL, Black HR, Cushman WC, Green LA, Izzo JL , et al. Seventh report of the Joint National Committee on Prevention, Detection, Evaluation, and Treatment of High Blood Pressure. Hyperten-sion 2003;42:1206-1252.
16. Hernández-Avila M, Romieu I, Parra S, Hernández-Avila J, Madrigal H, Willett W. Validity and reproducibility of a food frequency questionnaire to assess dietary intake of women living in Mexico City. Salud Publica Mex 1998;40:133-140.
17. Stern MP, González-Villalpando C, Hernández M, Knapp JA, Hazuda HP, Villalpando E, et al. Performance of semiquantitative food frequency questionnaires in international comparisons. Mexico City versus San Antonio, Texas. Ann Epidemiol 1993;3:300-307.
18. Millen BE, Quatromoni PA, Pencina M, Kimokoti R, Nam BH, Cobain S, et al. Unique dietary patterns and chronic disease risk profiles of adult men: The Framingham Nutrition Studies. J Am Diet Assoc 2005;105:1723-1734.
19. Oeltgen PR, Welborn JR, Burgess MS. Evaluation of the Ab-bott Spectrum “High-Performance” Diagnostic System. Clin Chem 1988;34:180-181.
20. Zhu Y, Pandya BJ, Choi HK. Prevalence of gout and hyperuricemia in the US general population: the National Health and Nutrition Examina-tion Survey 2007-2008. Arthritis Rheum 2011; 63: 3136-3141. 21. Alberti KG, Zimmet P, Shaw J , IDF Epidemiology Task Force Con-sensus Group. The metabolic syndrome--a new worldwide definition. Lancet 2005;366:1059-1062.
22. Lanaspa MA, Tapia E, Soto V, Sautin Y, Sánchez-Lozada LG. Uric acid and fructose: potential biological mechanisms. Semin Nephrol 2011;31:426-432.
23. Johnson RJ, Perez-Pozo SE, Sautin YY, Manitius J, Sanchez-Lozada LG, Feig DI, et al. Hypothesis: could excessive fructose intake and uric acid cause type 2 diabetes? Endocr Rev 2009;30:96-116.
24. Teff KL, Grudziak J, Townsend RR, Dunn TN, Grant RW, Adams SH,
et al. Endocrine and metabolic effects of consuming fructose- and glucose-sweetened beverages with meals in obese men and women: Influence of insulin resistance on plasma triglyceride responses. J Clin Endocrinol Metab 2009;94:1562-1569.
25. González-Chávez A, Elizondo-Argueta S, Amancio-Chassin O. Relación entre síndrome metabólico e hiperuricemia en población apar-entemente sana. Rev Med Hosp Gen Mex 2011; 74:132-137.
26. Reyes-Jiménez AE, Navarro J, Cruz IM, Castro DLJ, Landgrave GJ, Narváez PC, et al. Prevalencia del síndrome metabólico en relación con las concentraciones de ácido úrico. Med Int Mex 2009;25:278-284. 27. Llamazares-Azuara L, Rodríguez-Martínez M, De la Cruz-Mendoza E, Torres Ruvalcaba A, Flores-Sánchez J. Prevalencia de hiperuricemia, resistencia a la insulina, obesidad y dislipidemias en jovenes de 17 a 23 años. Bioquimia 2007;32:134.
28. Rodrigues SL, Baldo MP, Capingana P, Magalhães P, Dantas EM, Molina M del C, et al. Gender distribution of serum uric acid and cardiovascular risk factors: population based study. Arq Bras Cardiol 2012; 98: 13-21. 29. Choi HK, Ford ES. Prevalence of the metabolic syndrome in individu-als with hyperuricemia. Am J Med 2007;120:442-447.
30. Aguilar-Salinas CA, Rojas R, Gómez-Pérez FJ, Valles V, Ríos-Torres JM, Franco A, et al. High prevalence of metabolic syndrome in Mexico. Arch Med Res 2004;35: 76-81.
31. Wen CP, David-Cheng TY, Chan HT, Tsai MK, Chung WS, Tsai SP, et al. Is high serum uric acid a risk marker or a target for treatment ? Exami-nation of its independent effect in a large cohort with low cardiovascular risk. Am J Kidney Dis 2010;56:273-288.
32. Obrador GT, Garcia-Garcia G, Villa AR, Rubilar X, Olvera N, Fer-reira E, et al. Prevalence of chronic kidney disease in the Kidney Early Evaluation Program (KEEP) Mexico and comparison with KEEP US. Kidney Int Suppl 2010;116:S2-S8
33. Haffner SM, González-Villalpando C, Valdez RA, Mykkänen L, Hazuda HP, Mitchell BD, et al. Is microalbuminuria part of the prediabetic state ? The Mexico City Diabetes Study. Diabetologia 1993;36:1002-1006. 34. Jimenez-Corona A, Rivera-Martinez D, Hernandez-Avila M, Haffner S, Williams K, González-Villalpando ME, et al. Microalbuminuria as a predic-tor of myocardial infarction in a Mexican population: The Mexico City Diabetes Study. Kidney Int Suppl 2005;97:S34-S39.
35. González-Villalpando C, Stern MP, González-Villalpando ME, Rivera MD, Simón J, Islas S, et al. The Mexico City Diabetes Study: A popula-tion based approach to the study genetic and environmental interac-tions in the pathogenesis of obesity and diabetes. Nutrition Reviews 1999;57:S71-S77.
36. Hernández Avila M, González-Villalpando C, Palazuelos E, Hu H, González-Villalpando ME, Rivera Martínez D. Determinants of blood lead levels across the menopausal transition. Arch Environ Health 2000;55:355-360.
37. Jiménez-Aguilar A, Flores M, Shamah-Levy T. Sugar-sweetened bever-ages consumption and BMI in Mexican adolescents: Mexican National Health and Nutrition Survey 2006. Salud Publica Mex 2009; 51 (Suppl 4):S604-612.
38. Bomback AS1, Derebail VK, Shoham DA, Anderson CA, Steffen LM, Rosamond WD, et al. Sugar-sweetened soda consumption, hyperurice-mia, and kidney disease. Kidney Int 2010;77:609-616.