ECHOES OF THE CRISES IN SPAIN AND US IN THE COLOMBIAN LABOR
MARKET: A DIFFERENCES-IN-DIFFERENCES APPROACH
Dolores de la Mata
Luis Eduardo Arango
Nataly Obando
SERIE DOCUMENTOS DE TRABAJO
No. 162
Echoes of the crises in Spain and US in the Colombian labor
market: a differences-in-differences approach
By
Luis E. Arango* Dolores de la Mata Nataly Obando
Banco de la República Universidad del Rosario Inter-American Development Bank
Abstract
This paper presents evidence of the effect of the recent phases of the business cycle in Spain and United States, proxied by their respective unemployment rates, on the labor market of Colombian cities with high migration tradition. These countries are the main destination for labor Colombian migrants. Using information from the household survey between 2006 and 2011 for urban areas in Colombia and a differences-in-differences approach we find that unemployment rates of those countries negatively affect the probability and the amount of remittances received by Colombian households living in areas with high and moderate migration tradition. At a second stage we provide evidence that unemployment rates of those countries positively affect the labor force participation decisions in Colombian regions with the highest migration tradition.
Keywords: migration, remittances, labor participation, Spanish and United States unemployment rates.
JEL classification: C21, J21, J22
* The opinions expressed here are not necessarily those of neither the Banco de la República nor its Board of Directors
nor IADB. We appreciate comments and suggestions of Juan Esteban Carranza. Research assistance of Gabriela Bonilla and Álvaro José Pinzón is greatly acknowledged. Usual disclaimers apply.
1. Introduction
International labor mobility affects economies in a myriad of dimensions. For example, if we focus in the country of origin of migrants, it affects labor supply composition in terms of human capital and skills, behavior of wages in local markets, accumulation of assets, exchange rate movements, and reception of remittances. The later are potential determinants of schooling and labor market decisions of non-migrants (see Fajnzylber and López, 2008; Medina and Cardona, 2008; Cárdenas, Medina and Trejos, 2010).
The causes and effects of migration and remittances on labor force participation can be difficult to identify as have been recognized previously in the literature (see for example, Hanson, 2007; Amuedo-Dorantes and Pozo, 2010). First, remittances sent by migrants to non-migrants could eventually increase the reservation wage of the latter, making more difficult for them the acceptance of any offer in the labor market and increase the propensity of discouragement when search period is longer than expected. Second, migration by itself, irrespective of the presence of remittances, can affect the labor-leisure decisions of secondary workers in the household since any of them can take the place of the migrant to compensate the income previously provided by the latter. Third, if migration is massive in the city or region, secondary workers could engage in market activities given the increase in the real wage due to the contraction of labor supply. Thus, at the end, the effects of migration and remittances can compensate or mitigate each other.
The results found by previous literature in this regard are mixed. Funkhouser (1992) showed that remittances reduced labor force participation in Nicaragua while, for the case of Jamaica, Kim (2007) found that remittance income limited the labor supply (see also Bussolo and Medvedev, 2008). Hanson (2007) and Cox- Edwards and Rodríguez-Oreggia (2007) studied the link between remittances and labor market participation for the case of Mexico. The former, found that women in states of high-migration rates are less likely to work outside the home. Cox- Edwards and Rodríguez-Oreggia (2007), distinguished between systematic and non-systematic remittances. According to their results, remittances have only a marginal effect on labor participation except for women in urban areas of states with relatively low migration tradition, which have higher rates of participation due to remittances. In this case, the result is compatible with the setting of family enterprises. More recently, Arango, Montenegro and Obando (2013), for the case of Colombia, showed that remittances receipt is associated with a lower probability of participation in the labor market mainly in zones of high migration tradition such as Pereira. Mora (2013) also analyzed the case of Colombia finding that the decision of participation is affected by remittances income. Finally, Bargain and Boutin (2014) find that child labor market activities in Burkina Faso are reduced as a result of remittances.
Interestingly, while economic conditions in Spain and the US were worsening after 2008, labor force participation rates in areas with high migration tradition experienced a rapid increase, relative to other areas, leading to a notable increase in unemployment rates. Recent research (Cárdenas, Medina and Trejos, 2010; Arango, Montenegro and Obando, 2013) pointed to the dynamics of remittances as a potential determinant of the changing labor force participation rates in areas with high migration tradition.
The aim of this paper is threefold. The first objective is to study whether economic conditions of countries which are the main destinations of Colombian immigrants can affect in a differential fashion the flow of remittances received by Colombian households depending on the geographical location: areas of high or low migration rates. The second objective -provided the effect on remittances is present- is to identify the causal effect of foreign countries economic conditions on individual –non-migrants-- labor force participation decisions differentially across regions. Finally, given that during an important fraction of the sample period the economic conditions of the main Colombian migrants host countries worsen, we also explore whether part of the effects on labor force participation could be driven by returning migrants.
In order to identify the causal effects of interest we implement a differences-in-differences (DD) approach which exploits, on the one hand, the heterogeneity of emigration rates across Colombian regions. This regional heterogeneity affects the extent to which individuals residing in different Colombian municipalities are exposed to foreign economic conditions mainly through the reception of remittances. On the other hand, we exploit the changes in economic conditions during the period 2006:10-2011:12 in the two countries which are the main destination of Colombian migrants (Spain and US). These changes may have generated exogenous variation in the flow of remittances sent to Colombia as the economic conditions of these two countries substantially worsen during the period of analysis.
Our data comes from the Great Integrated Household Survey (GEIH is the Spanish acronym).
Additionally, we use the Colombian 2005 census data to classify municipalities in the GEIH as areas with high or low emigration rates and define treatment and control groups. These data shows that Spain and US are the top destinations of Colombian migrants. This regional variation allows us to construct treatment and control groups. The treatment groups are individuals residing in Colombian municipalities with high and moderately-high migration rates --more than 5% of the households with at least one family member living in either Spain or US according to the 2005 Census-- which are more likely to be exposed and affected by the changing economic conditions of immigrants’ host countries. In our baseline specification we define two types of treatments: municipalities with high emigration rates and municipalities with moderate emigration rates.1 The
1 According to the Ministry of Foreign Affairs, Pereira, which is classified as a treatment municipality, is one of the
control group consists of individuals residing in municipalities with very low emigration rates --with less than 2% of the households --with at least one family member living in Spain or the United States according to the 2005 census-- which is less likely to be affected by the changing economic conditions in foreign countries.2
Our results indicate that an increase in unemployment rate of foreign countries (Spain or the US) reduces the probability that a household in the treatment groups receives remittances and the amount of remittances. With regard to labor force participation, the results indicate that the worsening economic conditions in the foreign countries increases the likelihood of participating in the labor market in municipalities with high emigration rates while it has no effects on municipalities with moderate emigration rates. This evidence is consistent with the theoretical prediction that lower remittances, due to the income effect associated to them, increases the probability of engagement in labor market activities.3 We do not find any effect on household size, indicating that any affect we find of the foreign countries conditions on labor force participation decisions should be driven mainly by remittances receipt.
We implement several robustness exercises to validate our results. First, we perform placebo regressions where we use as placebo treatment group individuals residing in municipalities with relatively low emigration rates, which should not be affected by changes in external economic conditions. We show that, as expected, there are no effects of unemployment rate of Spain or US on labor force participation decisions of individuals in the placebo treatment group. Second, we show that our results are not sensitive to the definition of the control group. Third, given that our empirical strategy relies on the assumption that the increase in unemployment rates in the principal host countries of Colombian immigrants was unexpected for Colombian households we shorten the period of analysis in which this assumption is more likely to hold and we find similar results. Finally, we carry out an exercise where we restrict the analysis in control and treatment groups only to those individuals that neither them nor other of the household members received remittances in the 12 months prior to the interview, as an imperfect proxy of those individuals that are less likely to be affected from changes in external economic conditions. We show that effects of external unemployment rates have a lower effect on this subgroup.
This paper contributes to empirical literature that links migration and remittances with engagement in labor market activities of those non-migrants by providing, to the best of our knowledge, a novel difference in difference empirical strategy. Specifically, we identify causal
Departamento Administrativo Nacional de Estadística, DANE (the Official Statistics Bureau) in July 2004, suggests that remittances from abroad represent 10% of total household income.
2 Municipalities with a low proportion of households with at least one family member living in Spain or US (between
2 and 5%) are left out of the baseline analysis, but used lately for a placebo analysis.
3 One question that arises, but is beyond of the scope of this article, is the related to the educational level of migrants
effects of the economic conditions of the main Colombian migrant’s destination countries on remittances receipt and labor force participation decisions by exploiting regional heterogeneity in emigration rates as well as the worsening economic conditions experimented by those countries in the period 2006-2011. This empirical strategy is in the spirit of Amuedo-Dorantes and Pozo (2010) who use cross section variability in unemployment rates in the US to instrument remittances receipt of households in Dominican Republic. This type of empirical strategy is much more data demanding than ours, since detailed information about residence of the emigrated family member is not always available in nationally representative household surveys, like the case of the GEIH.
Previous contributions on the link between remittances and labor market participation in Colombia have been carried out (see for example, Cárdenas, Medina and Trejos, 2010; Garay and Rodríguez 2005; Cadena and Cárdenas, 2004; Mora, 2013; Arango, Montenegro and Obando, 2013). However, our contributions go in different ways such us the explicit discussion of endogeinity and its correction by means of the business cycle indicators (unemployment rate) of Spain and US economies.4 Also, the use of a differences-in-differences approach to exploit regional heterogeneity in the effect of remittances on labor market decisions of individuals.
The article is organized as follows. The second section reviews some facts about migration, remittances and labor market in cities of high, moderately-high, low and very low migration tradition. The third section presents the data. The fourth section explains the empirical strategy to test the hypothesis that labor participation in Colombia is sensitive, in a differential fashion among the cities, to the Spanish and United States business cycle trough remittances and the effect of the returning back of some migrants. The fifth section shows and discusses the results. The sixth section presents robustness analysis. Finally, the seventh section concludes.
2. Migration, remittances y labor market facts
2.1 Migration and remittances
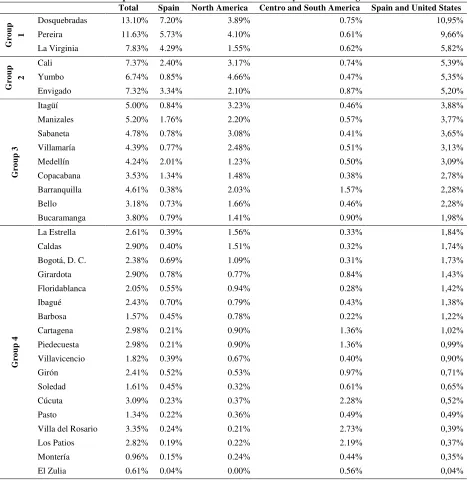
Table 1 presents Census 2005 data of the proportion of households with at least one family member living abroad for each of the Colombian municipalities that conforms the domain named “thirteen areas”; an area is formed by the capital city of the provinces and the nearby municipalities associated to it by means of the political division called “metropolitan area”.5 According to the 2005 Colombian Census data there is substantial regional variation across the main cities in this dimension. Spain and the United States are the main destinations of Colombian immigrants; there are municipalities with as much as 10% of the households with at least one family member living in any of these two countries.
4 To deal with endogeneity of remittances, Mora (2013) uses the Internet access of families supposing that this
variable is correlated to remittances but not with labor participation.
5 Table 1 reports information only for municipalities in the
GEIH survey which is the information we use later for the
Table 1. Proportion of families with at least one family member living abroad
Total Spain North America Centro and South America Spain and United States
G
ro
u
p
1
Dosquebradas 13.10% 7.20% 3.89% 0.75% 10,95%
Pereira 11.63% 5.73% 4.10% 0.61% 9,66%
La Virginia 7.83% 4.29% 1.55% 0.62% 5,82%
G
ro
u
p
2
Cali 7.37% 2.40% 3.17% 0.74% 5,39%
Yumbo 6.74% 0.85% 4.66% 0.47% 5,35%
Envigado 7.32% 3.34% 2.10% 0.87% 5,20%
G
ro
u
p
3
Itagüí 5.00% 0.84% 3.23% 0.46% 3,88%
Manizales 5.20% 1.76% 2.20% 0.57% 3,77%
Sabaneta 4.78% 0.78% 3.08% 0.41% 3,65%
Villamaría 4.39% 0.77% 2.48% 0.51% 3,13%
Medellín 4.24% 2.01% 1.23% 0.50% 3,09%
Copacabana 3.53% 1.34% 1.48% 0.38% 2,78%
Barranquilla 4.61% 0.38% 2.03% 1.57% 2,28%
Bello 3.18% 0.73% 1.66% 0.46% 2,28%
Bucaramanga 3.80% 0.79% 1.41% 0.90% 1,98%
G
ro
u
p
4
La Estrella 2.61% 0.39% 1.56% 0.33% 1,84%
Caldas 2.90% 0.40% 1.51% 0.32% 1,74%
Bogotá, D. C. 2.38% 0.69% 1.09% 0.31% 1,73%
Girardota 2.90% 0.78% 0.77% 0.84% 1,43%
Floridablanca 2.05% 0.55% 0.94% 0.28% 1,42%
Ibagué 2.43% 0.70% 0.79% 0.43% 1,38%
Barbosa 1.57% 0.45% 0.78% 0.22% 1,22%
Cartagena 2.98% 0.21% 0.90% 1.36% 1,02%
Piedecuesta 2.98% 0.21% 0.90% 1.36% 0,99%
Villavicencio 1.82% 0.39% 0.67% 0.40% 0,90%
Girón 2.41% 0.52% 0.53% 0.97% 0,71%
Soledad 1.61% 0.45% 0.32% 0.61% 0,65%
Cúcuta 3.09% 0.23% 0.37% 2.28% 0,52%
Pasto 1.34% 0.22% 0.36% 0.49% 0,49%
Villa del Rosario 3.35% 0.24% 0.21% 2.73% 0,39%
Los Patios 2.82% 0.19% 0.22% 2.19% 0,37%
Montería 0.96% 0.15% 0.24% 0.44% 0,35%
El Zulia 0.61% 0.04% 0.00% 0.56% 0,04%
Source: Census, 2005; authors’ calculations.
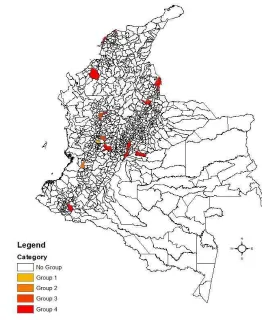
moderately-high rates of migration such as Cali, Yumbo and Envigado (Group 2). The rest of municipalities, those with migration rates below 5% are divided into two groups: Group 3 is made by cities low rates of migration, such as Itagüí, Manizales, Sabaneta, etc. (migration rates between 2% and 5%), and, finally, Group 4 is composed by cities of very low migration rates (below 2%). Figure 1 shows the location of these municipalities in Colombia.
Figure 2 shows the proportion of households that report receiving remittances in the period 2006-2011, according to the GEIH, where it is clear the importance of this variable for families of
Groups 1 and 2. It is also clear, that after July 2008 the share family beneficiaries of remittances started to decrease from 19.7% up to 12.5% in October 2009. By the end of 2011 the proportion of family beneficiaries was about 16%.
Remittances are an important income source for households in Pereira and are even considered by them as a “quasi-permanent income” (Garay and Rodríguez, 2005).6 The three purposes they
are mainly used for are food (29.3%), utilities (23.3%) and housing (15.5%).7 According to Cadena and Cárdenas (2004) remittances have been used to cover basic needs (food, education, housing, etc.) and are an alternative income during the recession phase of the Colombian cycle.8,9
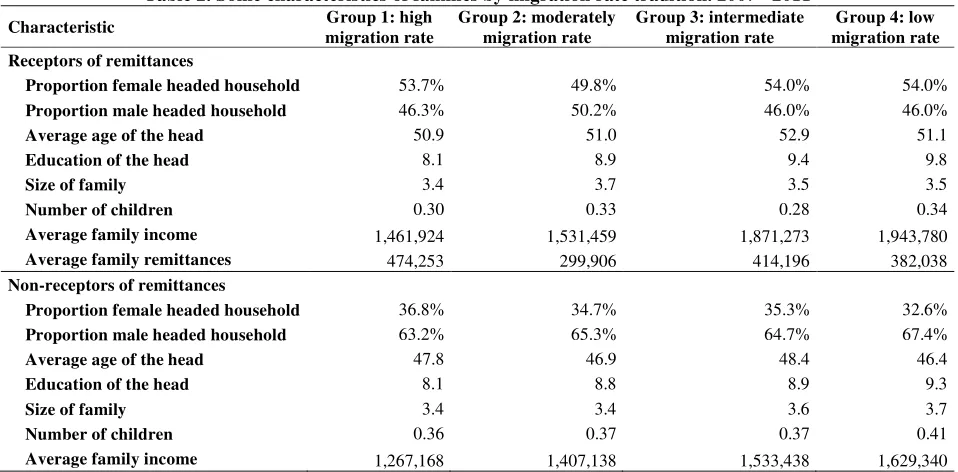
Table 2 shows some characteristics by group where two important figures emerge. First, families receiving remittances are more likely to be led by females than those households that do not receive remittances. The proportion is much higher in the case of families that receive remittances (50% or more) than in the case of families that do not (less than 36.5%). These would suggest that migration might not be random or incidental. Second, the low schooling level in cities of Group 1; that is, the group with the higher rate of migration. If this schooling indicators maintain for emigrated from cities of Group 1, it might indicate that Spain and United States are carrying out a negative selection of migrants, which make them more vulnerable to the business cycle in host countries.
6 Sánchez (2008) analyzes aspects related to remittances and poverty.
7 Cardona and Medina (2006) found that beneficiaries of remittances spend about 10% more of their total spending on
education.
8 In this sense, the authors suggest that remittances were countercyclical and served the purpose of smoothing
consumption. However, it is possible that during the recent crisis the countercyclical behavior of remittances has switched to a pro-cyclical behavior.
9 For the case of Mexican immigrants with work experience in the United States, Amuedo-Dorantes and Pozo (2006)
Figure 1. Geographic localization of cities by migration rates.
Source: Census, 2005.
Figure 2. Proportion of households that received remittances per group of cities
Source: DANE: GEIH; authors’ calculations.
0% 5% 10% 15% 20% 25%
A
ug
-0
6
F
eb
-0
7
A
ug
-0
7
F
eb
-0
8
A
ug
-0
8
F
eb
-0
9
A
ug
-0
9
F
eb
-1
0
A
ug
-1
0
F
eb
-1
1
A
ug
-1
1
[image:9.595.177.414.547.705.2]Table 2. Some characteristics of families by migration rate tradition. 2007 - 2011
Characteristic Group 1: high migration rate
Group 2: moderately migration rate
Group 3: intermediate migration rate
Group 4: low migration rate Receptors of remittances
Proportion female headed household 53.7% 49.8% 54.0% 54.0% Proportion male headed household 46.3% 50.2% 46.0% 46.0%
Average age of the head 50.9 51.0 52.9 51.1 Education of the head 8.1 8.9 9.4 9.8 Size of family 3.4 3.7 3.5 3.5 Number of children 0.30 0.33 0.28 0.34 Average family income 1,461,924 1,531,459 1,871,273 1,943,780
Average family remittances 474,253 299,906 414,196 382,038
Non-receptors of remittances
Proportion female headed household 36.8% 34.7% 35.3% 32.6% Proportion male headed household 63.2% 65.3% 64.7% 67.4% Average age of the head 47.8 46.9 48.4 46.4 Education of the head 8.1 8.8 8.9 9.3 Size of family 3.4 3.4 3.6 3.7 Number of children 0.36 0.37 0.37 0.41 Average family income 1,267,168 1,407,138 1,533,438 1,629,340
Note: Group 1: municipalities with high migration tradition; Group 2: municipalities with moderate migration tradition; Group 3: municipalities with medium migration tradition; Group 4: municipalities with low migration tradition. Source: DANE: GEIH; authors’ calculations.
2.2 Labor force participation
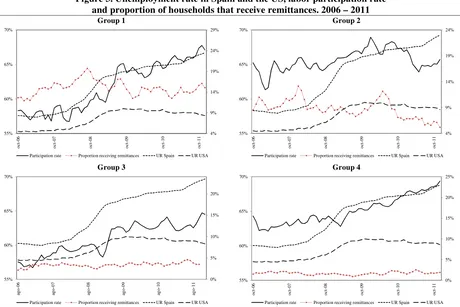
Figure 3 shows the labor participation rate of in each group together with proportion of households that receive remittances and the unemployment rate of Spain and US. From the picture we can observe that participation (solid lines) started to rise at the beginning of 2007 in municipalities of groups 2, 3 and 4 while it started about one year later in municipalities of Group 1. However, the increase of this variable was sharper since mid-2008 for the latter group. All these movements in group 1 in the participation rate are fairly close in time to the decrease in the proportion of households receiving remittances. After 2008 the participation rate started to increase steadily in cities of group 1, where the upsurge in participation rate exceeded 10 percentage points in less than four years. This phenomenon could have at least two explanations. First, in could be driven by the reduction in remittances received by the households in group 1, as a consequence of the worsening economic conditions in the main destination countries of Colombian immigrants. Note that participation rates in group 4 --where remittances have a low incidence—does no present a sharp increase, as for group 1. Second, it could be explained by the returning migrants, that departed mainly to Spain and US time ago, given the worse economic conditions in the destination countries.
recently, Cárdenas, Medina and Trejos (2010) found that, on the one hand, remittances do not have a significant effect on the labor force participation of males living in households with an absent migrant, but on the other hand, individuals in households receiving remittances are almost 4 per cent less likely to participate in the labor market. This effect is mainly driven by the responses of females, who are almost 5 per cent less likely to participate.
Figure 3. Unemployment rate in Spain and the US, labor participation rate and proportion of households that receive remittances. 2006 – 2011
Group 1 Group 2
Group 3 Group 4
Note: The left vertical axis measures participation rate. The right vertical axis measures unemployment rate of Spain and US and the proportion of households receiving remittances in the last 12 month. Source: DANE: ECH – GEIH. The unemployment rates of Spain and the US are obtained from http://data.bls.gov/pdq/SurveyOutputServlet; authors’ calculations.
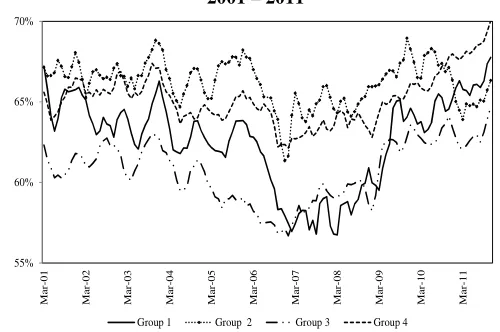
To disentangle whether labor participation behavior in the municipalities with the highest migration rates is not just an aggregate phenomenon in Colombia, Figure 4 presents the behavior of labor market participation in the cities of the four groups for a longer period of time (2001-2011). Cities of Group 1 report a downward movement up to beginning of 2007 and started to increase during 2008. In cities of Group 2 the behavior of participation rate is different though. It did not drop as much as the previous one in the middle of the past decade. Nevertheless, it dropped and increased between 2006 and 2009, then undergone a new descend and a new upsurge. Group 3, of low migration rate, had a behavior rather close to the Group 2 except for the more recent period, where it did not decrease but maintain the steady raise. Finally, the very low migration rate
4% 9% 14% 19% 24% 29% 55% 60% 65% 70% oc t-06 oc t-07 oc t-08 oc t-09 oc t-10 oc t-11
Participation rate Proportion receiving remittances UR Spain UR USA
4% 9% 14% 19% 24% 55% 60% 65% 70% oc t-06 oc t-07 oc t-08 oc t-09 oc t-10 oc t-11
Participation rate Proportion receiving remittances UR Spain UR USA
0% 5% 10% 15% 20% 55% 60% 65% 70% ag o-06 ag o-07 ag o-08 ag o-09 ag o-10 ag o-11
Participation rate Proportion receiving remittances UR Spain UR USA
0% 5% 10% 15% 20% 25% 55% 60% 65% 70% oc t-06 oc t-07 oc t-08 oc t-09 oc t-10 oc t-11
group, Group 4, had an less intense increase of the participation rate since January 2007. It is possible that, for this group, of the set of participation rate determinants, remittances should be unimportant.
Figure 4. Participation rate in thirteen cities grouped by migration rates 2001 – 2011
Source: DANE: ECH – GEIH; authors’ calculations.
3. Data
We use the GEIH for the period November 2006 to December 2011.10 The GEIH is a nationally representative monthly cross section survey, interviewing about 248,028 household annually, both in urban and rural areas. The questionnaires ask about housing conditions, demographic characteristics, occupation and working conditions, schooling, income sources (among which there are remittances), certain types of social benefits, among others.
Our first outcome of interest —at the household level— is whether any household member receives remittances and the total amount. Specifically, the survey asks information about remittances received by each household member in the last 12 months. Accordingly, we construct two variables: first, a dummy variable that takes the value one if the household received remittances in the last 12 months; second, a variable with the total amount of remittances (nominal Colombian pesos) received in the last 12 months by all household members. Unfortunately, the survey does not collect direct information about the family members living in foreign countries. The only information available related to family members abroad is through the remittances receipt information. However, the fact that the household does not receive remittances does not imply that the household does not have in that moment a family member living abroad. This data
10
The GEIH Survey started in July 2006. Given that there were some implementation issues during the first months, we prefer to discard the first three waves from our sample.
55% 60% 65% 70% M ar -0 1 M ar -0 2 M ar -0 3 M ar -0 4 M ar -0 5 M ar -0 6 M ar -0 7 M ar -0 8 M ar -0 9 M ar -1 0 M ar -1 1
limitation prevents us to conduct our analysis comparing the labor force participation behavior of individuals with and without relatives living abroad.
The second outcome of interest is household size. This outcome allows us to analyze whether the worsening economic conditions in main destinations of Colombian immigrants are inducing those immigrants to return back to Colombia. The third outcome of interest —at the individual level— is whether an individual participates in the labor force. We construct a dummy variable taking the value one if the individual participates in the labor market and zero in other case.
We restrict our analysis to individuals between 12 and 75 years old, living in the largest Colombian urban areas. These cities are: Barranquilla, Bucaramanga, Bogotá, Cali, Cartagena, Cúcuta, Ibagué, Manizales, Medellín, Montería, Pasto, Pereira, Villavicencio. These thirteen areas cover 33 municipalities (see Table 1).
Other individual characteristics we include as control variables in our regression analysis are municipality of residence dummies, age, years of education, marital status, whether the individual is the head of the household, the presence and number of children under age 7 living in the household. Individual’s region-of-residence characteristics, such as the unemployment rate of the age-group the individual belongs to is also included as control variable.11
Some of our empirical specifications below include a whole set of month and year dummies (and their interactions) to capture the Colombian business cycle. Alternatively, as a proxy of the internal macroeconomic conditions, we use an index called the “Accumulated Diffusion Index” (see Alfonso, etal. 2013). We additionally consider the gross regional domestic product growth
(available from DANE at the department –province- level, on an annual basis) to control for region-specific business cycle.
As Table 1 shows, Spain and US are the main destinations of Colombian immigrants. Hence, as an indicator of economic conditions in the main host countries of Colombian immigrants, we consider the unemployment rate of these two countries. Given that remittances receipt refers to the last 12 months, we construct for any period t (month-year) the average unemployment rate in the
last 12 months (including the current month).12
4. Empirical strategy
Our first goal is to identify the causal effect of economic conditions of countries which are the main destinations of Colombian immigrants on the probability of Colombian household’s receiving remittances (and the total amount) in areas with high and moderate migration tradition relative to cities with very low migration. The second goal is to identify the causal effect of foreign
11 This variable is intended to capture particular conditions of the segment of labor market in which the individual is
focused. It is computed as the relation between people looking for a job and the working population within each age range.
12 We did all our estimations constructing this average excluding current month. Results are not shown here but are
countries economic conditions on individual labor force participation decisions. Finally, given that during an important fraction of the sample period the economic conditions of the main Colombian migrants host countries worsen, we also explore an additional channel through which foreign economic conditions may affect local labor markets; this is, the return of Colombian immigrants.
One of the difficulties that entails the verification of the hypothesis that remittances affects the reservation wage of recipients and, hence, affects labor force participation decisions, is that remittances are potentially an endogenous variable. That is, household receiving remittances may differ with those who do not receive in unobservable characteristics, which could be also correlated with labor force participation decisions.
In order to identify the effects of interest and overcome the endogeneity problems, we implement a differences-in-differences (DD) approach which relies on the following two sources of variation. First, we exploit regional heterogeneity in the proportion of households at the municipality level who have family members living abroad (see Table 1). This regional variation allows us to construct treatment and control groups. Treated individuals are those residingin Colombian municipalities with high and moderately-high migration rates, which are more likely to be exposed and affected by the changing economic conditions of immigrants’ host countries. In our baseline specification treated individuals are those living in municipalities with more than 5% of the households with at least one family member living in either Spain or US. We divide these cities in two groups: Treatment H (municipalities with high emigration rates in Group 1, Dosquebradas, Pereira and La Virginia), and Treatment M (municipalities with emigration rates moderately-high in Group 2, Cali, Envigado and Yumbo). The control group is the one of municipalities with very low emigration rates (Group 4), which is less likely to be affected by the changing economic conditions in foreign countries. In our baseline specification, individuals in the control group are those residing in municipalities those with less than 2% of the households with at least one family member living in Spain or the United States.13
The second source of variation we exploit is the notable change of the economic conditions that occurred in Colombian immigrants host countries in the period 2006-2011. The worsening economic conditions in the US and mainly in Spain, which we argue were not completely expected, allow us to analyze the changes through time in outcomes of interest of treated individuals relative to control individuals. We use either the Spanish unemployment rate or US unemployment rate to proxy the economic conditions of these countries. In the time period analyzed these two measures are highly correlated. Hence, we do not attempt to disentangle which part of the effects are explained either by the changing economic conditions of the US or Spain.
Let indicate whether household i received remittances in the twelve months prior to time t
(or the total amount of remittances received). Our model specification is:
13 Municipalities with an intermediate proportion of households with at least one family member living in Spain or US
= + × + × + + + ′ + , (1)
where ! , for
j={H, M}, indicates whether household i lives in a municipality with high or
moderately-high migration rates; is the average unemployment rate in either Spain or US in the 12 months prior to period t;14 are municipality of residence fixed effects; are period
(year-month) fixed effects; and ′ is a vector of household head’s individual characteristics, other household characteristics and aggregated regional characteristics.
Time fixed effects ( ) in equation (1) allow us to control for common time trends in control and treatment groups, while municipality fixed effects ( ) capture time-invariant differences across Colombian municipalities. The parameters of interest in specification (1) are and which capture any difference in remittances received between the treatment and control municipalities whenever the economic conditions in Colombian immigrant host countries worsen.15
To explore whether the worsening economic conditions in the foreign countries are inducing immigrants to return to their origin municipalities in Colombia, we estimate equation (1) using as an outcome variable the household size. This variable is used instead of others that indicate whether the individual have migrated recently because, unfortunately, this information is not available from the survey.
If remittances receipt discourages participation in the labor market of Colombian household members through its income effects, we should observe that individuals in the treatment regions are more likely to participate in the labor force --relative to individuals in control regions--
whenever Colombian immigrant hosting countries are undergoing bad times, since immigrants would be less likely to send remittances to their relatives in Colombia. In addition, if the worsening economic conditions are forcing immigrants to go back to Colombia, we may observe the same phenomenon. Let now be the labor participation decision of individual i in time t. It
takes the value of 1 if the individual participates in the labor market and zero otherwise. The model specification is the same as equation (1), but considering individual level decisions:
= + × + × + + + ′ + , (2)
where ! , for
j={H, M}, indicates whether individual i lives in a municipality of high or
moderately-high migration rates; is the average unemployment rate in Spain or US in the 12 months prior to period t; are municipality of residence fixed effects; are period
(year-month) fixed effects; and ′ is a vector of individual characteristics, household characteristics and aggregated regional characteristics.
14 Due to collinearity between these two unemployment rates, they are not used simultaneously in any specification.
15 The
A potential concern with specification (2) is that we are assuming that there is no other shock in treatment areas, different to changes in economic conditions of Colombian immigrant host countries, which simultaneously affects the labor force participation decisions. This assumption would be violated if, for instance, there are region-specific trends which are not captured through the time-invariant municipality fixed effects. To mitigate this potential problem, we specifically include as a control variable the gross regional domestic product growth.
5. Results
Remittances receipt
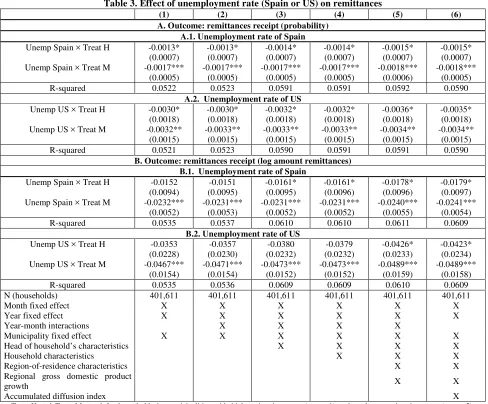
Table 3 reports the OLS estimates of specification (1) where the outcome variable is either a dummy variable that equals one if the household received remittances in the last 12 months and zero otherwise (panel A), or the log of the total amount of remittances received during that period (panel B). All the coefficients reported in the table are the estimates of the parameters ′" which capture any difference between the treatment and control groups in the remittances received whenever the economic conditions in Colombian immigrant host countries worsen. Each column reports the same estimate including a different set of control variables. As an indicator of economic conditions in the main host countries of Colombian immigrants, we consider the unemployment rate of these two countries. Given that remittances receipt refers to the last 12 months, we construct for any period t (month-year) the average unemployment rate in the last 12
months (including current month).
Columns 1 and 2 of Table 3 do not include any individual, household or region control variables. Subsequent columns add household head's individual characteristics (Column 3), other household characteristics (Column 4) and aggregate regional characteristics (Column 5). In Column 6 we consider an alternative measure of local macroeconomic conditions, measured by the Accumulated Diffusion Index.
Results in the first row of panel A.1 of Table 3 indicate that a 1 percentage point increase in the Spanish unemployment rate reduces the probability of receiving remittances in municipalities with high emigration rate (Treat H) by 0.13-0.15 percentage points, relative to control municipalities.. For the municipalities with moderate emigration rates (Treat M), a 1 percentage point increase in the Spanish unemployment rate decreases the probability of receiving remittances in the municipalities by 0.17-0.18 percentage points relative to control municipalities. The pattern observed in panel A.2, where we proxy economic conditions in US using the unemployment rate of that country, are similar to panel A.1, although the magnitude of the coefficients are higher.16
16 We performed the regressions at the individual level using as outcome a variable that equals one if the individual
In the case of the amount of remittances received, the results in the first row of panel B.1 indicate that a 1 percentage point increase in the Spanish unemployment rate reduces the amount of remittances received by the households in municipalities with high emigration rates (Treat H) by 0.15% to 0.18%.. For the municipalities with moderately high emigration rates (Treat M), a 1 percentage point increase in the Spanish unemployment rate reduces the amount of remittances received by 0.23% to 0.24%. In all specifications the estimated effects more than double when considering the US unemployment rate, but the pattern is the same.
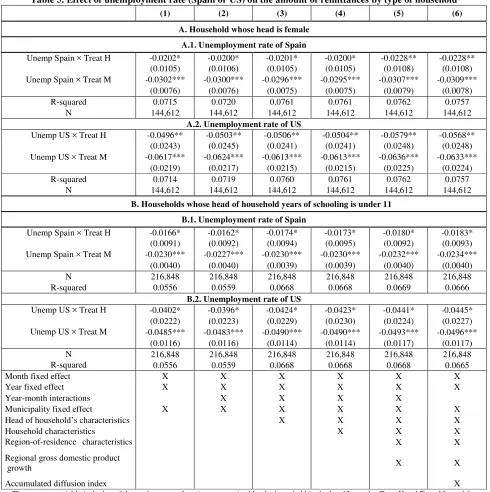
We also test the presence of heterogeneous effects by the gender of the head of the household and by education level. Taking into account these heterogeneous effects may be important given that according to census data, households with emigrated relatives tend to have heads of household with lower educational attainment. Additionally, according to survey data, households that receive remittances are more likely to have a female as the head of the household. Table 4 and 5 show the heterogeneous effects on the probability of receiving remittances and the amount of remittances. As expected, we find that female-headed households and household with less educated heads (11 years of education or less) are slightly more likely to be affected than the average household.
Household size
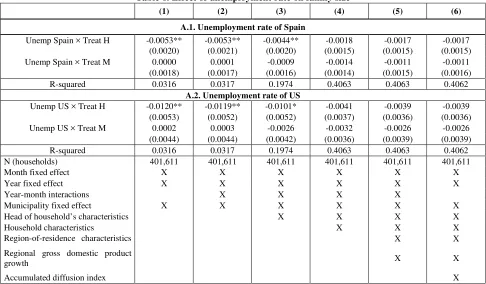
Table 6 shows the OLS estimates of equation (1) using the family size (number of household members) as the outcome variable. If emigrated individuals are returning to Colombia, then, the family composition and, in particular, the family size of households residing in treatment municipalities may be changing relative to control municipalities. However, results in the table indicate that there is no effect on family size.
Individual labor force participation
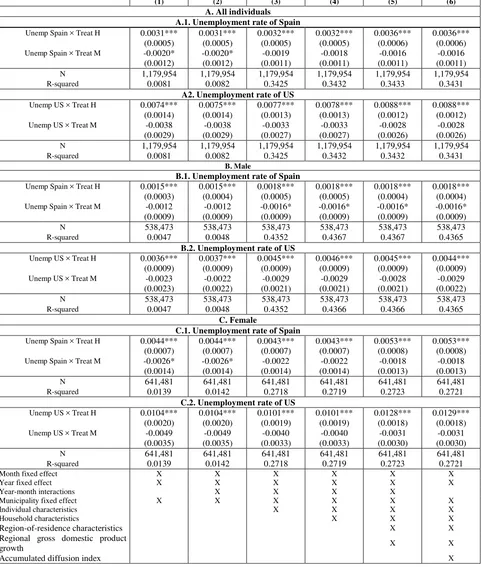
Table 7 shows the OLS estimates of equation (2). Panel A presents the results for all individuals in the sample. The estimates suggest that the probability that an individual has a job or looks for one increases with the unemployment rate of Spain in the treatment group with high emigration rates, relative to the control group. Specifically, a 1 percentage point increase in unemployment rate increases the probability of participating in the labor market by 0.31-0.36 percentage points, and the results is statistically significant for all specifications. This result holds when we use the US unemployment rate, although the magnitude doubles. However, unemployment rate of foreign countries do not have any effect on the labor force participation decisions of individuals residing in municipalities with moderate emigration rates, despite the presence of remittances effects.
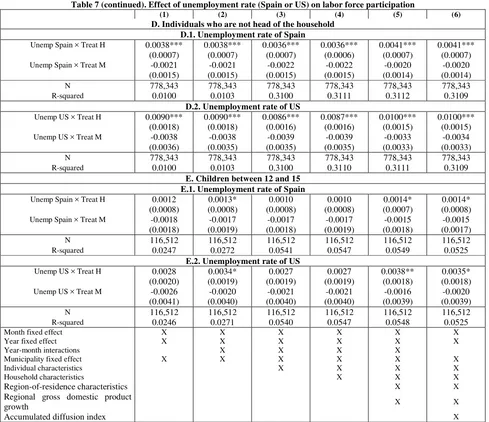
force participation to changes in foreign countries economic conditions is that remittances have a stronger effect on the labor force participation decisions of secondary workers of the household. Panel D of Table 7 explores directly this by considering the subsample of individuals who are not head of the household. For all specifications the estimated coefficients for treatment H are statistically significant and larger than the average (panel A).
Finally, we analyze whether changes in external economic conditions may affect the labor participation of children. Panel E of Table 7 shows the effects of unemployment in Spain and the US on the probability children between 12 and 15 years old participate in the labor market. Interestingly, we find positive effects on children’s labor force participation decisions. The magnitude is approximately half of the average effect on the whole population, but is it is still statistically significant in specifications with the broader set of controls.
6. Robustness analysis
This section presents evidence validating previous results through a series of robustness analysis.17
Placebo regressions
We re-estimate previous regressions keeping the same municipalities as control groups but replacing the treatment group by a placebo composed of individuals and households living in those municipalities that are left out of the baseline analysis (Group 3), i.e., municipalities with a low proportion of households (between 2 and 5%) with at least one family member living in Spain or US. Given the low proportion of household with emigrated relatives in these municipalities, we do not expect correlation neither between unemployment rate of foreign countries and remittances reception nor between unemployment rate of foreign countries and labor force participation. Results in Table 8 are consistent with this prediction. We do not find any effects on remittances nor in labor force participation of the placebo treatment group.
Definition of control group
We check whether our results are robust to the definition of the control group. We re-define the control group as: i) those municipalities with a proportion of households with at least one family member living in Spain or US below 3%; ii) those municipalities with a proportion of household with at least one family member living in Spain or US below 5%. In both cases, the results remain quantitatively the same.18
Shortening time period of analysis
Our empirical strategy relies on the assumption that the increase in unemployment rates in the principal host countries of Colombian immigrants was unexpected for Colombian households.
17 Some of the results of this section are not reported but are available upon request.
This assumption could be more plausible during the first years of the Spanish and US crises. Hence, to analyze the sensitivity of our results to the time window of analysis, we drop the year 2011 from the regressions. Again, all the results remain quantitatively similar.19
Subsample of individuals that do not receive remittances
Finally, we restrict the analysis to those individuals in control and treatment groups in households where no family member received remittances in the 12 months prior to the interview. This is an imperfect proxy of those individuals that do not have family members living abroad and, hence, are less likely to be exposed and affected by the changes of external economic conditions. Despite its limitations, we expect the effects of unemployment rates of Spain or US on labor force participation decisions to be lower for this subgroup compared to those we report in Table 7, where we include all individuals irrespective of whether they report receiving remittances or not.
Table 9 shows that, indeed, for all the subsamples analyzed (Panels A to E) the effects of unemployment rate are lower than those in Table 7. Still, the coefficients are statistically significant for the group of high emigration tradition. This is still possible since many of the individuals in this group may not receive remittances in the last 12 months just because of the worse external economic conditions that reduced the flow of remittances and, in turn, affected their labor participation decisions.
7. Conclusions
We use household information from surveys between 2006 and 2011 to test the hypothesis that income effects transmitted by non-labor income, remittances more precisely, sent from Spain and US, affect the Colombian labor market. Specifically, there is a differential effect in areas with the highest emigration rates.
Given the potential endogeneity of remittances receipt, we use a two-step approach within a diff-in-diff framework to identify the effects of interest. In the first step, we test the hypothesis that business cycle in the host countries of Colombian emigrants, measured by the unemployment rate of Spain and US affects the probability of receiving remittances but also the amount of them in the municipalities with high and moderate emigration rates relatively to municipalities with very low migration rates. In the second step, we test the hypothesis that economic conditions in Spain and US affect the participation of non-migrants in the labor market. The hypothesis holds only for municipalities with high emigration rates. In the interim we also checked whether the size of families has change due to the reversal of fortune of the host countries.
This indirect way of testing the link between labor markets (Spain and US with cities of hogh and moderate emigration rates) gives support to the statements of economic and political authorities specially in cities of high emigration rates (Pereira, Dosquebradas and La Virginia)
about the changes in the flow of remittances as the explanation for the dynamics of local labor markets. In one phrase, some cities in Colombia echoed the crises in Spain and US through the labor market being the income effect of the remittances the transmission mechanism.
References
Acosta, P. "Labor supply, school attendance, and remittances from international migration: the case of El Salvador", Policy Research Working Paper Series, núm. 3903, The World Bank, 2006.
Acosta, P.; Fajnzylber, P.; Lopez, H. “How Important are Remittances in Latin America?”, In Fajnzylber y H. Lopez (eds.) Remittances and Development: Lessons from Latin America,
Washington D. C., World Bank, 2008.
Alfonso, V.A.; L.E. Arango; F. Arias; and J.D. Pulido, “Ciclos económicos en Colombia”, Lecturas de Economía, 78, enero-junio, 115-149, 2013.
AMCO, “Identificación Puntos Críticos del Desempleo”, Alcaldía de Pereira, Consultor: Torres,
J.O., 2010.
Amuedo-Dorantes, C.; Georges, A.; Pozo, Z, “Migration, Remittances, and Children’s Schooling in Haiti”, The Annals of the American Academy, vol. 630, pp 224-244, The American Academy of
Political and Social Science, 2010.
Amuedo-Dorantes, C.; Pozo S., “Accounting for Remittance and Migration Effects on Children’s Schooling”, World Development Vol. 38, No. 12, pp. 1747-1759, 2010.
Amuedo-Dorantes, C.; Pozo S., “Remittances and insurance: evidence from Mexican immigrants”,
Journal of Population Economics, 19, 2, 227-254, 2006.
Arango, L.; Montenegro, P.; Obando, N. “El desempleo en Pereira: ¿solo cuestión de remesas?” L. Arango y F. Hammann (eds.) In El mercado de trabajo en Colombia: hechos, tendencias e instituciones, Banco de la República, Colombia, 2013.
Bargain, O.; Boutin, D., “Remittances and Child Labour in Africa: Evidence from Burkina Faso” IZA Discussion Paper No. 8007, Forschungsinstitut zur Zukunft der Arbeit, 2014.
Bedi, A.; Calero, C.; Sparrow, R., “Remmitances, Liquidity Constraints and Human Capital Investament in Ecuador” World Development Vol. 37, No. 6, pp. 1143-1154, 2009.
Borjas, G., Labor Economics, 2nd edition, MacGraw Hill, 2000.
Bussolo, M.; Medvedev, D. “Do Remittances Have a Flip Side? A General Equilibrium Analysis of Remittances, Labor Supply Responses, and Policy Options for Jamaica” World Bank Policy Research Working Paper 4143, World Bank, 2007.
Cadena, X.; Cárdenas, M., “Las remesas en Colombia: costos de transacción y lavado de dinero”, Fedesarrollo, Documentos de Trabajo, No. 26, 2004.
Cardenas, M.; Medina, C.; Trejos, A., “Measuring Economic and Social Impacts of Migration in Colombia: New evidence” Borradores de Economia, No. 601, Banco de la Republica. 2010.
Cardona, L.; Medina, C., “Migration as a Safety Net and Effects of Remittances on Household Consumption: The Case of Colombia” Borradores de Economia, No. 414, Banco de la República.
Castillo, C.M., “Determinantes de la probabilidad de estar desempleado en el Área Metropolitana de Cali: evidencias micro y macroeconómicas en el período 1988 – 1998, Universidad del Valle”,
Documentos de investigación, Universidad del Valle, 2000.
Cox, A.; Ureta, M. “International Migration, Remittances, and Schooling: Evidences from El Salvador” NBER Working Paper 9766, National Bureau of Economic Research, 2003.
Cox-Edwards, A.; Rodriguez-Oreggia, E.; “Remittances and Labor Force Participation in Mexico: An Analysis Using Propensity Score Matching”, World Development, Vol. 37, núm. 5, pp.
1004-1014, 2009.
Econometría S.A., “Análisis de la población y el mercado laboral en Santa Fe de Bogotá D.C. 1998”, Departamento Administrativo de Planeación Distrital, 1998.
Fajnzylber, P.; López, J.H., “El impacto de las remesas en el desarrollo de América Latina”, in Fajnzylber P. y J.H. López (eds.), Remittances and Development, Lessons from America Latina,
World Bank, 2008.
Fajnzylber, P.; Maloney, W. “How comparable are labor demand elasticities across countries?”
Police Research Working Papers, núm 2658, The World Bank, 2001.
Funkhouser, E. “Remittances from International Migration: A comparision of El Salvador and Nicaragua” The review of Economics and Statistics, pp. 137-146, 1995.
Funkhouser, E. “Migration from Nicaragua: some recent evidence”, World development, Vol. 20,
núm. 8, pp. 1209-1218, 1992.
Garay, L.; Rodriguez, A. “Características socioeconómicas de la población”, en Memorias del seminario “Migración internacional, el impacto y las tendencias de las remesas en Colombia”,
Ministerio de Relaciones Exteriores, 2005.
Hanson, G. “Emigration, Remittances and Labor Force Participation in Mexico”, Working Paper, núm. 28, Inter-American Development Bank, 2007.
Jadotte E. “Labor Supply Response to International Migration and Remittances in the Republic of Haiti”, Universidad Autònoma de Barcelona, 2009.
Kim, N. “The Impact of Remittances on Labor Supply: The Case of Jamaica”, World Bank Policy Research Working Paper, num. 4120, The World Bank, 2007.
Medina, C.; Posso, C.M., “Colombian and South American Immigrants in the United States of America: Education Levels, Job Qualifications and the Decision to Go Back Home”, Borradores de Economía, 572, Banco de la República, 2009.
Mora, J., “Gender differences between Remittances and Labor Participation in Developing Countries: A cross-section Analysis of Colombia in year 2008”, Applied Econometrics and International Development Vol. 13-1, pp. 99-112, 2013.
Organización Internacional para las Migraciones, Memorias del Seminario Migración Internacional, el Impacto y las Tendencias de las Remesas en Colombia, Primera Edición,
Colombia, 2005.
Tables
Table 3. Effect of unemployment rate (Spain or US) on remittances
(1) (2) (3) (4) (5) (6) A. Outcome: remittances receipt (probability)
A.1. Unemployment rate of Spain
Unemp Spain × Treat H -0.0013* -0.0013* -0.0014* -0.0014* -0.0015* -0.0015*
(0.0007) (0.0007) (0.0007) (0.0007) (0.0007) (0.0007)
Unemp Spain × Treat M -0.0017*** -0.0017*** -0.0017*** -0.0017*** -0.0018*** -0.0018***
(0.0005) (0.0005) (0.0005) (0.0005) (0.0006) (0.0005)
R-squared 0.0522 0.0523 0.0591 0.0591 0.0592 0.0590
A.2. Unemployment rate of US
Unemp US × Treat H -0.0030* -0.0030* -0.0032* -0.0032* -0.0036* -0.0035*
(0.0018) (0.0018) (0.0018) (0.0018) (0.0018) (0.0018)
Unemp US × Treat M -0.0032** -0.0033** -0.0033** -0.0033** -0.0034** -0.0034**
(0.0015) (0.0015) (0.0015) (0.0015) (0.0015) (0.0015)
R-squared 0.0521 0.0523 0.0590 0.0591 0.0591 0.0590
B. Outcome: remittances receipt (log amount remittances) B.1. Unemployment rate of Spain
Unemp Spain × Treat H -0.0152 -0.0151 -0.0161* -0.0161* -0.0178* -0.0179*
(0.0094) (0.0095) (0.0095) (0.0096) (0.0096) (0.0097)
Unemp Spain × Treat M -0.0232*** -0.0231*** -0.0231*** -0.0231*** -0.0240*** -0.0241***
(0.0052) (0.0053) (0.0052) (0.0052) (0.0055) (0.0054)
R-squared 0.0535 0.0537 0.0610 0.0610 0.0611 0.0609
B.2. Unemployment rate of US
Unemp US × Treat H -0.0353 -0.0357 -0.0380 -0.0379 -0.0426* -0.0423*
(0.0228) (0.0230) (0.0232) (0.0232) (0.0233) (0.0234)
Unemp US × Treat M -0.0467*** -0.0471*** -0.0473*** -0.0473*** -0.0489*** -0.0489***
(0.0154) (0.0154) (0.0152) (0.0152) (0.0159) (0.0158)
R-squared 0.0535 0.0536 0.0609 0.0609 0.0610 0.0609
N (households) 401,611 401,611 401,611 401,611 401,611 401,611
Month fixed effect X X X X X X
Year fixed effect X X X X X X
Year-month interactions X X X X
Municipality fixed effect X X X X X X
Head of household’s characteristics X X X X
Household characteristics X X X
Region-of-residence characteristics X X
Regional gross domestic product
growth X X
Accumulated diffusion index X
Treat H and Treat M stand for households in municipalities with high emigration rates (group 1) and moderate emigration rates (group 2), respectively. Unemployment rate is the average unemployment rate in the last 12 months, including the current month and takes values between 0
and 100. The coefficients on × !, for j=H, M, are the estimated parameters
! of equation (1) which are the DD estimate (OLS) of the
Table 4. Effect of unemployment rate (Spain or US) on the probability of receiving remittances by type of household
(1) (2) (3) (4) (5) (6) A. Households whose head is female
A.1. Unemployment rate of Spain
Unemp Spain × Treat H -0.0016* -0.0016* -0.0016* -0.0016* -0.0018** -0.0018**
(0.0008) (0.0008) (0.0008) (0.0008) (0.0009) (0.0008)
Unemp Spain × Treat M -0.0021*** -0.0021*** -0.0020*** -0.0020*** -0.0021*** -0.0021***
(0.0007) (0.0007) (0.0007) (0.0007) (0.0008) (0.0008)
R-squared 0.0696 0.0701 0.0737 0.0738 0.0739 0.0734
N 144,612 144,612 144,612 144,612 144,612 144,612
A.2. Unemployment rate of US
Unemp US × Treat H -0.0040** -0.0041** -0.0041** -0.0041** -0.0047** -0.0046**
(0.0019) (0.0019) (0.0018) (0.0018) (0.0019) (0.0019)
Unemp US × Treat M -0.0040* -0.0040* -0.0040* -0.0039* -0.0041* -0.0041*
(0.0021) (0.0021) (0.0021) (0.0021) (0.0021) (0.0021)
R-squared 0.0695 0.0700 0.0737 0.0738 0.0738 0.0734
N 144,612 144,612 144,612 144,612 144,612 144,612
B. Households whose head of household years of schooling is under 11 B.1. Unemployment rate of Spain
Unemp Spain × Treat H -0.0015** -0.0014* -0.0015** -0.0015** -0.0016** -0.0016**
(0.0007) (0.0007) (0.0007) (0.0007) (0.0007) (0.0007)
Unemp Spain × Treat M -0.0017*** -0.0017*** -0.0017*** -0.0017*** -0.0017*** -0.0017***
(0.0004) (0.0004) (0.0004) (0.0004) (0.0004) (0.0004)
R-squared 0.0534 0.0537 0.0639 0.0640 0.0640 0.0637
N 216,848 216,848 216,848 216,848 216,848 216,848
B.2. Unemployment rate of US
Unemp US × Treat H -0.0035** -0.0035** -0.0037** -0.0037** -0.0038** -0.0038**
(0.0017) (0.0018) (0.0018) (0.0018) (0.0018) (0.0018)
Unemp US × Treat M -0.0035*** -0.0035*** -0.0035*** -0.0035*** -0.0035*** -0.0035***
(0.0011) (0.0011) (0.0011) (0.0011) (0.0011) (0.0011)
R-squared 0.0534 0.0537 0.0639 0.0639 0.0639 0.0636
N 216,848 216,848 216,848 216,848 216,848 216,848
Month fixed effect X X X X X X
Year fixed effect X X X X X X
Year-month interactions X X X X
Municipality fixed effect X X X X X X
Head of household’s characteristics X X X X
Household characteristics X X X
Region-of-residence characteristics
characteristics X X
Regional gross domestic product
growth X X
Accumulated diffusion index X
The outcome variable is a dummy variable that takes the value 1 if the household received remittances in the last 12 months. Treat H and Treat M stand for households in municipalities with high emigration rates and moderate emigration rates, respectively. Unemployment rate is the average
unemployment rate in the last 12 months, including the current month. The coefficients on × !, for j=H, M, are the estimated
parameters ! of equation (1) which are the DD estimate (OLS) of the effect of unemployment rate of the foreign country on the household’s
Table 5. Effect of unemployment rate (Spain or US) on the amount of remittances by type of household
(1) (2) (3) (4) (5) (6) A. Household whose head is female
A.1. Unemployment rate of Spain
Unemp Spain × Treat H -0.0202* -0.0200* -0.0201* -0.0200* -0.0228** -0.0228**
(0.0105) (0.0106) (0.0105) (0.0105) (0.0108) (0.0108)
Unemp Spain × Treat M -0.0302*** -0.0300*** -0.0296*** -0.0295*** -0.0307*** -0.0309***
(0.0076) (0.0076) (0.0075) (0.0075) (0.0079) (0.0078)
R-squared 0.0715 0.0720 0.0761 0.0761 0.0762 0.0757
N 144,612 144,612 144,612 144,612 144,612 144,612
A.2. Unemployment rate of US
Unemp US × Treat H -0.0496** -0.0503** -0.0506** -0.0504** -0.0579** -0.0568**
(0.0243) (0.0245) (0.0241) (0.0241) (0.0248) (0.0248)
Unemp US × Treat M -0.0617*** -0.0624*** -0.0613*** -0.0613*** -0.0636*** -0.0633***
(0.0219) (0.0217) (0.0215) (0.0215) (0.0225) (0.0224)
R-squared 0.0714 0.0719 0.0760 0.0761 0.0762 0.0757
N 144,612 144,612 144,612 144,612 144,612 144,612
B. Households whose head of household years of schooling is under 11 B.1. Unemployment rate of Spain
Unemp Spain × Treat H -0.0166* -0.0162* -0.0174* -0.0173* -0.0180* -0.0183*
(0.0091) (0.0092) (0.0094) (0.0095) (0.0092) (0.0093)
Unemp Spain × Treat M -0.0230*** -0.0227*** -0.0230*** -0.0230*** -0.0232*** -0.0234***
(0.0040) (0.0040) (0.0039) (0.0039) (0.0040) (0.0040)
N 216,848 216,848 216,848 216,848 216,848 216,848
R-squared 0.0556 0.0559 0.0668 0.0668 0.0669 0.0666
B.2. Unemployment rate of US
Unemp US × Treat H -0.0402* -0.0396* -0.0424* -0.0423* -0.0441* -0.0445*
(0.0222) (0.0223) (0.0229) (0.0230) (0.0224) (0.0227)
Unemp US × Treat M -0.0485*** -0.0483*** -0.0490*** -0.0490*** -0.0493*** -0.0496***
(0.0116) (0.0116) (0.0114) (0.0114) (0.0117) (0.0117)
N 216,848 216,848 216,848 216,848 216,848 216,848
R-squared 0.0556 0.0559 0.0668 0.0668 0.0668 0.0665
Month fixed effect X X X X X X
Year fixed effect X X X X X X
Year-month interactions X X X X
Municipality fixed effect X X X X X X
Head of household’s characteristics X X X X
Household characteristics X X X
Region-of-residence characteristics
characteristics X X
Regional gross domestic product
growth X X
Accumulated diffusion index X
The outcome variable is the log of the total amount of remittances received by the household in the last 12 months. Treat H and Treat M stand for households in municipalities with high emigration rates and moderate emigration rates, respectively. Unemployment rate is the average
unemployment rate in the last 12 months, including the current month. The coefficients on × !, for j=H, M, are the estimated
parameters ! of equation (1) which are the DD estimate (OLS) of the effect of unemployment rate of the foreign country on the household’s
Table 6. Effect of unemployment rate on family size
(1) (2) (3) (4) (5) (6) A.1. Unemployment rate of Spain
Unemp Spain × Treat H -0.0053** -0.0053** -0.0044** -0.0018 -0.0017 -0.0017
(0.0020) (0.0021) (0.0020) (0.0015) (0.0015) (0.0015)
Unemp Spain × Treat M 0.0000 0.0001 -0.0009 -0.0014 -0.0011 -0.0011
(0.0018) (0.0017) (0.0016) (0.0014) (0.0015) (0.0016)
R-squared 0.0316 0.0317 0.1974 0.4063 0.4063 0.4062
A.2. Unemployment rate of US
Unemp US × Treat H -0.0120** -0.0119** -0.0101* -0.0041 -0.0039 -0.0039
(0.0053) (0.0052) (0.0052) (0.0037) (0.0036) (0.0036)
Unemp US × Treat M 0.0002 0.0003 -0.0026 -0.0032 -0.0026 -0.0026
(0.0044) (0.0044) (0.0042) (0.0036) (0.0039) (0.0039)
R-squared 0.0316 0.0317 0.1974 0.4063 0.4063 0.4062
N (households) 401,611 401,611 401,611 401,611 401,611 401,611
Month fixed effect X X X X X X
Year fixed effect X X X X X X
Year-month interactions X X X X
Municipality fixed effect X X X X X X
Head of household’s characteristics X X X X
Household characteristics X X X
Region-of-residence characteristics
characteristics X X
Regional gross domestic product
growth X X
Accumulated diffusion index X
The outcome variable is the number of household members. Treat H and Treat M stand for households in municipalities with high emigration rates and moderate emigration rates, respectively. Unemployment rate is the average unemployment rate in the last 12 months, including the current
month. The coefficients on × !, for j=H, M, are the estimated parameters
! of equation (1) which are the DD estimate (OLS) of the
Table 7. Effect of unemployment rate (Spain or US) on labor force participation
(1) (2) (3) (4) (5) (6)
A. All individuals A.1. Unemployment rate of Spain
Unemp Spain × Treat H 0.0031*** 0.0031*** 0.0032*** 0.0032*** 0.0036*** 0.0036***
(0.0005) (0.0005) (0.0005) (0.0005) (0.0006) (0.0006)
Unemp Spain × Treat M -0.0020* -0.0020* -0.0019 -0.0018 -0.0016 -0.0016
(0.0012) (0.0012) (0.0011) (0.0011) (0.0011) (0.0011)
N 1,179,954 1,179,954 1,179,954 1,179,954 1,179,954 1,179,954
R-squared 0.0081 0.0082 0.3425 0.3432 0.3433 0.3431
A2. Unemployment rate of US
Unemp US × Treat H 0.0074*** 0.0075*** 0.0077*** 0.0078*** 0.0088*** 0.0088***
(0.0014) (0.0014) (0.0013) (0.0013) (0.0012) (0.0012)
Unemp US × Treat M -0.0038 -0.0038 -0.0033 -0.0033 -0.0028 -0.0028
(0.0029) (0.0029) (0.0027) (0.0027) (0.0026) (0.0026)
N 1,179,954 1,179,954 1,179,954 1,179,954 1,179,954 1,179,954
R-squared 0.0081 0.0082 0.3425 0.3432 0.3432 0.3431
B. Male
B.1. Unemployment rate of Spain
Unemp Spain × Treat H 0.0015*** 0.0015*** 0.0018*** 0.0018*** 0.0018*** 0.0018***
(0.0003) (0.0004) (0.0005) (0.0005) (0.0004) (0.0004)
Unemp Spain × Treat M -0.0012 -0.0012 -0.0016* -0.0016* -0.0016* -0.0016*
(0.0009) (0.0009) (0.0009) (0.0009) (0.0009) (0.0009)
N 538,473 538,473 538,473 538,473 538,473 538,473
R-squared 0.0047 0.0048 0.4352 0.4367 0.4367 0.4365
B.2. Unemployment rate of US
Unemp US × Treat H 0.0036*** 0.0037*** 0.0045*** 0.0046*** 0.0045*** 0.0044***
(0.0009) (0.0009) (0.0009) (0.0009) (0.0009) (0.0009)
Unemp US × Treat M -0.0023 -0.0022 -0.0029 -0.0029 -0.0028 -0.0029
(0.0023) (0.0022) (0.0021) (0.0021) (0.0021) (0.0022)
N 538,473 538,473 538,473 538,473 538,473 538,473
R-squared 0.0047 0.0048 0.4352 0.4366 0.4366 0.4365
C. Female
C.1. Unemployment rate of Spain
Unemp Spain × Treat H 0.0044*** 0.0044*** 0.0043*** 0.0043*** 0.0053*** 0.0053***
(0.0007) (0.0007) (0.0007) (0.0007) (0.0008) (0.0008)
Unemp Spain × Treat M -0.0026* -0.0026* -0.0022 -0.0022 -0.0018 -0.0018
(0.0014) (0.0014) (0.0014) (0.0014) (0.0013) (0.0013)
N 641,481 641,481 641,481 641,481 641,481 641,481
R-squared 0.0139 0.0142 0.2718 0.2719 0.2723 0.2721
C.2. Unemployment rate of US
Unemp US × Treat H 0.0104*** 0.0104*** 0.0101*** 0.0101*** 0.0128*** 0.0129***
(0.0020) (0.0020) (0.0019) (0.0019) (0.0018) (0.0018)
Unemp US × Treat M -0.0049 -0.0049 -0.0040 -0.0040 -0.0031 -0.0031
(0.0035) (0.0035) (0.0033) (0.0033) (0.0030) (0.0030)
N 641,481 641,481 641,481 641,481 641,481 641,481
R-squared 0.0139 0.0142 0.2718 0.2719 0.2723 0.2721
Month fixed effect X X X X X X
Year fixed effect X X X X X X
Year-month interactions X X X X
Municipality fixed effect X X X X X X
Individual characteristics X X X X
Household characteristics X X X
Region-of-residence characteristics X X
Regional gross domestic product
growth X X