Essays on the Informal Sector in Developing Countries: The Colombian Case
169
0
0
Texto completo
(2) Universitat Autònoma de Barcelona Departament d’Economia Aplicada. Essays on the Informal Sector in Developing Countries: The Colombian Case. Tesis para optar por el grado de Doctor en Economía. Autor: Gustavo Adolfo García Cruz. Director: Dr. José Luis Roig Sabaté. Doctorado en Economía Aplicada Departament d'Economia Aplicada Facultat d'Economia i Empresa Universitat Autonòma de Barcelona 2013.
(3)
(4) Agradecimientos En primer lugar, agradezco especialmente a mi director de tesis el profesor José Luis Roig por todo su apoyo y consejos durante todo el proceso de investigación. Su colaboración, conocimientos y sobre todo su confianza depositada en mí fueron fundamentales para el desarrollo de esta tesis. También agradezco de manera especial al profesor Josep Lluís Raymond por su apoyo. Su experiencia, conocimiento y agudeza analítica hacían de cada reunión una rica clase de economía y econometría.. Gracias al Departamento de Economía Aplicada de la UAB por estos años que me alojó y apoyó. A los profesores y compañeros del doctorado con los que compartí muchas experiencias tanto dentro como fuera de las aulas.. Gracias a Ana I. Moreno por las discusiones alrededor del tema del sector informal. Su perseverancia e intensidad en el trabajo es algo admirable.. Agradezco infinitamente el apoyo de toda mi familia que desde la distancia siempre me demostraron todo su cariño y apoyo. Gracias a mi mamá, a mi papá y a mis hermanos quienes siempre me motivaron. La distancia no fue un obstáculo para enviarme su cariño, ánimo y estar junto a mí en este proceso. A ellos dedico esta tesis. Gracias totales a Erika, mi amiga incondicional, novia y esposa, gracias por tu apoyo, por estar conmigo y animarme cuando lo necesitaba. Lo mejor de todo fue haber estado juntos.. Finalmente, agradezco la financiación de la Agència de Gestio d’Ajust Universitaris i de Recerca (AGAUR) y el apoyo brindado por la Universitat Autònoma de Barcelona.. i.
(5)
(6) Table of Contents. List of Tables ............................................................................................................. vii List of Figures ............................................................................................................ ix. Chapter 1. Introduction ............................................................................................. 1 1.1 Motivation.......................................................................................................... 1 1.2 Theoretical approaches on the informal sector .................................................. 3 1.3 Measuring informality ....................................................................................... 5 1.4 Structure of thesis .............................................................................................. 6 1.5 References ........................................................................................................ 10. Chapter 2. Rationing of Formal Sector Jobs and Informality ............................. 13 2.1 Introduction ...................................................................................................... 13 2.2 Econometric model .......................................................................................... 15 2.3 Estimation procedure and the test on the existence of the job queue .............. 19 2.3.1 Estimation ................................................................................................... 20 2.3.2 The existence and length of the formal job queue ...................................... 25 2.4 Data and descriptive evidence ......................................................................... 26 2.5 Results .............................................................................................................. 30 2.5.1 Univariate probit model: absence of a job queue ....................................... 30 2.5.2 Bivariate probit model reduced form: the existence of a queue for formal jobs ...................................................................................................................... 31 2.5.3 The formal and informal wage equations ................................................... 33 2.5.4 The existence and length of the formal job queue: results ......................... 35 2.5.5 Determinants of the decision of being a formal or informal worker: structural bivariate probit model ......................................................................... 37 2.6 Conclusions ...................................................................................................... 40 2.7 References ........................................................................................................ 42 Appendix ................................................................................................................ 45. iii.
(7) Chapter 3. Labor Informality: Choice or Sign of Segmentation? A Quantile Regression Approach at the Regional Level .......................................................... 47 3.1 Introduction ...................................................................................................... 47 3.2 Data and descriptive evidence ......................................................................... 50 3.2.1 Group of cities and their labor markets ...................................................... 53 3.3 Estimation procedure ....................................................................................... 63 3.4 Results .............................................................................................................. 67 3.4.1 SLS estimation and the quantile regression models ................................... 67 3.4.2 Decomposition results ................................................................................ 72 3.5 Conclusions ...................................................................................................... 76 3.6 References ........................................................................................................ 78 Appendix ................................................................................................................ 83. Chapter 4. Agglomeration Economies and Informality in Developing Countries ................................................................................................................... 93 4.1 Introduction ...................................................................................................... 93 4.2 Literature review .............................................................................................. 95 4.2.1 Agglomeration economies in developing countries ................................... 96 4.2.2 Theoretical predictions on the intra-metropolitan clustering of informal manufacturing activity ......................................................................................... 97 4.3 Intra-metropolitan clustering of formal and informal manufacturing activity ................................................................................................................... 98 4.3.1 Description of the study area and data ....................................................... 98 4.3.2 Spatial distribution of formal and informal enterprises ............................ 101 4.3.3 Spatial indicators of relative geographic clustering and co-clustering..... 102 4.3.3.1 M-functions clustering and co-clustering............................................ 104 4.3.3.1.1 Clustering ....................................................................................... 104 4.3.3.1.2 Co-clustering.................................................................................. 105 4.3.4 Spatial analysis ......................................................................................... 106 4.3.5 Results of M-functions ............................................................................. 107 4.3.5.1 Clustering ............................................................................................ 107 4.3.5.2 Co-clustering ....................................................................................... 112 4.3.6 Results of spatial analysis ......................................................................... 119 4.4 Agglomeration and formal and informal wages ............................................ 122 iv.
(8) 4.4.1 Description of the instruments ................................................................. 124 4.4.2 Instrument relevance and exogeneity ....................................................... 126 4.4.3 Estimation procedure ................................................................................ 127 4.4.4 Estimation results ..................................................................................... 129 4.5 Conclusions .................................................................................................... 132 4.6 References ...................................................................................................... 134 Appendix .............................................................................................................. 139. Chapter 5. Conclusions .......................................................................................... 147 5.1 Summary and the main results ....................................................................... 147 5.2 Policy implications ........................................................................................ 150 5.3 Future research lines ...................................................................................... 152 5.4 References ...................................................................................................... 155. v.
(9)
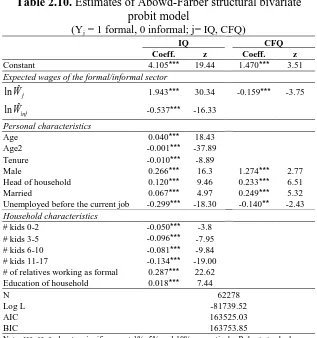
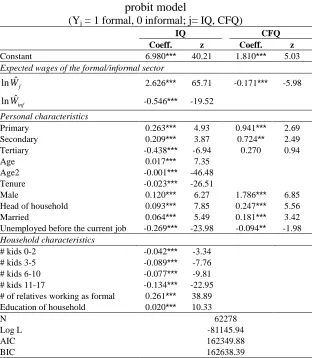
(10) List of Tables Table 2.1 Informality and unemployment in developing regions .............................. 14 Table 2.2 Personal and employment characteristics .................................................. 28 Table 2.3 Wages and Education................................................................................. 28 Table 2.4 Household characteristics .......................................................................... 29 Table 2.5 Estimates of univariate probit model ......................................................... 31 Table 2.6 Estimates of bivariate probit model reduced form..................................... 33 Table 2.7 Wage equations for formal and informal workers with correction for selectivity based on the bivariate probit models ......................................................... 34 Table 2.8 Test for universal queue and no queue hypothesis .................................... 35 Table 2.9 Probabilities and queue length from the Abowd-Farber (A-F) and Poirier bivariates models ........................................................................................................ 37 Table 2.10 Estimates of Abowd-Farber structural bivariate probit model ................ 39 Table A2.1 Estimates of Abowd-Farber structural bivariate probit model ............... 45 Table 3.1 Descriptive statistics .................................................................................. 51 Table 3.2 Descriptive statistics by groups of cities ................................................... 58 Table 3.3 Informal sector characteristics by modernity quartile ............................... 62 Table 3.4 Estimates of the informal employment models ......................................... 68 Table 3.5 Quantile regressions by group of cities...................................................... 71 Table A3.1 Informality rate by metropolitan area ..................................................... 83 Table A3.2 Sector characteristics by modernity quartile ........................................... 85 Table A3.3 Quantile regressions for the total sample with corrections for selectivity .................................................................................................................... 86 Table A3.4 Quantile regressions for City Group 1 with corrections for selectivity .. 87 Table A3.5 Quantile regressions for City Group 2 with corrections for selectivity .. 88 Table A3.6 Quantile regressions for City Group 3 with corrections for selectivity .. 89 Table A3.7 Quantile regressions for City Group 1 without corrections for selectivity .................................................................................................................... 90 Table A3.8 Decomposition results for the total sample............................................. 91 Table A3.9 Decomposition results by group of cities ............................................... 92 Table 4.1 Enterprise size distribution ...................................................................... 101 Table 4.2 Activity location ...................................................................................... 101 vii.
(11) Table 4.3 Intra-industry M-functions ....................................................................... 110 Table 4.4 Intra-industry M-functions by type of enterprise ..................................... 111 Table 4.5 Inter-industry concentration, selected industries ..................................... 114 Table 4.6 Inter-industry concentration by enterprise type, selected industries........ 115 Table 4.7 Results of the OLS estimates ................................................................... 118 Table 4.8 Forced Displacement by municipality of arrive in Colombia, 1998 – 2011 .......................................................................................................................... 126 Table 4.9 Urbanization elasticity ............................................................................. 130 Table A4.1 Size of the blocks (Manzanas) .............................................................. 140 Table A4.2 ISIC Revision 3, 3-digit level codes ..................................................... 140 Table A4.3 Number of enterprises and employees by sectors and type of enterprise .................................................................................................................. 141 Table A4.4 Descriptive statistics ............................................................................. 144 Table A4.5 Urbanization elasticity .......................................................................... 145. viii.
(12) List of Figures Figure 1.1 Percentage of informal employment in nonagricultural employment ........ 2 Figure 1.2 Share of informal economy in total GDP, 2007 ......................................... 2 Figure 3.1 Kernel density of log real hourly wage by formal and informal sector ... 52 Figure 3.2 Wage differentials between formal and informal sector over different quantiles of the wage distribution............................................................................... 53 Figure 3.3 Real Gross Domestic Product (GDP) per capita at departmental level, 2009 ............................................................................................................................ 55 Figure 3.4 Informality rate by city, 2009 ................................................................... 56 Figure 3.5 Percentage of Unsatisfied Basic Needs (UBN) by city ............................ 57 Figure 3.6 Distribution of informal employment across sectors ............................... 60 Figure 3.7 Informal sector employment by modernity quartile................................. 61 Figure 3.8 Wage differentials between the formal and informal sector over different quantiles of the wage distribution by group of cities.................................................. 63 Figure 3.9 Quantile decomposition of the wage gap between the formal sector and informal sector ............................................................................................................ 72 Figure A3.1 Wage differentials between formal and informal sector over different quantiles of the wage distribution by metropolitan area............................................. 84 Figure 4.1 Study Area ................................................................................................ 99 Figure 4.2 Concentration plant-based LQ index...................................................... 102 Figure 4.3 Intra-industry M-functions by type of enterprise ................................... 108 Figure 4.4 Intra-industry M-functions, selected industries ...................................... 112 Figure 4.5 Inter-industry M-functions by type of enterprise ................................... 113 Figure 4.6 Kernel density mapping, selected industries .......................................... 120 Figure 4.7 Spatial distribution of furniture and footwear enterprises ...................... 121 Figure 4.8 Spatial distribution of enterprises of the Apparel and Footwear industries................................................................................................................... 122 Figure A4.1 Population density by Communes, Cali-Yumbo ................................. 139 Figure A4.2 Distribution of income categories, Cali............................................... 139 Figure A4.3 Kernel density mapping of industries displaying significant clustering and co-clustering of formal small and informal enterprises ..................................... 142. ix.
(13) Figure A4.4 Kernel density mapping of industries displaying significant clustering formal small and informal enterprises but no co-clustering ..................................... 143. x.
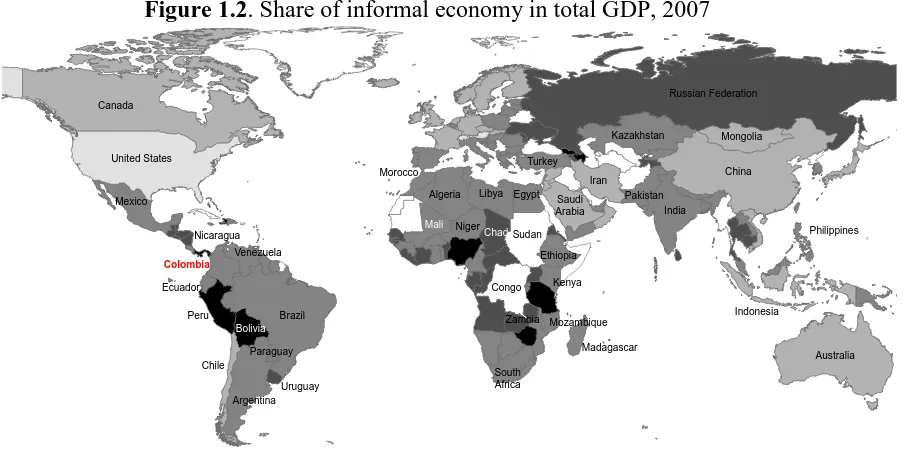
(14) Chapter 1. Introduction 1.1 Motivation A frequently observed feature of developing countries is the scarcity of employment opportunities and the poor quality of the jobs that are available, with the result that high levels of both unemployment and informality characterize today their labor markets. While considerable attention has been devoted to unemployment, given its obvious impact on economic growth and development, an extensive body of literature has shown that informality can likewise represent a major burden to growth and social well-being (see, e.g., Perry et al., 2007; Jütting and De Laiglesia, 2009). As Jütting et al. (2008) have pointed out, the creation of good quality jobs is a key element in transforming economic growth into a process that effectively reduces inequality and poverty. The three empirical studies that make up this thesis seek to analyze and characterize this informality and, more importantly, to study the inherent heterogeneity of this phenomenon in the developing country of Colombia.1 In developing countries the informal sector employs a significant share of the workforce and accounts for a sizable part of economic output (see Figures 1.1 and 1.2). According to Jütting and De Laiglesia’s (2009) estimates, over 55% of non-agricultural employment in developing countries is performed in activities not regulated or protected by the state (informal activities). In some countries of Sub-Saharan Africa and South Asia the proportion of informal workers can be higher than 80% (for example, Chad and India present informality rates of 95 and 83%, respectively). In Latin America the average informality rate stands at around 50%, with Honduras presenting the highest rate (76%), followed by Paraguay (70%), Peru (70%), Bolivia (69%) and Colombia (60%). As for the size of the informal economy measured as a percentage of GDP, Schneider et al. (2010) show that in Latin America in 2007 the shadow economy accounted for around 40% of GDP, while in Sub-Saharan Africa and South Asia it represented 39 and 30% respectively. Latin American and Sub-Saharan African. 1. More extensive research on the informal economies of other countries can be found in the ILO’s Informal Economy Resource Database, available at http://www.ilo.org/dyn/dwresources/iebrowse.home?p_lang=en..
(15) 2. Chapter 1. countries such as Bolivia, Peru and Zimbabwe head the rankings in this regard with percentages above 60%.. Figure 1.1. Percentage of informal employment in nonagricultural employment. Russian Federation Canada Kazakhstan United States. Mongolia. Turkey Morocco. Mali Nicaragua. Libya. Niger. Egypt. Pakistan. Saudi Arabia. India Philippines. Chad Sudan. Venezuela. Ethiopia. Colombia Ecuador. Kenya. Congo Brazil. Peru. China. Iran Algeria. Mexico. Indonesia. Zambia Mozambique. Bolivia. Madagascar. Paraguay Chile. Australia. South Africa. Uruguay Argentina. 9% - 25%. 26% - 40%. 41% - 50%. 50% - 60%. 61% - 70%. 71% - 93%. Note: Data for Latin American countries correspond to the year 2010 (see ILO, 2011). Data for remaining countries correspond to the period 2000-2007 (see Jütting and De Laiglesia, 2009).. Figure 1.2. Share of informal economy in total GDP, 2007. Russian Federation Canada Kazakhstan United States. Mongolia. Turkey Morocco. Mali Nicaragua. Libya. Niger. Egypt. Saudi Arabia. Pakistan India Philippines. Chad Sudan. Venezuela. Ethiopia. Colombia Ecuador. Congo Brazil. Peru. China. Iran Algeria. Mexico. Kenya Indonesia. Zambia Mozambique. Bolivia. Madagascar. Paraguay Chile. Australia. South Africa. Uruguay Argentina. 8% - 10%. 11% - 20%. 21% - 40%. 41% - 50%. 51% - 64%. NA. Source: Schneider et al. (2010).. As can be seen, therefore, the informal sector in developing countries is large and has a crucial role to play. Much of the informal sector is associated with subsistence activities where individuals undertake all kinds of work just to ensure their own survival and that of their families. Most of the individuals who fail to obtain formal employment.
(16) Introduction. 3. live in varying degrees of poverty and, because of the limited coverage and effectiveness of state social security systems, they must turn to the informal sector as their only alternative source of employment. The activities they encounter there are characterized by low wage, high levels of risk and vulnerability, and highly precarious conditions and, thus, persistence of informality means the perpetuation of poverty for a large segment of the population. From a social perspective, high levels of informality undermine the ability of the state to protect employees (ensuring appropriate working hours and wages, among others) and to collect taxes. As such, there are not guarantees of the equality of opportunity in the labor market, or of the efficient functioning of the social security system and of social well-being in general (Jütting and De Laiglesia, 2009). Furthermore, as mentioned above, informality can have particularly detrimental effects on a country’s economic growth, productivity and competitiveness. Informal firms are often small in scale and geographically dispersed making it easier for them to avoid detection. Additionally, they tend to be characterized by low-skilled, laborintensive, family-operated businesses, which encounter few problems of market entry and operate under very few legal restrictions but face notable capital restrictions. All in all, these factors constitute a considerable burden on the productivity of firms and, in general on their growth. As Perry et al. (2007) note for seven Latin American and Caribbean countries, and the McKinsey Global Institute (2003) for Turkey, the difference in labor productivity between firms that operate informally and formally can range between 30 and 40%. Hence, combating informality is an important policy concern for governments in their efforts to achieve sustained economic growth.. 1.2 Theoretical approaches on the informal sector The informal sector encompasses a considerable variety of heterogeneous activities, ranging from traditional, casual survival-type activities, such as street vendors, shoe shiners and garbage collectors, to more modern activities, where small firms use modern sector techniques of production and compete with formal small and medium firms. It is this diversity that makes it particularly difficult to measure and to characterize the sector and which, at the same time, has led to the multiplicity of definitions and measures of informality that capture quite distinct and opposing theoretical approaches. All in all, the literature advances two main theoretical views on.
(17) 4. Chapter 1. the informal sector: segmented labor market (or dualist) theory and the legalist or orthodox theory. In line the first theory, informality is a residual sector in which the labor force that cannot find employment in the more productive and remunerative formal sector is absorbed. As such, the informal sector is perceived as a survival alternative for those disadvantaged or rationed out of formal employment opportunities to escape involuntary unemployment (Lewis, 1954; Dickens and Lang, 1985). Furthermore, informality is a form of market failure as it prevents individuals and firms from moving to formal activities, and in the presence of this segmentation the rewards for individuals with similar characteristics and, therefore, equal potential productivity differ between sectors. While in the formal sector there are internal markets that limit the labor supply and produce high wages, in the informal sector the ease of entry along with an abundant supply of unskilled workers lead to low wages. From this perspective, informality can be considered to be involuntary; it is not a choice but rather a last resort to escape unemployment. From the opposing perspective, the legalist or orthodox school of thought considers the labor market to be like any another market with a competitive framework in which price flexibility and free labor mobility lead to a full employment equilibrium with equal remuneration for the same kind of work (De Soto, 1987; Saavedra and Chong, 1999; Maloney, 1999). Informality is thus seen as a dynamic sector made up of micro-entrepreneurs who based on the private cost-benefit calculation choose to be informal. As such, informal activities are considered a voluntary option taken by firms in order to avoid the bureaucratic costs associated with business start-ups and other government procedures, and by individuals who find them more profitable than formal activities or because they seek greater independence and work schedule freedom. More recent theories recognize that the heterogeneous nature of the informal sector allows these two conflicting views to be reconciled, while stress a more complex structure of the sector. Thus, Fields (1990 and 2005) claims that the informal sector has its own internal duality that sees, in some cases, informal activities being preferred to certain formal activities (in segments he refers to as constituting the “upper tiers”), while, in others, the former offer worse conditions than the latter (the so-called “lower tiers”). In the first of these segments Fields places the workers who voluntarily seek employment in the informal sector because either their utility or their wages are higher than in the formal sector. Here they might achieve higher utility, despite lower wages,.
(18) Introduction. 5. thanks to non-pecuniary advantages, such as greater flexibility in their working hours. Similarly, they might obtain higher wages thanks to greater rewards being paid for specific characteristics (e.g. entrepreneurial talent) in the informal than in the formal sector. By contrast, the segments in the lower tiers are occupied involuntarily by workers been rationed out of the formal sector.2. 1.3 Measuring informality As discussed, properly defining the informal sector is not an easy matter due to its very nature of not being easily observable. According to Schneider and Enste (2000) a broad definition of the informal economy includes unreported activities producing legal goods and services which would generally be taxable and reported to the tax authorities. However, the definition of informality is strongly driven by data availability and the goals of the researcher or policy maker involved. In the literature there are at least two definitions of the informal sector: the productivity definition and the legalistic definition (Perry et al., 2007; Gasparini and Tornarolli, 2009; Khamis, 2012). The productivity definition focuses more on informal firms and type of job (ILO, 1991; Maloney, 2004). According to this definition informal activities are those carried out in low-productivity jobs in marginal small-scale, frequently family-based firms and using primitive technologies. Nevertheless, due to the limited information contained in surveys and the difficulties to define and measure productivity and marginal or primitive technologies, it is very complex to empirically implement this definition. For instance, Gasparini and Tornarolli (2009), trying to adjust this definition of informality to the information available in Latin American surveys, have related the informal sector to the type of job (self-employment), the type of economic unit (small), and the worker’s skills (unskilled workers). However, this kind of approximations has been criticized for focusing on small firms and not being able to capture evasion or coverage in large firms. The legalistic definition emphasized the lack of coverage of workers by mandated labor protections or firms avoiding taxation or other legal regulations (Saavedra and Chong, 1999). The informal sector under this definition is characterized by workers non-compliant or without access to the health insurance scheme and the. 2. Similar arguments are made by: House (1984), Tokman (1987), Marcouiller et al. (1997), Ranis and Stewart (1999), Cunningham and Maloney (2001), Maloney (2004), and Perry et al., 2007..
(19) 6. Chapter 1. pension system, and firms that not complies with the norms in terms of labor contracts, taxes, and legal registration. This second definition also has its limitations. On the one hand, there are several dimensions to be included in the concept of labor protection and social security. Furthermore, there are differences in the extent of labor protection and social security system across countries. On the other hand, being voluntary surveys the principal sources of data, there is sensitivity to how the questions are posed, and its confidence in the respondents’ willingness to truthfully reveal their labor status, tax payment or compliance of other mandated regulations. Since the approach followed in this thesis is based on a framework for examining the factors that lead workers and firms to engage in unregistered activities, rather than analyzing the precariousness of the informal sector, we are more interested in the characteristics of individuals and firms than in the characteristics of the production, such as productivity or technology. In this sense, we follow the legalistic definition of informality. Therefore, we consider two criteria to define the informal sector: the social protection criterion to define informal employment and the criterion of registration at the Chamber of Commerce to define informality at the firm level. It is worth highlighting that this approach of single-dimensional indicator allow only describe a part of the multidimensional phenomenon of informality, providing a different aspect of reality which also has important implications for the policy makers.. 1.4 Structure of thesis The rest of this thesis is divided into three essays, each of which is self-contained and developed according to its own structure and methodological framework. However each essay is concerned with the same issue, namely, informality. More specifically, the first two essays analyze labor informality, while the third examines informality at the firm level. From a theoretical perspective, the essays adhere to the dual informal labor markets approach proposed by Fields (1990 and 2005). As is discussed in Chapter 2 and further extended in Chapter 3, it is our contention that the two prevailing theories of the informal sector (dualist and legalist) constitute but partial explanations of the phenomenon. Even though individuals might be able to choose the type of employment they wish to perform given their personal characteristics (as argued by the legalist theory), restrictions may exist in the number of jobs actually created, particularly in the.
(20) Introduction. 7. formal sector, and hence their employment options will ultimately be determined by the structure of the economy or demand conditions (as claimed by the dualist theory). In such scenario, not everyone who wants to work in the formal sector can do so (“lower tiers” or “involuntary entry” informal segment), while there are those that prefer to work in the informal sector because of the greater benefits (wages or/and non-wages) it offers compared to those available in the formal sector (“upper tiers” or “voluntary entry” informal segment). The thesis is structured as follows. Chapter 2, Rationing of Formal Sector Jobs and Informality examines the determinants of the job placement process for workers in both the formal and informal sectors. The novelty in this chapter is that in the job placement process we take into account the rationing of formal jobs that exists in the economy. Despite the considerable amount of debate concerning the restrictions that exist for the creation of formal jobs in developing countries, the empirical literature has paid scant regard to this element in the job search process. To rectify this, we adopt the job queue approach first proposed by Abowd and Farber (1982) and subsequently extended by Mengistae (1999). In line with this approach, job placement in either the formal or informal sector is determined not only by individual preferences to work in one sector or the other, but also by the rationing of the formal jobs that exist. In this case, the employers’ criteria for choosing workers for rationed jobs need to be taken into account. The analysis of the determinants of the job placement process is based on the estimation of an endogenous switching regression model. This model takes into consideration the dual mechanisms that exist in the job placement process: one is the workers’ choice to actually join the job queue for a formal job and the other is the mechanism applied by employers in choosing workers from that job queue to fill a vacancy. This model also allows us to test the hypothesis of the existence of a job queue in the formal sector, to measure the length of this job queue for different groups of workers, and to quantify the percentage of informal workers who have been rationed out of the formal sector, i.e. those who are involuntarily informal. The research questions in this chapter are: What factors determine whether an individual is located in the formal sector or the informal sector? Do informal workers queue for formal jobs? Is there a formal job rationing in the Colombian labor market? Chapter 3, Labor Informality: Choice or Sign of Segmentation? A Quantile Regression Approach at the Regional Level extends the previous chapter by examining the heterogeneity of the informal sector and analyzing differences in Colombia’s local.
(21) 8. Chapter 1. labor market. To this end, we begin by studying the features of the local labor markets, especially with regards to the degree of modernity characterizing the informal sector. Thus we calculate an index of modernity of the informal sector based on the type of employment generated by each economic sector (skilled or unskilled) (Ranis and Stewart, 1999). Various descriptive statistics of this index allow us to distinguish different segments within the informal sector: one associated with more traditional activities; and the other associated with more modern activities. In the second part, we decompose the wage differential between the formal and informal sectors in the entire distribution of wages using the approach proposed by Machado and Mata (2005) and the extension developed by Albrecht, Vuuren and Vroman (2009) to account for sample selection. This methodology allows us to account for a wider variety of both informal and formal employees and to determine whether different kinds of informal workers present different kinds of behavior. The specific research questions posed in this chapter are: Is there an internal duality in the informal sector in Colombia? Why is there such a variety of workers in the informal sector? Do informal worker types differ by city? Is labor informality a choice or the result of labor market segmentation? Empirical research on these topics is scarce and this chapter aims to fill this gap. Chapter 4, Agglomeration Economies and Informality in Developing Countries, examines the clustering patterns of informal activities and their inter-relation with formal activities, as well as the effects of agglomeration economies on activities of this type. The empirical analysis in this chapter is divided in two parts. In the first, we study the spatial clustering and co-clustering patterns of formal and informal manufacturing activity within a metropolitan area of Colombia. We use census manufacturing enterprise-level data for the metropolitan area of Cali for the year 2005. Using this database we calculate the degree of spatial clustering and co-clustering by means of the M-functions proposed by Marcon and Puech (2010). Further, we analyze the geographical distribution of formal and informal enterprises in different clustered and co-clustered industries by means of kernel density mapping. In the second part, we study the effects of agglomeration economies on formal and informal productivity. In this part, we use data at the worker level for 33 local labor markets in Colombia throughout the period 2002-2006. The empirical analysis is based on the regression of individual worker wage rates (as a measure of labor productivity) on employment density (as a measure of agglomeration) conducted separately for the formal and informal wage sectors. These regressions comprise instrumental variables estimates and.
(22) Introduction. 9. a bootstrap procedure to correct for the endogeneity attributable to the reverse causality between wages and agglomeration, and to avoid any bias in the statistical inferences due to the fact that we are dealing with a small number of clusters (33 municipalities). The chapter provides a systematic analysis in seeking to respond to three questions: first, do formal and informal enterprises display different clustering patterns? Second, do formal and informal enterprises locate in the same areas of the city, or is there a marked spatial segmentation between formal and informal manufacturing activity? And third are there differences in the effects of agglomeration on productivity and wages between the formal and informal sector?.
(23) 10. Chapter 1. 1.5 References Abowd, J. and Farber, H. (1982). “Job Queue and the Union Status of Workers”, Industrial and Labor Relations Review, 35(3): 354-367. Albrecht, J., van Vuuren, A. and Vroman, S. (2009). “Counterfactual Distributions with Sample Selection Adjustments: Econometric Theory and an Application to the Netherlands”, Labour Economics, 16(4): 383-396. Cunningham, W. and Maloney, W. (2001). “Heterogeneity among Mexico’s Microenterprises: An Application of Factor and Cluster Analysis”, Economic Development and Cultural Change, 50(1): 131–156. De Soto, H. (1987). El Otro Sendero. La Revolución Informal, Lima, Instituto Libertad y Democracia. Dickens, W. T. and Lang, K. (1985). “A Test of Dual Labour Market Theory”, American Economic Review, 4(75): 792-805. Fields, G. (1990).” Labour Market Modelling and the Urban Informal Sector: Theory and Evidence”, in: D., Thurnham, Salome, B. and Schwarz, A. (Ed.), The Informal Sector Revisited. Paris, OECD. Fields, G. (2005). “A Guide to Multisector Labor Market Models”, Social Protection Discussion Paper Series, No 0505, World Bank, Washington, D.C., April. Gasparini, L and Tornarolli, L. (2009). “Labor Informality in Latin America and the Caribbean: Patterns and Trends from Household Survey Microdata”, Desarrollo y Sociedad, 63:13-80. House, W.J. (1984). “Nairobi’s Informal Sector: Dynamic Entrepreneurs or Surplus Labor?”, Economic Development and Cultural Change, 32(2): 277-302. ILO (1991). El Dilema del Sector no Estructurado. Memoria del Director General, CIT, 1991, Ginebra. ILO (2011). 2011 Labour Overview. Latin America and the Caribbean, Lima. Jütting, J., Parlevliet, J., and Xenogiani, T. (2008). “Informal Employment Re-loaded”, Working Paper, No 266, OECD Development Center, Paris, January. Jütting, J. and De Laiglesia, J. (2009). Is Informal Normal? Towards More and Better Jobs in Developing Countries, OECD Development Centre, 163 pages. Khamis, M. (2012). “A Note on Informality in the Labour Market”, Journal of International Development, 24: 894-908. Lewis, W.A. (1954). “Economic Development with Unlimited Supplies of Labour”, The Manchester School, 22(2):139-191. Machado, J. and Mata, J. (2005). “Counterfactual Decomposition of Changes in Wage Distributions Using Quantile Regression”, Journal of Applied Econometrics, 20(4): 445-465. Maloney, W. (1999), “Does Informality Imply Segmentation in Urban Labor Markets? Evidence from Sectoral Transitions in Mexico”, The World Bank Economic Review, 13(2):275-302. Maloney, W. (2004). “Informality Revisited”, World Development, 32(7): 1159-1178. Marcon, E. and Puech, F. (2010) “Measures of the Geographic Concentration of Industries: Improving Distance-Based Methods”, Journal of Economic Geography, 10(5): 745-762. Marcouiller, D., Ruiz de Castilla, V. and Woodruff, C. (1997). “Formal Measures of the Informal Sector Wage Gap in Mexico, El Salvador, and Peru,” Economic Development and Cultural Change, 45(2): 367-392. Mengistae, T. (1999). “Wage Rates and Job Queue: Does the Public Sector Overpay in Ethiopia", Policy Research Working Paper, No 2105. The World Bank..
(24) Introduction. 11. McKinsey Global Institute (2003). Turkey: Making the Productivity and Growth Breakthrough, New York: McKinsey, 784 pages. Perry, G., Maloney, W., Arias, O., Fajnzylber, P., Mason, A., and Saavedra-Chaduvi, J. (2007). Informality: Exit and exclusion. Washington DC, World Bank, Latin American and Caribbean Studies. Ranis, G., and Stewart, F. (1999). “V-goods and the Role of the Urban Informal Sector in Development”, Economic Development and Cultural Change, 47(2): 259-288. Saavedra, J. and Chong, A. (1999). “Structural Reform, Institutions and Earnings: Evidence from the Formal and Informal Sectors in Urban Peru”, Journal of Development Studies, 35(4), 95–116. Schneider F. and Enste, D. (2000). “Shadow Economies: Size, Causes and Consequences”, Journal of Economic Literature, 38: 77–114. Schneider, F., Buehn, A. and Montenegro, C.E. (2010). “New Estimates for the Shadow Economies all Over the Word”, International Economic Journal, 24(4): 443-461. Tokman, V. (1987). “El Sector Informal: Quince Años Después”, El Trimestre Económico, LIV 3(215): 513-536..
(25)
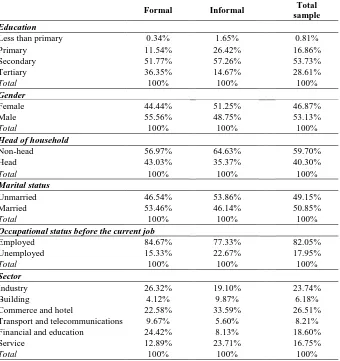
(26) Chapter 2. Rationing of Formal Sector Jobs and Informality 2.1 Introduction The neoclassical view of the labor market is based on the implicit assumption that the demand for labor is broad and diverse and that, as such, it is the characteristics of the worker that are the main determinant of employment decisions. Structural economic factors and labor demand factors are both deemed irrelevant; the only relevant factors are those associated with the conditions of supply that determine whether individuals opt for participation or inactivity, employment or unemployment and whether they work in the formal or informal sectors. However, because this view does not consider the demand factors and, hence, the restrictions that exist in the creation of jobs (above all in the modern sector of the economy), it has significant limitations when it comes to explaining the heterogeneity present in labor markets, especially the markets of developing countries. In this chapter we provide an alternative view of the labor market in which employment decisions are considered as being determined by factors of both supply and demand. Thus, although individuals have the opportunity to choose and to decide whether to work or not and to select the type of work they wish to perform, there are restrictions on the range of options available to them. These restrictions correspond to the limitations imposed by the demand side of the labor market, such as the few good quality jobs that are being created. As Table 2.1 shows, the labor markets of a group of developing regions and countries present a marked heterogeneity characterized by the scarcity of employment opportunities and the poor quality of the jobs that are available. The informal market provides between 50 and 60% of jobs and is responsible for between 30 and 40% of total output, while the unemployed represent about 8% of the labor force, exceeding 10% in extreme cases such as those of North Africa and Colombia. Given this great weight of informal economic activities, as well as the fact that the quality of employment constitutes an essential element of the quality of life and of socio-economic welfare, in addition to being a mechanism for countering social inequalities, this chapter seeks to analyze the basic characteristics and determinants of.
(27) 14. Chapter 2. finding employment in either the formal or informal labor markets, by applying an alternative methodology that assumes the rationing of formal jobs. To date, the literature has adopted models that fail to take into account formal job rationing, so that being employed in the formal or informal sectors is deemed an exclusively individual decision dependent solely on that individual’s personal characteristics and preferences. The alternative methodology proposed here is based on the so-called “job queue” approach and takes into account the criteria applied by employers in the job placement process when recruiting applicants for a limited number of jobs. The job placement process, then, can be seen to comprise two mechanisms: one is the workers’ choice to actually join the job queue for a formal job and the other is the mechanism applied by employers in choosing workers from that job queue to fill a vacancy.. Table 2.1. Informality and unemployment in developing regions Region Asia North Africa Latin America Argentina Brazil Chile Mexico Colombia. Informality 70% 47% 54% 53% 51% 36% 50% 58%. Unemployment 5.6% 10.3% 7.3% 7.9% 7.9% 7.8% 4.9% 13%. Informal GDP 35% 36% 41% 25% 40% 20% 30% 39%. Source: informality: Jütting and De Laiglesia (2009). Unemployment: ILO (2011). Informal GDP: Schneider et al. (2010).. This analysis of the determinants of job placement (informality vs. formality) is based on the estimation of an endogenous switching regression model. This model, in addition to taking into consideration the dual mechanism outlined above in the job finding process, includes as additional determinants the unbiased predictions of the wage premiums resulting from working in the formal sector. The estimations are conducted for the job market in Colombia which, as we have seen in Table 2.1, suffers marked quantitative and qualitative imbalances, i.e., significant levels of informality combined with a high rate of unemployment. The rest of the chapter is organized as follows. Section 2.2 discusses the econometric model used. In section 2.3 describes the estimation procedure and discusses some statistical tests to validate the results. In section 2.4 the data are presented and the results of econometric model are discussed in section 2.5. Finally, section 2.6 concludes..
(28) Rationing of Formal Sector Jobs and Informality. 15. 2.2 Econometric model From a neoclassical perspective, labor market decisions are determined by the worker’s characteristics, i.e., the conditions of supply. Thus, agents voluntarily choose from the options available to them: participation or inactivity, employment or unemployment, formal or informal work, etc., following a process of welfare maximization subject to a number of restrictions imposed by the individual, such as the availability of time, initial wealth, human capital endowment, among others. From this perspective, the structure of the economy and the characteristics of labor demand are not taken into account among the factors that determine employment or unemployment. An alternative approach to the labor market might allow the workers to choose, to decide for themselves, in line with neoclassical thinking, but here the range of options is determined by the constraints imposed by the demand side. This alternative perspective is not that labor demand is broad and diverse, as is assumed in neoclassical theory, but on the contrary that there are restrictions on jobs, above all formal jobs, as the modern sector only demands the jobs that it needs (Archibald, 1977; Dickens and Lang, 1985; Lang and Dickens, 1987; Uribe and Ortiz, 2006). Since there are restrictions on the number of jobs, the decision of wanting to work does not necessarily mean the individual will be contracted, i.e., the probability of wanting a job in a given sector is not equal to the probability of being employed in that sector. Moreover, taking into account the possibility of excess demand for a type of job (“a job queue”), finding a worker employed in a particular job depends on the job rationing rules used by employers as well as the preferences of workers for that post. In order to model the rationing of formal jobs, this chapter follows the model of job queues proposed by Abwod and Farber (1982) and extended by Mengistae (1999). In the first of these papers, a model is developed to analyze the determinants of the union status of workers that allows the possibility of queuing for union jobs, while the second, employing Abwod and Farber’s model, analyzes the existence of a job queue in the public sector and the wage differential between this and the private sector. Taking this same approach to the analysis of labor market constraints and the existence of job queues for formal jobs we find the works of Dickens and Lang (1985), Maloney (1998), Soares (2004), Co et al. (2005), Puentes and Contreras (2009), and Contreras et al. (2008). From this perspective it is assumed that workers freely choose the sector of the labor market in which they want to work; however, this choice is constrained by the.
(29) 16. Chapter 2. employment options available in the market. The structural constraints in the economy limit the number of formal jobs and as these are the ones that most workers prefer, given that they offer the best work conditions (stability, social security, opportunities for promotion and rewards for human capital accumulation), a queue of applicants forms for these jobs (Dickens and Lang, 1985; Lang and Dickens, 1987). The existence of a job queue for the formal sector relaxes the assumption that the probability of wanting to be employed in the formal sector is equal to the probability of obtaining a formal job. Seen from this perspective, a worker’s employment in the formal sector depends on two decision processes: the worker’s decision to join the queue for a formal job and the employer’s decision to hire a worker who is in the queue. Let us analyze the first of these decisions: joining the job queue for formal employment. The workers’ decision to join the queue to obtain a formal job depends on the utility that such a post represents to them. A major determinant in this decision and in utility maximization is the wage premium to be gained from being employed in one sector or the other. Let W1i be the hourly wage earned by individual i in the formal sector and W2i the hourly wage earned in the informal sector. We also define U1i as the maximum utility individual i can obtain in the formal sector and U2i as the maximum utility the individual can obtain in the informal sector. Thus, it is assumed that individual i will prefer a formal job and will queue for such a job if V1i* = U1i – U2i > 0. Assuming that V1i* depends linearly on the wage premium provided by the formal sector (lnW1i – lnW2i) and on a set of individual traits and characteristics of his or her working environment and family (X1i), the following job queue equation can be written: V1*i = α1 (ln W1i − ln W2 i ) + X 1'i β1 + u1i ,. (1). where α1 is a constant to be estimated; β1 is a vector of coefficients to estimated; and u1 is a random error term distributed with mean zero and variance σ u21 .. Since V1i* is not directly observable and only its sign can be observed, a binary variable I1i can be defined that captures an individual’s willingness to obtain a formal job, as follows: I1i = 1 iff V1*i = α1 (ln W1i − ln W2i ) + X 1'i β1 + u1i > 0 I1i = 0 iff V1*i = α1 (ln W1i − ln W2 i ) + X 1'i β1 + u1i < 0. (2). Hence, I1 is a binary variable equal to 1 if the worker joins the queue for a formal job and equal to 0 if the worker prefers not to join the queue..
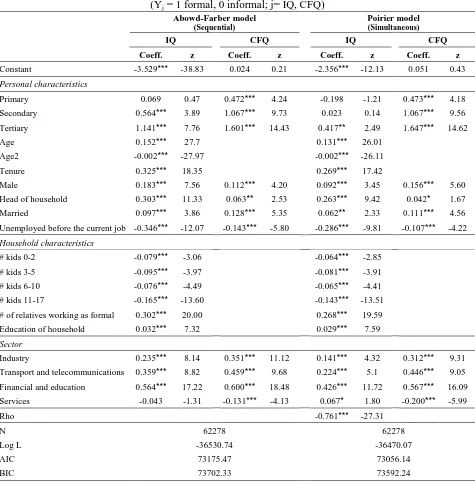
(30) Rationing of Formal Sector Jobs and Informality. 17. The second decision, i.e., that taken by employers when selecting workers from the job queue to fill the formal vacancy, can also be modeled on the basis of a latent variable V2i* . It is assumed that the objective of the employers in the formal sector is to maximize worker productivity per unit spent on this factor. Thus, the employer will hire a given individual ( V2*i > 0 ) taking into consideration characteristics of productivity (X2i) and the absolute costs he expects to incur for hiring that individual ( E (ln W1i ) ). This can be expressed as:. V2*i = α 2 E (ln W1i | V1*i > 0) + X 2' i β 2 + u2 i. (3). where i represents the group of workers queuing for a job; α 2 is a constant to be estimated; E (ln W1i | V1*i > 0) represents expected wage a worker could earn in the formal sector as has joined the queue; β 2 is a vector of coefficients to estimated; and u2 is a random error term distributed with mean zero and variance σ u22 . As in the job queue equation, a binary variable I2i can be defined that captures the sign of V2i* and which also captures the selection process undertaken by the employer when choosing a worker from the queue, which is:. I 2 i = 1 iff V2*i = α 2 E (ln W1i | V1*i > 0) + X 2' i β 2 + u2i > 0 I 2 i = 0 iff V2*i = α 2 E (ln W1i | V1*i > 0) + X 2' i β 2 + u2i < 0. (4). Then, I2 is a dummy variable equal to 1 if the worker is chosen from the queue to fill the post available in the formal sector or equal to 0 if not selected. Together with equations (1) - (3) the system is completed with the wage equations for the formal and informal sectors: ln W1i = Z1'iγ 1 + υ1i iff V1*i > 0 and V2*i > 0. (5). ln W2i = Z 2' iγ 2 + υ2 i otherwise. (6). where Zji is a vector of observable individuals and labor characteristics; γ 1 and γ 2 are vector of coefficients to estimated; υ1i and υ2i are iid normal with mean zero and variances σ υ21 and σ υ22 , respectively. Assuming the joint distribution of the error terms ( u1i , u2 i ,υ1i ,υ2i ), Mengistae (1999) shows that the covariance matrix has the form:.
(31) 18. Chapter 2. σ u21 . σ 1u σ. 2. σ 1υ. σ 1υ . 2 u2. σ 2υ. σ 2υ , σ υ υ . 1. 1. συ. 2 1. 2. . 2. 1 2. σ υ2 2. where, Cov(u1i ,υ1i ) = σ 1υ1 ; Cov(u1i ,υ2i ) = σ 1υ2 ; Cov(u2i ,υ1i ) = σ 2υ1 ; Cov(u2i ,υ2i ) = σ 2υ2 ; Cov(υ1i ,υ2 i ) = σ 1υ1σ υ1υ2 ; and Cov(u1i , u2i ) = σ 1u2 .1 The OLS estimation of the above wage equations, regardless of the sector in which the workers choose to seek work and the employers’ selection decisions, can lead to bias. ln W1 and ln W2 are censored variables, since the former is only observed for formal workers and the latter solely for informal workers, so that the disturbance terms. υ1i and υ2i have a truncated distribution and the OLS estimates would not be consistent for the existence of a selection bias problem (Heckman, 1979; Huguet, 1996). In order to identify the system of equations fully, we first need to deduce the wage that a worker in the queue might expect to earn in the formal sector (that is, the expression E (ln W1i | V1*i > 0) in the equation (3)). Using equations (1) - (5) we obtain that:. E (ln W1i | V1*i > 0) = Z1'iγ 1 + σ 1υ1 λ1i. (7). where λ1i is analogous to the inverse Mills ratio and its structure depends on whether ρ is equal to or different from zero. Its expression is developed in the following section. The full model, therefore, comprises equations (1), (3), (5) and (6). The system is endogenous given that in the job finding equations (equations (1) and (3)) wages are included (equations (5) and (6)) as additional determinants, while the wage equations in turn are determined by the job finding decisions of the workers and the employers’ selection decisions. Such models receive the name of endogenous switching regression models (Maddala y Nelson, 1975). The section that follows provides a discussion of the estimation strategy for models of this type, which depends on the degree of observability of individuals who are in the job queue and the assumption regarding the decision-making process: whether it is sequential or simultaneous.. 1. In section 2.3.1. σ 1u. 2. is refer as. ρ . Mengistae (1999) assumes that this parameter is equal to cero and. therefore his estimation follows a sequential structure..
(32) Rationing of Formal Sector Jobs and Informality. 19. 2.3 Estimation procedure and the test on the existence of the job queue In order to estimate the endogenous switching model a three-step procedure is followed. In the first step, the reduced-form bivariate probit model (which does not include the wage differential between sectors) is estimated and the residuals are taken to approximate the expectations of υ1 and υ2 conditional upon u1 and u2 . These approximations, which are nothing other than the inverse Mills ratios, can, in the second step, enter the wage equation for each of the sectors and correct the selection bias. Finally, in the third step, the wage differential, estimated in the second step, is included as an additional regressor in the “in-queue” (IQ) equation. Likewise, the wage that a worker could earn in the formal sector, as estimated from the wage equations, is included in the “chosen-from-queue” (CFQ) equation. To identify the system, a number of exclusion restrictions need to be considered for the model. On the one hand, to be able to identify the parameters of the IQ and CFQ equations, variables need to be incorporated that affect the former decision but not the latter, and vice versa. On the other hand, to identify the parameters of the wage equations, at least one variable needs to be included that determines wages but which does not affect the IQ and CFQ decisions. A further important aspect to consider when estimating the bivariate probit model is the partial observability of the data. 2 Household surveys usually only provide information about the workers’ current situation, that is, whether they are employed in the informal or formal sector, but they provide no details about the decision process that leads an individual to opt for formality or informality. This means that it is not possible to observe the different types of informal workers that might emerge from the decision process: i.e., workers that choose the informal sector and who do not queue for formal employment; or workers, who although they are in the queue, are not selected and have to opt for the informal sector. In terms of the equations described in the previous section, no information is available regarding the IQ ( I1 ) and CFQ ( I 2 ) decisions. Only the product of these two decisions can be observed ( I = I1 I 2 ). If this product is equal to 1, the worker is in the formal sector and if it is equal to 0, the worker is in the informal sector.. 2. A more detail explanation on the partial observability of the data can be found in Abowd and Farber (1982), Meng and Schmidt (1985), and Tunali (1986)..
(33) 20. Chapter 2. To overcome this lack of information, Poirier (1980) and Abowd and Farber (1982) propose using the same dependent variable for the IQ and CFQ equations and differentiating between the characteristics that affect each of the equations. Thus the exclusion restrictions acquire considerable importance for identifying the effects. One aspect that differentiates Poirier’s method from that of Abowd-Farber’s is the assumption concerning the decision-making process. The first author assumes that both decisions are taken simultaneously, while the latter assume that the decision process is sequential. According to Maddala (1983), the choice of one or other of these models depends on the purpose for which it is required. If the analysis seeks to examine the factors that influence the employers’ decision to hire a specific type of worker, the simultaneous model would be the most appropriate; whereas, if it seeks to analyze the whole process of worker placement between the formal and informal sectors, taking into account the factors that affect both the preferences of workers and employers, the sequential model would be the most appropriate. The second approach, therefore, seems to be the most suitable for the case we deal with here; however, as far as possible both methods will be followed so as to observe the extent to which their respective results are consistent.. 2.3.1 Estimation As mentioned above, the estimation of the model depends on the assumption that it is made regarding the decision-making process: whether it is sequential or simultaneous. In the Abowd-Farber model it is assumed that decisions are made sequentially, which supposes that these decisions are independent. This in turn implies that the joint distribution function of the disturbance terms of the IQ and CFQ equations ( u1 and u2 , respectively) follows a bivariate normal distribution with zero means and unit variances and covariances equal to zero. Given this structure, the likelihood function with partial observability to be maximized is (Meng and Schmidt, 1985; Tunali, 1986): L1 = ∏ Φ( X 1'i β1 )Φ ( X 2' i β 2 ) ∏ 1 − Φ ( X 1'i β1 )Φ( X 2' i β 2 ) , I =1. (8). I =0. where Φ is the normal cumulative distribution; X 1 and X 2 are the explanatory variables of the IQ and CFQ equations, respectively. As in the first step the reducedform bivariate probit model is estimated, we also include as explanatory variables those variables assumed only to affect wages..
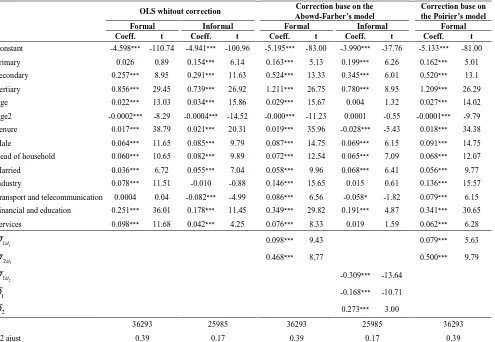
(34) Rationing of Formal Sector Jobs and Informality. 21. By contrast, Poirier’s model assumes that the process of choosing between the formal and informal sectors is simultaneous, which implies that the correlation between the disturbance terms of the two equations is different from zero. Under this assumption therefore the likelihood function to be maximized has the following form (Meng y Schmidt (1985); Tunali (1986)): L2 = ∏ Φ 2 ( X 1'i β1 , X 2' i β 2 , ρ ) ∏ 1 − Φ 2 ( X 1'i β1 , X 2' i β 2 , ρ ) , I =1. (9). I =0. where Φ 2 is the bivariate normal cumulative distribution; ρ is the covariance between. u1 and u2 , and we assume that σ u21 = σ u22 =1. Note that in the absence of a correlation between the disturbance terms of the two equations, ρ is equal to zero in equation (9) and the simultaneous model becomes a sequential model. Continuing therefore to the second step in the estimation (as outlined at the beginning of this section), the wage equations have to be estimated next, while correcting for the bias due to the censoring of the data generated by workers choosing to work in either the formal or informal sectors. To correct for this selection bias, the procedure proposed by Maddala (1983, pp. 278-283), which is an extension of the Heckman-Lee two-stage estimation method (Heckman, 1976; Heckman, 1979; Lee, 1978), is adopted. Assuming the disturbances in the formal workers’ wage equation to be normally distributed, the first moment of the truncated distribution is given by the following expression (Tunali, 1986; Mohanty, 2001): E (υ1i | I1i = 1, I 2 i = 1) = σ 1υ1 λ1i + σ 2υ1 λ2i ,. (10). where λ1i and λ2i are analogous to the inverse Mills ratios in the univariate context. These ratio values depend on the existence or otherwise of a correlation between the IQ and CFQ decisions, that is, whether or not Cov(u1i , u2i ) = ρ = 0 . Assuming that the preceding expression is different from zero then (Tunali, 1986):. φ ( X 1'i β1 )Φ( X 2' i β 2 − ρ X 1'i β1 ) / 1 − ρ 2 λ1i = Φ 2 ( X 1'i β1 , X 2' i β 2 , ρ ). (11). φ ( X 2' i β 2 )Φ ( X 1'i β1 − ρ X 2' i β 2 ) / 1 − ρ 2 Φ 2 ( X 1'i β1 , X 2' i β 2 , ρ ). (12). λ2i =. Now, assuming independence between these decisions then ρ =0, so that the above expressions can be reduced to:.
(35) 22. Chapter 2. λ1i =. φ ( X 1'i β1 ) Φ( X 1'i β1 ). (13). λ2i =. φ ( X 2' i β 2 ) Φ( X 2' i β 2 ). (14). Thus, the consistent estimation of the wage equation for workers in the formal sector is obtained by incorporating λ1i and λ2i as additional regressors, that is, by estimating the following equation:. ln W1i = Z1'iγ 1 + σ 1υ1 λ1i + σ 2υ1 λ2i + ε1i ,. (15). where ε 1i = υ1i − σ 1υ1 λ1i − σ 2υ1 λ2i and E (ε1i | I i = 1) = 0 . Following the Heckman-Lee method an approximation of the expressions of λ1i and λ2i are the estimates from the bivariate probit, which gives consistent estimates of γ 1 . That is, applying OLS to the following expression: ln W1i = Z1'iγ 1 + σ 1υ1 λˆ1i + σ 2υ1 λˆ2i + η1i ,. (16). where η1i = ε1i + σ 1υ1 (λ1i − λˆ1i ) + σ 2υ1 (λ2i − λˆ2 i ) . By following the Heckman-Lee two-stage estimation method for the informal workers’ wage equation ( I = 0 ), problems arise in terms of the identification of different types of informal worker and, as a result, the sample selection rules are more complicated than they are for the case of formal workers. Using Poirier’s model (simultaneous case), two types of informal worker can, in principle, be differentiated: those that are in the job queue but who are not chosen by the employers ( E (υ 2i | I1i = 1 and I2 i = 0) ), and those that have opted not to join the queue ( E (υ2 i | I1i =0 ) ). In addition, there is another type of informal worker, in this case not very clearly defined, who while not having joined the queue may yet be selected for a formal job ( E (υ 2i | I1i = 0 y I 2i = 1) ).3 Given this problem of identifying types of. 3. It is possible to determine the sample selection rules and therefore to calculate the inverse Mills ratios in the case of formal workers, that is, when I = I1 I 2 = 1 . This product is equal to 1 only when worker is in the. job queue and is chosen by the employer to fill a formal position ( I1 = 1 and I 2 = 1 ). However, in the case of informal workers the sample selection rules are not very clear. We observe an informal worker when I = I1 I 2 = 0 . Now, if we assume that the decision-making process is simultaneous, there are three possible combinations for which this last product is equal to zero, these are: 1) when a worker opt not to join the queue and he or she is not chosen by the employers ( I1 = 0 and I 2 = 0 ); 2) when a worker have opted to join the queue, but he or she is not chosen by the employers ( I1 = 1 and I 2 = 0 ); and 3) when a worker have not opted to join the queue but he or she is chosen by the employers ( I1 = 0 and I 2 = 1 ). This last sample.
(36) Rationing of Formal Sector Jobs and Informality. 23. informal worker, it is not possible to either calculate the inverse Mills ratios or, therefore, correct the selection of the wage equation of the informal workers with Poirier’s model. In the case of the sequential model (Abowd-Farber’s model), Mengistae (1999, pp. 11-12) proposes a solution for correcting the selection bias in the wage equation of the informal workers. The author shows that the expected wage of informal workers ( I = 0 ) can be estimated as the weighted average of the wage of workers that are informal because they have not joined the job queue ( I1 = 0 ) and the expected wage of workers who are informal as they have not been chosen from the job queue despite having joined it ( I1 = 1 and I 2 = 0 ). That is:. (1 − π ) E (W21i | I1i = 0) + π E (W22i | I1i = 1 e I 2i = 0) ,. (17). with π as the proportion of informal workers that are in the job queue and that are not chosen and (1- π ) as the proportion of informal workers that are not in the queue. The above expression can be written as:. LnW2i = Z 2' iγ 2 + σ 1υ2 λ3i + δ1λ1*i + δ 2 λ4i + ε 2i ,. (18). where λ3i = −φ ( X 1'i β1 ) 1 − Φ ( X 1'i β1 ) ; λ4i = −φ ( X 2' i β 2 ) 1 − Φ ( X 2' i β 2 ) ; λ1*i = λ1i − λ3i ;. δ1 = πσ 1υ ; δ 2 = πσ 2υ ; ε 2i = (1 − π )ε 21i + πε 22i ; ε 2i1 and ε 2i2 are the disturbances in the 2. 2. wage equation of I1i = 0 and, I1i = 1 and I 2i = 0 , respectively. Consistent estimates of γ 2 , σ 1υ2 , δ1 y δ 2 can be obtained estimating by OLS the following equation: LnW2i = Z 2' iγ 2 + σ 1υ2 λˆ3i + δ1λˆ1*i + δ 2 λˆ4 i + η 2i. (19). where η2i = ε 2i + σ 1υ2 (λ3i − λˆ3i ) + δ1 (λ1*i − λˆ1*i ) + δ 2 (λ4i − λˆ4i ) and the inverse Mills ratios can be approximate estimating the bivariate probit Abowd-Farber model. With the Heckman-Lee two-stage procedure, consistent estimates of the parameters are obtained; however, if there is selection bias, the standard errors of these estimates will not be consistent. We had used bootstrap techniques to calculate these. selection rule is not very clear and therefore the inverse Mills ratios in the case of Poirier’s model cannot be calculated..
(37) 24. Chapter 2. standard errors. Notice that Tunali (1986) and Mengistae (1999) both propose methods for correcting the standard errors, but their procedure is cumbersome. In the third step of the endogenous switching model, the IQ and CFQ equations are estimated with a structural bivariate probit model. As mentioned earlier, in the first equation the estimated difference in wages is included as an additional regressor and in the second equation the estimated wages in the formal sector are added. The structural bivariate probit can only be estimated for the Abowd-Farber’s model since for Poirier’s model estimates corrected by selectivity of the informal sector wages cannot be obtained. A final aspect to take into account in estimating the endogenous switching model is that of exclusion restrictions. There are two sets of restrictions. The first ones are those that need to be imposed to distinguish between the IQ and CFQ equations. And the second ones are those that make possible the identification of the wage equations. For the first set of restrictions it is assumed that the factors that influence the decision to join the queue for a formal job are closely related to personal characteristics, above all to the characteristics of the family and household. At the same time, the employers’ hiring decisions are assumed to be more closely affected by the endowment of human capital, including such factors as education, previous employment status, the degree of commitment to work and the specific job sector. Thus, the variables excluded from the second equation but included in the first are: age, the number of years in the current job (i.e., tenure) and a number of household variables, including number of children, the occupational status of other members of the household and the educational level of the household. Let us examine the assumptions underpinning the inclusion or exclusion of some of the aforementioned variables. The variables of age and tenure are excluded from the CFQ equation. The former is excluded to avoid problems of multicollinearity; while in the latter case, it is assumed that employers consider the experience a worker has acquired throughout his or her working life and not just that gained in one particular job (Abowd and Farber, 1982; Farber, 1983; Mengistae, 1999; Soares, 2004). On the other hand, the variables capturing a worker’s position within the household and his or her marital status are included so as to measure two distinct effects. In the CFQ equation, these variables represent the worker’s degree of commitment to work, to the extent that the responsibilities assumed by heads of households can be related to a greater.
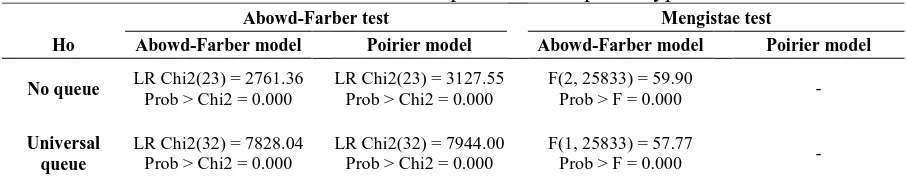
(38) Rationing of Formal Sector Jobs and Informality. 25. commitment to their work; and in the IQ equation, they represent the traditional characteristics of the individual which, depending on his or her position and responsibilities within the family structure, will reflect their commitment to the taking on of a particular job. At the same time, the inclusion of the household variables in the first equation seeks to account for the costs incurred by an individual that opts to work in either the formal or informal sectors. The number of children is a proxy for the level of household responsibility, especially as far as women are concerned. Thus, an informal job might be considered more beneficial as it is more likely to offer a flexible timetable so that the workers can distribute their time more easily between childcare and work. As for the second set of exclusion restrictions used for identifying wage equations, it is assumed that household characteristics and previous employment status have no effect on the wage levels of formal and informal workers. Likewise, it is assumed for the identification that the specific job sector only affects wage levels, and so these variables are excluded from the structural bivariate probit model.. 2.3.2 The existence and length of the formal job queue In order to test for the existence of a formal job queue, we calculate the tests proposed by Abowd and Farber (1982) and Mengistae (1999). These tests, as well as validating the robustness of the bivariate model with respect to the univariate model, provide evidence of the barriers to obtaining a formal job. In other words, the existence of a job queue means that not all the workers who want to work in the formal sector can do so, due to the restrictions imposed by their own characteristics and the limitation on the number of formal jobs that are in fact available. Abowd and Farber (1982) propose evaluating the existence of a job queue based on the estimates of a first-stage bivariate probit model. In the absence of a job queue the parameters of the CFQ equation are restricted to zero with the exception of the constant term. Based on these restricted and unrestricted estimates of the bivariate probit model, the null hypothesis of the non-existence of the queue based on a likelihood ratio (LR) statistic can be tested. A further test that could be applied (the opposite to that of the noqueue model) is that of the existence of a universal queue. A universal queue is equivalent to the restriction that all the parameters of the IQ equation are zero with the exception of the constant term. As in the first test, we can test the null hypothesis of the existence of a universal queue with a likelihood ratio statistic..
Figure
+7
Documento similar
For the Agri-food Sector Innovation Management Network (INNOVAGRO), as a platform that promotes innovation in the agri-food ecosystems of the rural economies in the 15
The link between trade liberalization and poverty reduction has played a crucial role on economic policy in developing and least developed countries, particularly in
Using the latest versions of the GTAP database and the GTAP-AGR model of the global economy, our results suggest real net farm incomes would rise in developing countries with a
The expansionary monetary policy measures have had a negative impact on net interest margins both via the reduction in interest rates and –less powerfully- the flattening of the
Jointly estimate this entry game with several outcome equations (fees/rates, credit limits) for bank accounts, credit cards and lines of credit. Use simulation methods to
In our sample, 2890 deals were issued by less reputable underwriters (i.e. a weighted syndication underwriting reputation share below the share of the 7 th largest underwriter
21 To sum up, on average, the dairy sectors of the countries in the sample were more concerned about the environmental dimension of their production activities or their
Considering the direct and indirect effects of energy subsidies reform to evaluate their impacts on household welfare in developing countries, these authors demonstrated that a
