Geotechnical analysis of large volcanic landslides: The La Orotava events on Tenerife,Canary Islands
228
0
0
Texto completo
(2) Geotechnical analysis of large volcanic landslides: The La Orotava events on Tenerife, Canary Islands. Marcel Hürlimann. "Getöse, Krachen und Geprassel erfüllt wie tief brüllender Donner die Luft – erschüttert jedes lebende Ohr und Herz, und tönt im Wiederhall von tausend Bergesklüften noch grässlicher." Schuttbuch des Goldauer Bergsturzes (Dr. Karl Zay, 1807).
(3) ACKNOWLEDGEMENTS This study was supervised by Alberto Ledesma from the Department of Geotechnical Engineering and Geosciences, School of Civil Engineering, 'Universitat Politècnica de Catalunya' (UPC) and Joan Martí from the Institute of Earth Sciences 'Jaume Almera', Spanish Research Council (CSIC). I owe many thanks to them and my Ph.D. would not have been the same without their continuous support and encouragement. To combine the ideas of an engineer and a volcanologist was not always easy, but the inter-disciplinary structure certainly improved the results of this work. I am very grateful to many people at the Department of Geotechnical Engineering and Geosciences (UPC) and the Institute of Earth Sciences 'Jaume Almera' (CSIC) who helped me in various ways. Special thanks to Antonio Lloret, Tomás Pérez and José Álvarez who introduced me into the design and handling of the apparatuses of the geotechnical laboratory and to Ignasi Queralt who carried out the X-ray analyses. I want to extend my thanks to the many colleagues who joined me during the Ph.D. including Silvia Zafrilla, Arnau Folch, Carles Soriano, Elisenda Turon, Dioni Cendon, Giray Ablay, Fernando Resta and François Legros at the CSIC and Joan Rius, Mauricio Barrera, Luciano Costa and José Moya at the UPC. Special thanks are due to Josep-Oriol García for his contribution to the mobility analysis and laboratory work. José-Manuel Navarro and the staff of the 'Consejo Insular de Aguas del CABILDO Tenerife' are appreciated for facilitating the visits of some water tunnels on the island and giving many useful hints on the underground geology around the La Orotava valley. Luis García-Cacho is thanked for many helpful discussions on volcanic landslides and making the bathymetric and topographic data available. Francisca Gómez is acknowledged the preparation of some GIS data. This study was supported by several financial sources. In the first place, I acknowledge to the Swiss National Science Foundation and also to the Spanish Research Council (CSIC) / the Swiss Federal Institute of Technology Zurich for paying my salary and travelling expenses. Additional help came from the Werner Steiger Foundation and the EC contract EV5V-CT-0283 / the CICYT project AMB960498-C04. I would also like to express gratitude to my parents Karl and Ida and to my brothers Stefan and Guido who motivated my university education and assisted me generously. To my beloved Nieves, all my thankfulness for her faith in me and unconditioned support.. i.
(4) ii.
(5) TABLE OF CONTENTS ABSTRACT LIST OF FIGURES LIST OF TABLES. 1. INTRODUCTION 1.1 1.2 1.3 1.4 1.5. 2. Hazards from large volcanic landslides Problem Test site Goals Thesis structure. STATE OF THE ART 2.1 2.2 2.3. 3.5 3.6 3.7. 5. 2.3.1. 13 13 13 14 14 14 16 17 17 18 19 21 22 23 23 24. Non-volcanic factors Morphologic factors Geologic factors Hydrologic and hydrogeological factors Sea level changes Tectonic seismicity Volcanic factors Explosive eruptions Dike intrusion Caldera collapse episode Volcanic seismicity Hydrothermal activity Stress regime Geotechnical considerations Progressive failure Undrained loading. SITE INVESTIGATION. 3.4. 1 1 2 2 3. 5 6 11. 2.3.3. 3.1 3.2 3.3. 1. Terminology of mass movements Examples of large landslides Causes of large landslides. 2.3.2. 3. vii viii xii. 25. Introduction The Canary Islands Tenerife Island. 25 26 31. 3.3.1 3.3.2 3.3.3. 32 34 36. Geological evolution Morphologic features Volcanic activity. Geomorphologic analysis. 38. 3.4.1 3.4.2 3.4.3. 39 41 47. Tenerife Island Northern flank of Tenerife The La Orotava valley area. Geologic analysis Assumed preslide conditions Conclusions. 65 77 79 iii.
(6) 4. LABORATORY ANALYSIS 4.1 4.2. 4.3. Introduction Methodology. 83 86. 4.2.1 4.2.2 4.2.3. 86 94 94 95 95 96 99 99. 4.3.2. 5. Sampling Analysis of mineralogy, chemistry and microstructure Geotechnical analysis Soil characterisation Consolidation tests Direct shear test Ring shear test Triaxial test. Results 4.3.1. 4.4. 102 Analysis of mineralogy, chemistry and microstructure Mineralogical and chemical analysis Microstructure Geotechnical tests Soil characterisation Consolidation tests Direct shear tests Ring shear test Triaxial tests. Conclusions. STABILITY ANALYSIS 5.1 5.2. 5.3. 5.5. 151. 5.2.1 5.2.2 5.2.3. 152 154 155. Seismic shocks Dike intrusion Caldera collapse event. Approaches. 155. 5.3.1. 155 156 159 161 162 163. Global limit analysis Limit Equilibrium Method Upper Bound Method Continuum analysis Finite Difference Method Finite Element Method. Model description. 164. 5.4.1 5.4.2. 165 167. Global limit analysis Continuum analysis. Results. 5.5.2. iv. 148. 151 152. 5.5.1. 5.6. 102 102 108 113 113 115 120 131 132. Introduction Mechanisms applied. 5.3.2. 5.4. 83. 169 Global limit analysis Limit Equilibrium Method Upper Bound Method Continuum analysis Finite Difference Method Finite Element Method. Conclusions. 170 170 177 182 182 183. 190.
(7) 6. MOBILITY ANALYSIS 6.1 6.2 6.3 6.4. Introduction Model description Results Conclusions. 193 193 195 197 200. 7. CONCLUSIONS. 201. 8. REFERENCES. 205. APPENDIX 1: PUBLICATIONS ARISING FROM THIS THESIS. 219. v.
(8) vi.
(9) ABSTRACT Large volcanic landslides are one of the most hazardous of geological processes. They have occurred about once every 25 years during the last 500 years, and are a serious risk for the population due to their great volume and mobility. In spite of their destructive potential there are few comprehensive studies analysing large landslides on volcano flanks, and the mechanisms of such mass movements are not yet resolved. Within the last few years, several hypotheses concerning the potential causes of volcanic landslides have been proposed including processes such as dike intrusion, volcanic spreading, hydrothermal alteration, seismic shocks and caldera collapse events. Tenerife exhibits three large subaerial valleys originated by giant flank failures with ages ranging from Upper Pliocene to Middle Pleistocene. The northern submarine flank of the island is characterised by a voluminous apron of landslide debris. The La Orotava valley has been selected for analysis due to the amount of available data concerning its structure and evolution, and has been used as a test site to validate new assumptions that could be applied to other volcanic areas. The site investigation has revealed that the present morphology of the La Orotava valley was formed by two different failures: one in the western sector and the other in the eastern sector. The mechanical stability of the preslide volcano flank was strongly reduced by geologic, morphologic, climatic and volcanological factors which play a fundamental role in the initiation of the landslides. Widespread residual soils (paleosols) might have acted as potential slip surfaces, while deep erosive canyons probably evolved into the lateral limits of the failures. A high coastal cliff and a humid climate have also contributed to the critical stability conditions. The location of the landslide amphitheatre is perpendicular to the active Dorsal rift zone and adjacent to the Las Cañadas caldera, both important influences on the stability of the volcano slopes. On Tenerife, the relationship between large volcanic landslides and vertical caldera collapses is supported by a temporal coincidence of at least two failures with caldera collapse events. The mechanical behaviour of a residual soil sampled in the La Orotava valley has been analysed. Red coloured residual soils are generally located at the top of phonolitic pyroclastic deposits and are proposed as potential slip surfaces due to their very weak behaviour and their flat, homogeneous characteristics. They represent the only planar surface within the succession making up the volcano slopes. Their weak mechanical behaviour is characterised by volumetric collapse during shearing, a substantial reduction of shear strength for high normal stresses, and a significant increase of pore water pressure during undrained loading. The last feature is fundamental to the stability of volcano flanks since it strongly reduces the soil strength. Earthquakes, common processes in active volcanic areas, and saturated conditions can generate high excess pore pressures indicating the importance of regional climate and seismicity. The stability analysis has considered three different mechanisms: 1) ground acceleration due to seismicity - including both tectonic earthquakes and volcano-tectonic seismic shocks produced by caldera collapse; 2) horizontal stress due to dike intrusion, and; 3) vertical shear stress due to caldera collapse. The results indicate that ground acceleration principally decreases the mechanical stability of volcano flanks, enabling failure. Horizontal stresses due to dike intrusion can also influence slope stability, but preferably act as a preparing factor destabilising the slope, and not as a final triggering mechanism. The 3D numerical simulations show the significant effect of deeply incised canyons creating high shear stress at their base. Applying the results to the La Orotava events, the following scenario is assumed: First, deep narrow canyons, weak residual soils, humid climate, coastal cliff and persistent dike intrusion have significantly reduced the mechanical stability of the volcano slope and determined the limits of the failing mass. Then, seismicity generated by the caldera collapse episode at the end of the Guajara cycle at ~0.56 Ma triggered the catastrophic landslides. The results of the mobility analysis show the important influence of water on the runout distances of landslides. Subaqueous drag forces reduce the velocity, while hydroplaning effects strongly increase the runout distance. For Tenerife, the model indicates that a sliding mass can advance great distances, tens of kilometres away from the island, at water depths exceeding 3000 m, as can be observed in the bathymetric data.. vii.
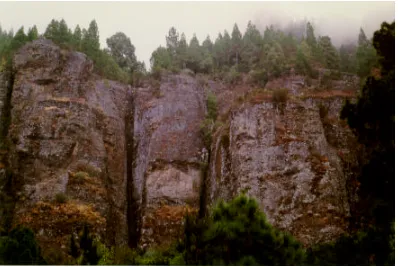
(10) LIST OF FIGURES Figure 2.1: Mobility versus volume of non-volcanic and volcanic landslides......................................... 6 Figure 2.2: Profile of Mt. St. Helens landslide. .................................................................................... 8 Figure 2.3: Cross sections of landslides on volcanic islands. ...............................................................10 Figure 2.4: Influence of slope angle on the failure of 55 Quarternary volcanoes. .................................13 Figure 2.5: Variation of peak horizontal acceleration coefficient (PHAC) with epicentre distance for different earthquake magnitudes. ....................................................................................15 Figure 2.6: Drained vs. undrained loading .........................................................................................24 Figure 3.1: Large landslide events around the Canary Islands. ...........................................................26 Figure 3.2: Simplified tectonic framework and structural axes of the Canary Islands...........................28 Figure 3.3: Correlation between sea level changes and landslide events. ..............................................29 Figure 3.4: Satellite image of Tenerife island......................................................................................31 Figure 3.5: Simplified onshore geology of Tenerife.............................................................................32 Figure 3.6: Simplified volcanic stratigraphy of Tenerife .....................................................................33 Figure 3.7: Morphology of the central part of Tenerife. ......................................................................34 Figure 3.8: Principal features of volcanic activity on Tenerife.............................................................37 Figure 3.9: Subaerial slope inclination versus altitude computed using GIS.........................................39 Figure 3.10: Simplified profiles of the flanks of Tenerife island ..........................................................40 Figure 3.11: Shaded relief of the northern flank of Tenerife ................................................................42 Figure 3.12: Geomorphologic map of the northern flank of Tenerife ...................................................43 Figure 3.13: Idealised longitudinal geological cross section through the north flank of Tenerife. ..........45 Figure 3.14: Idealised transverse profile through the north flank of Tenerife........................................45 Figure 3.15: Shaded relief of the La Orotava valley............................................................................48 Figure 3.16: Longitudinal topographic profiles of the La Orotava valley .............................................49 Figure 3.17: Transverse topographic profiles of the La Orotava valley................................................49 Figure 3.18: Photograph of the Tigaiga wall.......................................................................................51 Figure 3.19: Slope inclination map of the Tigaiga wall. ......................................................................52 Figure 3.20: Geomorphologic map of the Tigaiga wall area. ...............................................................54 Figure 3.21: Photograph of the St. Ursula wall and Los Organos area ................................................56 Figure 3.22: Slope inclination map of the St. Ursula wall and the Los Organos area............................57 Figure 3.23: Photograph of sub-vertical wall in the Los Organos ........................................................58 Figure 3.24: Photograph of sub-vertical wall in the Los Organos area.................................................58 Figure 3.25: Geomorphologic map of the St. Ursula wall and the Los Organos area............................60 Figure 3.26: Topographic profiles of the Los Organos area. ...............................................................61 Figure 3.27: Simplified geomorphologic map of the La Orotava valley. ..............................................62 Figure 3.28: Photo of the Barranco de Ruiz........................................................................................64 Figure 3.29: Geochronological data in the La Orotava valley area. .....................................................67 Figure 3.30: Stratigraphic columns of the La Orotava valley area.......................................................68 Figure 3.31: Simplified geological map of the La Orotava valley area.................................................70 Figure 3.32: Rose diagram of dip directions of the materials composing the Tigaiga massif.................71 Figure 3.33: Rose diagram of dip directions of deposits composing the Los Organos area ...................72 Figure 3.34: Simplified geologic cross sections of the La Orotava valley.............................................73 Figure 3.35: Photograph of residual soils ...........................................................................................75 Figure 3.36: Simplified geologic column indicating the formation of residual soils. .............................76 Figure 3.37: Morphologic features characterising the preslide conditions of the La Orotava valley area.77. viii.
(11) Figure 4.1: Tentative model of the bonding in residual soils after Vaughan et al. (1988)......................84 Figure 4.2: Location of the samples analysed. ....................................................................................88 Figure 4.3: Outcrop of residual soil sample RS1. ...............................................................................89 Figure 4.4: Outcrop of residual soil sample RS2. ...............................................................................89 Figure 4.5: Location of the samples of the valley filling breccia EL1 and EL2.....................................90 Figure 4.6: Outcrop of residual soil sample RS3. ...............................................................................90 Figure 4.7: Outcrop of the valley filling breccia MO1 at Playa de Fajana............................................91 Figure 4.8: Outcrop of the valley filling breccia MO2 at Punta el Gundastés.......................................91 Figure 4.9: Location of the breccia sample BR1 near Los Organos. ....................................................92 Figure 4.10: Outcrop of breccia sample BR2 near La Ladera. ............................................................92 Figure 4.11: Hand sample BI1 representing a baked phonolitic pyroclastic deposit..............................93 Figure 4.12: Photograph indicating the contact between the phonolitic pyroclastic deposit and the upper lava flow. ......................................................................................................................93 Figure 4.13: Photograph of the small shear test apparatus SHEAR1 ...................................................98 Figure 4.14: Photograph of the large shear test apparatus ...................................................................98 Figure 4.15: Triaxial test apparatus TRIAX1 for cell pressure up to 1700 kPa. ................................101 Figure 4.16: Triaxial cell of TRIAX2 apparatus for cell pressure up to 5000 kPa. ............................101 Figure 4.17: Fe2O3 - content versus SiO2 -content for the twelve hand samples using XRF. ...............103 Figure 4.18: Rb - content versus SiO2 - content for the twelve hand samples using XRF. ..................105 Figure 4.19: X-ray diffractograms of the twelve samples divided into three groups............................107 Figure 4.20: ESEM –photograph showing the open microstructure of the intact soil...........................109 Figure 4.21: ESEM - photograph showing the compacted microstructure of the broken soil ..............109 Figure 4.22: ESEM –photograph showing a bonding between two particles in the intact soil ..............110 Figure 4.23: ESEM –photograph showing a bonding between two particles in the intact soil ..............110 Figure 4.24: ESEM –photograph showing a bridge –like bonding between two particles in the intact soil111 Figure 4.25: ESEM –photograph showing a zoom of a bridge –like bonding between two particles in the intact soil.....................................................................................................................111 Figure 4.26: ESEM –photograph showing a failed, bridge - like bonding between two particles in the broken soil...................................................................................................................112 Figure 4.27: Particle size distribution curves of the residual soil samples. .........................................113 Figure 4.28: Vertical strain - time curves for different vertical stresses due to first time loading. .......115 Figure 4.29: Creep effect during the secondary compression phase over an extended duration. ..........116 Figure 4.30: Primary compression (a) and secondary compression (b) versus vertical stress. .............117 Figure 4.31: Void ratio versus vertical stress from three oedometer tests on undisturbed samples. .....118 Figure 4.32: Void ratio vs. vertical stress of undisturbed and remoulded specimens using standard oedometer tests. ...........................................................................................................119 Figure 4.33: Results of direct shear test reloading the same initially undisturbed specimen in apparatus SHEAR1. ....................................................................................................................120 Figure 4.34: Determination of the shear strength values carried out by the drained direct shear test. ..121 Figure 4.35: Stress – strain curves for undisturbed specimens from direct shear tests using SHEAR2. ....................................................................................................................122 Figure 4.36: Horizontal strain versus τ/σn’ratio for different normal stresses and both undisturbed and remoulded specimens. ..................................................................................................124 Figure 4.37: Horizontal strain versus shear stress and void ratio during direct shear test of an undisturbed specimen with normal load of 5.197 MPa. .................................................125 Figure 4.38: Mohr-Coulomb failure planes for different shear strengths obtained from tests in the SHEAR1 apparatus. ....................................................................................................126. ix.
(12) Figure 4.39: Mohr-Coulomb failure planes for the different shear strengths obtained from tests in the SHEAR2 apparatus. ....................................................................................................128 Figure 4.40: Mohr-Coulomb failure planes obtained from peak shear strength values and the calculated angle of friction ...........................................................................................................129 Figure 4.41: Failure zone of undisturbed specimen after a direct shear test........................................130 Figure 4.42: Failure zone observed in residual soil RS3....................................................................130 Figure 4.43: Shear strength versus horizontal displacement during ring shear tests ............................131 Figure 4.44: Void ratio versus effective confining stress during confining pressure phase of triaxial tests using TRIAX2.............................................................................................................133 Figure 4.45: Void ratio vs. mean effective stress during failure phase of undrained and drained triaxial tests.............................................................................................................................134 Figure 4.46: Undrained triaxial tests on undisturbed specimens at low effective confining stress obtained from TRIAX1..............................................................................................................135 Figure 4.47: Drained triaxial tests on undisturbed specimens at low effective confining stress obtained from TRIAX1..............................................................................................................136 Figure 4.48: Stress paths of undrained triaxial tests on undisturbed specimen using TRIAX1............137 Figure 4.49: Stress paths of drained (dashed lines) and undrained (solid lines) triaxial tests on undisturbed specimen using TRIAX1. ..........................................................................137 Figure 4.50: Undrained triaxial tests on undisturbed specimens at high effective confining stress obtained from TRIAX2................................................................................................138 Figure 4.51: Drained triaxial tests on undisturbed specimen at high effective confining stress obtained from TRIAX2..............................................................................................................139 Figure 4.52: Stress paths of undrained triaxial tests on undisturbed specimen applying low and high confining pressures. .....................................................................................................140 Figure 4.53: Stress paths of drained (dashed line) and undrained (solid line) triaxial tests on undisturbed specimen applying low and high confining pressures.....................................................140 Figure 4.54: Peak and residual strengths obtained from drained (CD) and undrained (CU) triaxial tests on undisturbed specimen. .............................................................................................142 Figure 4.55: Void ratio vs. effective confining stress of undisturbed (RS1-T-CUII) and remoulded (RS1-T-CUIr) specimens during isotropic compression ................................................144 Figure 4.56: Comparison between undrained triaxial tests on undisturbed (straight line) and remoulded (dashed line) specimens................................................................................................145 Figure 4.57: Stress path of undrained triaxial tests on undisturbed (straight line) and remoulded (dashed line) specimen..............................................................................................................146 Figure 4.58: Undisturbed specimen after undrained triaxial test ........................................................147 Figure 4.59: Undisturbed specimen after drained triaxial test ............................................................147 Figure 5.1: Application of the three mechanisms analysed in this study. ............................................153 Figure 5.2: External forces and geometric parameters used in LEM2. ...............................................157 Figure 5.3: External forces and geometric parameters used in UBM. ................................................160 Figure 5.4: Geometry of the 2D models used in the global limit stability analysis ..............................166 Figure 5.5: Meshes of the 2D models used in the FD (a) and FEM (b) analysis. ................................167 Figure 5.6: Mesh of the 3D FEM-model representing the simplified preslide morphology of the La Orotava valley area......................................................................................................168 Figure 5.7: Influence of slope angle (a) and Lon/Loff –ratio (b) on the stability of volcano slopes using LEM. ..........................................................................................................................170 Figure 5.8: Influence of material property (a) and level of water table (b) on the stability of a common volcano slope using LEM.............................................................................................171 Figure 5.9: Typical circular failure surfaces for a simplified volcano slope using LEM. ....................172. x.
(13) Figure 5.10: Influence of horizontal seismic acceleration, a, and, inclination of the water table, β, on the stability of a simplified volcano slope using LEM.........................................................173 Figure 5.11: Influence of magma overpressure, Pmo, owning to dike intrusion on the stability of volcano slopes using LEM. .......................................................................................................174 Figure 5.12: Stability analysis for the La Orotava valley using LEM. ...............................................175 Figure 5.13: Typical circular failure surfaces for the simplified preslide La Orotava model using LEM.176 Figure 5.14: Influence of average ground acceleration, a, on the stability of a common volcano slope using UBM..................................................................................................................177 Figure 5.15: Influence of horizontal stress owning to dike intrusion on the stability of volcano slopes using UBM..................................................................................................................178 Figure 5.16: Influence of vertical shear stress due to caldera collapse on the stability of volcano flanks using UBM..................................................................................................................179 Figure 5.17: Comparison of the destabilising influence of the three mechanisms using UBM .............180 Figure 5.18: Destabilising influence of combinations of external mechanisms using UBM.................181 Figure 5.19: Shear stress distribution and intensity corresponding to a horizontal stress due to dike intrusion (a) and caldera collapse with a vertical shear stress (b)...................................182 Figure 5.20: Zoom of the zones corresponding to elements in which yielding may occur....................183 Figure 5.21: Influence of horizontal stress due to dike intrusion and vertical shear stress due to caldera collapse on the stress field of the volcano flank.............................................................184 Figure 5.22: Distribution and intensity of Von Mises shear stresses in the entire model after the application of external mechanisms. .............................................................................185 Figure 5.23: Zoom of the distribution and intensity of Von Mises shear stresses after the application of external mechanisms ....................................................................................................186 Figure 5.24: Distribution of Von Mises shear stresses in the 3D FEM model applying a horizontal stress due to dike intrusion.....................................................................................................187 Figure 5.25: Distribution and intensity of Von Mises shear stresses in the upper part of the 3D model applying dike intrusion.................................................................................................188 Figure 5.26: Transverse section through deep, narrow canyon with calculated distribution and intensity of Von Mises shear stresses..........................................................................................189 Figure 6.1: Topography of Tenerife and bathymetry of the northern offshore slopes..........................194 Figure 6.2: Forces acting on a subaqueous sliding mass....................................................................196 Figure 6.3: Topographic / bathymetric profile indicating the main morphologic sections of the northern slopes of Tenerife.........................................................................................................197 Figure 6.4: The effect of the drag forces on the landslide mobility.....................................................198 Figure 6.5: The effect of hydroplaning on the landslide mobility .......................................................199. xi.
(14) LIST OF TABLES Table 2.1: Terminology of mass movements........................................................................................ 5 Table 2.2: Causes of volcanic landslides ............................................................................................12 Table 2.3: Potential causes of large landslides on volcanoes................................................................16 Table 2.4: Volcanic processes and associated seismic activity.............................................................20 Table 3.1: Large landslide events detected around the Canary Islands .................................................27 Table 3.2: Age data with description of rock type and location ...........................................................66 Table 4.1: Samples studied during the geochemical and geotechnical analyses.....................................86 Table 4.2: Consolidation tests carried out on the RS1 sample .............................................................96 Table 4.3: Direct shear tests carried out on the RS1-sample................................................................97 Table 4.4: Ring shear tests carried out on the RS1 sample ..................................................................99 Table 4.5: Test conditions and type of apparatus during the triaxial tests ..........................................100 Table 4.6: Contents of selected major elements (units in wt %). ........................................................102 Table 4.7: Contents of selected trace elements (units in ppm)............................................................104 Table 4.8: Physical properties of the residual soil sample RS1..........................................................114 Table 4.9: Consolidation parameters for different vertical stress. ......................................................116 Table 4.10: Stress-strain parameters obtained from the oedometer tests on undisturbed specimens.....118 Table 4.11: Shear strengths for three different normal stresses using SHEAR1. ................................121 Table 4.12: Shear strengths for different normal stresses using SHEAR2..........................................123 Table 4.13: Angle of friction and cohesion for the three shear strengths obtained from SHEAR1 applying low normal stresses........................................................................................127 Table 4.14: Angle of friction and cohesion for the three shear strengths obtained from SHEAR2 applying high normal stresses.......................................................................................128 Table 4.15: Residual shear strength and friction angles obtained from the ring shear tests. ................131 Table 4.16: Permeability values obtained in triaxial cells and applied cell pressure, back pressure (inlet) and pore pressure (outlet).............................................................................................132 Table 4.17: Void ratios during triaxial tests......................................................................................133 Table 4.18: Peak and residual stress obtained from drained and undrained triaxial tests for undisturbed and remoulded specimens.............................................................................................141 Table 4.19: Peak and residual angles of friction obtained from CU and CD-tests. .............................142 Table 4.20: Calculation of the apparent friction angle and estimate of the pore pressure parameter A for different effective confining stresses. ............................................................................143 Table 5.1: Agents analysed during the stability calculations and approaches applied. ........................151 Table 5.2: Modelling sequences during the FD analysis indicating the applied stress, material property and boundary conditions. .............................................................................................162 Table 5.3: Modelling sequences during the FEM analysis indicating the applied stress, material property and boundary conditions. .............................................................................................164 Table 5.4: Definition of the standard geometric parameters used in the preliminary calculations of LEM and UBM analyses.......................................................................................................165 Table 5.5: Definition of the standard material parameters used for the LEM and UBM. ....................166. xii.
(15) Introduction. 1 INTRODUCTION 1.1 Hazards from large volcanic landslides Large volcanic landslides are one of the most hazardous geological processes. Their volumes can exceed tens or even hundreds of cubic kilometres covering areas as large as 1000 km2. Moreover, their velocity easily surpasses 100 m/sec and runout distances greater than 100 km have been observed. After the 1980 eruption and associated debris avalanche at Mount St. Helens (Voight et al., 1981), the analysis of large volcanic landslides gained worldwide attention and their importance has been repeatedly demonstrated by disastrous events, which claimed thousands of lives (e.g. Nevados de Huascarán in 1970; Plafker and Ericksen, 1978 or Nevado de Ruiz in 1985; Pierson and Janda, 1994). Recent studies show that large volcanic landslides are a common process during the evolution of large stratovolcanoes (Siebert, 1984; Ui et al., 1986). Large-scale failures have been observed world-wide at several hundred volcanoes and have occurred about every 25 years during the last 500 years (Siebert, 1992; McGuire, 1996b; Voight and Elsworth, 1997). The occurrence of large volcanic landslides represents different hazards for the neighbouring population. The direct hazards include not only the debris avalanche and associated lahars, but also the possibility of explosive eruptions and lateral blasts which can be triggered by the opening of the magma conduit due to the decompression caused by slope failure (e.g. Mt. St. Helens or Bezymianny; Siebert et al., 1987). In addition to these direct hazards, large landslides at coastal or oceanic volcanoes can produce tsunamis and affect areas far away from the volcano.. 1.2 Problem Many causes refering to large volcanic landslides have been proposed, but their explanation in mechanical terms has not been resolved yet. Generally, failure of natural slopes occurs only if the slope angle exceeds the friction angle of the soil or rock, assuming zero cohesion and no external forces. Friction angles of the majority of materials composing volcanoes are assumed to have values between 30 and 40 degrees (Voight et al., 1983; Iverson, 1995; Voight and Elsworth, 1997) and have a negligible cohesion. Therefore, they build stable slopes from a geomechanical point of view. However, many large landslides in volcanic areas are characterised by failure surfaces with a small inclination and a gentle slope angle. The giant Hawaiian landslides, for example, are assumed to slide over a failure surface probably inclined less than 10 degrees and slope angles prior to failure are likely less than 12° and almost certainly less than 19° (e.g. Dieterich, 1988, Iverson, 1995). An additional feature increasing the difficulty of the analysis of large volcanic landslides is the scale effect. Failures at volcanoes can involve up to 20 % of the whole edifice and surpass the volumes of non-volcanic landslides by two or three orders. Conventional causes such as groundwater pore pressures are not able to initiate such giant mass movements with failure lengths and widths of several kilometres (Hürlimann et al., 1997). Hence, there must exist significant external forces that enable the failure of volcano flanks. These external forces are commonly generated by volcanic or tectonic processes. The destabilising effects of volcanic activity are very complicated, while the tectonic processes mainly include seismic shocks. Explosive and effusive eruptions, magma injection, hydrothermal alteration, volcanic spreading, caldera collapse episodes and volcanic or volcano-tectonic tremors are often related to each other and are characterised by many direct and indirect influences on the stability of volcanoes. Detailed, comprehensive geotechnical studies analysing the stability of volcano flanks are not common and analyses including a mechanical approach hardly exist. The causes of large volcanic landslides have not yet been resolved and many hypotheses have been proposed without geotechnical data.. 1.
(16) Introduction. 1.3 Test site The La Orotava valley has been selected as test site of the geotechnical analysis. The valley is located at the northern flank of Tenerife and covers an area of more than 100 km2. The origin of the La Orotava and the two other valleys located on the island has been a controversy since the last century. Their landslide origin, however, is supported by recent bathymetric studies that have identified voluminous landslide deposits on the northern and south-eastern submarine slopes of Tenerife (Watts and Masson, 1995; Teide-Group, 1997). Apart form the analysis of the La Orotava events, many stability calculations have been carried out for general volcano slopes in order to facilitate the application of the results to other locations with volcano instabilities. Therefore, the landslide events in the La Orotava valley have been used as a practical case trying to establish general rules that can be applied to other volcanoes.. 1.4 Goals The main goals of this work is to answer three fundamental questions refering to large volcanic landslides: 1) 'Why such large mass movements can occur?' 2) 'Where is the failure located?' 3) 'When does failure occur?' The first question evaluates the potential causes of large volcanic landslides and investigates the significant features influencing on the mechanical stability of volcanoes. The second point analyses the morphologic and geologic features, which destabilise the volcano flank and may evolve into the limits of the landslide. The definition of potential weak layers composing the volcano and creating potential slip surfaces of the failures is another aim concerning this second question. The third question concerning the timing of the failure is perhaps the most difficult to answer. If large volcanic landslides have to be predicted, a wide range of disciplines as distinct as geotechnics, material science, fluid mechanics, seismology, volcanology and geodesy must be brought together. In this work, this point is only studied marginally and without the aim of establishing an exact predictive timing. Another aim of the study is the improvement of the insights regarding to the natural examples that have occurred in the La Orotava valley. The potential causes of the large volcanic landslides occurred in the valley and the chronological, geological and morphological evolution of the valley are two important topics of this research. On the other side, the evaluation of the influence of the volcanic and tectonic activity on the initiation of the failures is an additional objective. Moreover, another aim is the application of the results obtained from the study of the La Orotava events to other locations. The determination of common roles and critical features concerning volcano stability is an important point of the study. At last, the understanding of the dynamics and an explanation refering to the great mobility of large volcanic landslides on oceanic islands is another aim.. 2.
(17) Introduction. 1.5 Thesis structure After some introductory statements, it follows the State-of-the-art refering to large landslides in general and to large volcanic landslides in particular. In addition, the potential causes of large failures at volcano flanks are reviewed. The Chapters 3 to 6 contain the main part of the text and are structured as in a standard geotechnical analysis of mass movements. The four Chapters include the site investigation, the laboratory analysis, the stability analysis and the mobility analysis. Each Chapter starts with a short introduction and ends with some conclusions related to the Chapter.. Chapter 3: Site investigation. The site investigation gives first an overview of the landslide events occurred around the Canary Islands. Second, it describes the geology, morphology and volcanic activity of Tenerife. Then, the results of the geomorphologic analysis concerning the whole island are presented including the northern subaerial and submarine flank of Tenerife and specially the La Orotava valley. The following geologic analysis mainly focuses on the La Orotava valley and its adjacent areas. At the end, the inferred preslide conditions are explained. Although the site investigation has been performed on Tenerife, some of the findings are proposed to be common in other locations. Chapter 4: Laboratory analysis. The laboratory analysis can be divided into two test programmes both of them studying a residual soil (paleosol) found in the La Orotava valley which has been considered a potential zone for the slip surface. First, the results of the mineralogical analysis, chemistry and microstructure of this soil are described and second, geomechanical parameters of the material are explained using the results obtained from the geotechnical tests. A special interest is focussed on the bonding or cementation of the soil which is a particular feature of this material. Chapter 5: Stability analysis. This Chapter provides an overview of the analytical and numerical models used in the study of the stability of volcano flanks. First, global limit equilibrium models have been used to carry out a quantitative study calculating a global factor of safety of the volcano flank, and second, the numerical continuum models based on Finite Element and Finite Differences have been employed to perform a study computing the stress-strain field inside the flank. Chapter 6: Mobility analysis. Large volcanic landslides on oceanic islands are characterised by a huge mobility. This Chapter analyses this particular feature incorporating novel ideas such as hydroplaning or drag forces into well-known mobility models. Finally, some concluding remarks and ideas refering to future works are presented. Then, the reference list and an Appendix including the publications arising from this thesis are completing the text.. 3.
(18) State of the art. 2 STATE OF THE ART 2.1. Terminology of mass movements. Slope movements can be classified in many ways, each one having some usefulness in emphasising features appropriate to the recognition, avoidance, control, correction, or other purpose for the classification. The classification of Varnes (1978) listed in Table 2.1 is one of the most used and complete in its way. Generally, large volcanic mass movements are classified as 'slides' including translational slides and rotational slumps. Slumps are slow-moving, rotational failures, deeply rooted in the volcanic edifice and are characterised by only a slight disruption of the structural coherence. Such type of failure has principally been found on the Hawaiian ridge (Moore et al., 1989; Moore et al., 1994). Translational slides often evolve into avalanches or flows. The term debris avalanches is rather usual for such events and was introduced after the 1980 eruption of Mount St. Helens and its associated destructive sector collapse (Voight et al., 1981; Voight et al., 1983; Glicken, 1996). Debris avalanches are rapid moving, more superficial failures than slumps and form amphitheatre-like scars and extensive deposits. The movement is characterised by flowage in a dry or wet state, or both, and the initial massive sliding blocks disintegrate into fragments ranging in size from small particles to blocks of hundreds of meters. If the debris avalanche has a large water content, its matrix may continue to flow downslope as a lahar after its coarser parts have come to rest. Lahar is an Indonesian word describing mudflows and debris flows that originate from the slopes of a volcano. Both types have an extremely great mobility, can flow at velocities exceeding 100 m/sec and travel over 100 kilometres from a volcano. In summary, the most common types of large mass movements occurring at volcanoes can be described by the classification of Varnes (1978) as translational or rotational slides and flows. Sometimes the same event can start as a slide, then evolve to a debris avalanche and ending as a lahar (Iverson et al., 1997; Mothes et al., 1998). Hereafter the general term 'landslide' is used for all types of mass movements.. Table 2.1: Terminology of mass movements (after Varnes, 1978) TYPE OF MATERIAL TYPE OF MOVEMENT ENGINEERING SOILS BEDROCK. FALLS TOPPLES Rotational SLIDES Translational LATERAL SPREADS FLOWS COMPLEX. Predominantly Predominantly coarse fine Rock fall Debris fall Earth fall Rock topple Debris topple Earth topple Few Rock slump Debris slump Earth slump units Rock block slide Debris block slide Earth block slide Many units Rock slide Debris slide Earth slide Rock spread Debris spread Earth spread Rock flow Debris flow Earth flow (deep creep) (soil creep) Combination of two or more principal types of movement. 5.
(19) State of the art. 2.2. Examples of large landslides. In contrast to large volcanic landslides, non-volcanic failures of similar scale occur more frequently and diverse studies refering to such events have been published in historic times. However, there is not a big amount of comprehensive geotechnical works analysing large landslides since the majority of landslide studies focuses on shallow, small-scale event. Figure 2.1 shows some geometric relations of volcanic and non-volcanic landslides indicating the volume and the mobility of the events. The mobility is represented by the H/D-ratio where H is the vertical height and D is the runout distance. Lower H/D-ratios indicate a greater mobility and vice versa. A clear relationship between higher volumes and greater mobility can be seen which confirms this well-known correlation between volume and runout distance (Heim, 1932; Hsü, 1975; Corominas, 1996). Figure 2.1 shows that the volcanic landslides are generally more voluminous than the non-volcanic ones, and that mass movements on volcanoes are characterised by an enormous mobility and great runout distances. Moreover, the graph indicates that landslides on volcanic islands surpass the maximum volume of terrestrial volcanic events by one or two magnitudes. Maximum volumes exceeding 1000 km3 have been detected around the Hawaiian archipelago (Moore et al., 1989; Moore et al., 1994).. H/D. 1.00. Fli Pop Sai. 0.10. Hel. Soc Sha. Ali Wai. Non-volcanic landslide. Nuu. Continental volcanic landslides Landslides on volcanic islands 0.01 0.01. 0.10. 1.00. 10.00. 100.00. 1000.00. 3. Volume [km ]. Figure 2.1: Mobility versus volume of non-volcanic and volcanic landslides. Sai: Saidmarreh, Fli: Flims, Hel: Mt. St. Helens, Sha: Shasta, Soc: Socompa, Pop: Popocatepetl, Ali: Alika, Wai: Wailau, Nuu: Nuuanu. Data after Hsü(1975), Harrison and Falcon (1937), Ui (1983), Siebert (1984), Moore et al. (1989), Lipman et al. (1988) Urgeles et al.(1997,1999).. In the following, some non-volcanic large landslides will be described, and afterwards the most important volcanic events at terrestrial volcanoes and volcanic islands will be presented. The classic landslide at Elm, Switzerland, in 1881 is perhaps the best observed historical event of its kind and was comprehensively investigated just after the catastrophe (Buss and Heim, 1882; Heim, 1932). The failure was caused by quarry activity at the base of the slope, occurred after recent heavy. 6.
(20) State of the art rains and involved two rockslides that overrun the village of Elm. While the study of these events has mainly focussed on the high mobility, the failure mechanisms have only been analysed marginally. After the Vaiont Dam catastrophe in Italy, which occurred on October 2, 1963, and caused at least 1800 casualties, several geotechnical hypotheses about the failure mechanisms of large landslides have been proposed. There, actively creeping for at least 3 years took place before the slope failed suddenly within the Malm formation consisting thin-bedded limestone intercalated with clays (Bromhead, 1992). The failure occurred in association with a rise in the reservoir level, but the superposed effect of artesian groundwater conditions, progressive failure or pore fluid vaporisation may also have been involved (Skempton, 1966; Voight, 1978c). The slide involved a total volume of material of 0.25 km3 which drove the water over the dam generating a huge wave. The Flims, Switzerland, rockslide in prehistoric epoch with an estimated volume of 12 km3 (Heim, 1932) is assumed to be one of the largest landslides ever occurred in mountainous terrain. A huge block of Jurassic limestone having a thickness of 600 - 800 m slid on a bedding plane with a dip of 11 - 16º and dammed the Rhine valley along 11 km. The Rhine has now cut a canyon through the landslide deposit and the scarps of this canyon show that the mass had moved almost as a single unit and not as completely fragmented (Goguel, 1978). Another enormous prehistoric landslide is the Saidmarreh event in southwestern Iran (Harrison and Falcon, 1937; Watson and Wright, 1967). Involving a total volume of about 20 km3, it had been considered to be the largest subaerial non-volcanic landslide known on earth. The failure with a width of about 5 km, a length of 15 km and a thickness of about 300 m occurred at a slope composed of limestone dipping about 20°and resting on thin bedded sequence of marl and limestone. The immediate trigger of the landslide is stated to have been an earthquake, but evidence simply notes that the region is seismically active (Watson and Wright, 1967). After the Elm event, the second classical historic landslide in the Swiss Alps is the Goldau event in 1806 (Heim, 1932; Zehnder, 1988). The Goldau or Rossberg rockslide involved massive ‘ conglomerate layers, 60 to 120 m thick, that slid on marls dipping between 11 and 30°. A total volume of about 0.04 km3 slid off after heavy rains, covered the village of Goldau and killed more than 400 persons. There are many other large landslide events that have occurred in historic times, but the majority of them have not been analysed properly. The mechanics of the failures have not been studied, and we often only know where and when they occurred and how many fatalities were caused. The study of large landslides is a young research topic and scientific analyses started at the end of the last century. Heim's masterpiece 'Bergsturz und Menschenleben' (Heim, 1932) was the beginning of several fundamental overviews published in this century and refering to landslides (e.g. Voight, 1978b; Eisbacher and Clague, 1984; Dikau et al., 1996). Large volcanic landslides can exceed several cubic kilometres in volume and generally surpass the volumes of non-volcanic events by two or three orders of magnitude (Figure 2.1). Recent studies indicate that catastrophic failures have occurred world-wide at several hundred volcanoes (Ui et al., 1986; Siebert et al., 1987). Siebert (1992) calculated that large volcanic landslides have taken place globally by an average of four times a century during the past 500 years, which was commented to be an underestimated frequency concerning the big amount of failures during this century (McGuire, 1996b). Moreover, it is assumed that 75 % of the Andean volcanoes with heights in excess of 2500 m have experienced one or more failures (Francis, 1994), and more than 100 events have been observed at Japanese Quaternary volcanoes (Inokuchi, 1988). The most important historic eruptions associated with large volcanic landslides occurred on Mount St. Helens in 1980, on Bezymianny Volcano in 1956, on Bandai Volcano in 1888 and on Unzen in 1792 (Gorshkov, 1959; Moriya, 1980; Lipman and Mullineaux, 1981; Voight et al., 1983; Siebert et al., 1987). The best documented and analysed event is the one which was associated with the climatic eruption of Mt. St. Helens on May 18, 1980 (Lipman and Mullineaux, 1981; Voight et al., 1981; Voight et al., 1983; Voight et al., 1985; Glicken, 1996). The destructive failure was preceded by several months of magma intrusion and associated large-scale deformation of the volcano flank. The collapse started with a 5.2 magnitude earthquake (Endo et al., 1981) and the north slope began to slide 7.
(21) State of the art northwards along a previously formed fracture system. A slide block I (Figure 2.2) failed within seconds producing a lateral blast by the explosion of exposed magma and hydrothermal chambers (Voight et al., 1981). At the same time the retrogressive failure continued in the unstable crown behind of slide block I and caused the failure of two additional slide blocks II and III. The multiple slope failures led to the development of an enormous debris avalanche that travelled downward in pulses involving material with a volume of about 2.5 km3 and burying an area of about 60 km2 (Voight et al., 1981; Voight et al., 1983; Glicken, 1996). The event at Bezymianny is assumed to have occurred similar to the one at Mt. St. Helens including retrogressive failures that produced a landslide event with a total volume of about 0.8 km3 (Gorshkov, 1959; Siebert et al., 1987). At Bandai, the landslide included a total volume of about 1.5 km3 and covered an area of 34 km2. The volcano flank failed probably in a retrogressive sequence including three main stages during a phase of several phreatic eruptions (Moriya, 1980; Siebert et al., 1987; Voight and Elsworth, 1997). In contrast, the landslide at Unzen in 1972 is assumed to be caused by the saturation of the volcano by hydrothermal waters and intense seismicity (Siebert et al., 1987). The debris avalanche of about 0.34 km3 entered the sea and generated a catastrophic tsunami that caused about 15000 fatalities. Other examples of catastrophic landslides on volcanoes have been taken place without associated explosive eruptions, but have also caused thousands of casualties. The landslide at Nevados Huascarán, Peru, in 1970 caused an estimated 18000 fatalities. The event was triggered by the strong 7.7 magnitude earthquake situated 130 km to the west off the coast of Peru. The mass movement originated as a rock and ice fall on the sheer west face of the peak and incorporated a total volume on the order of 0.05 to 0.1 km3. In 1962, a similar event with a smaller volume killed about 4000 people. Both failures were finally developed into lahars characterised by extreme velocities and large horizontal runout distances. At Nevado del Ruiz volcano, Colombia, a small explosive eruption in 1985 melted the ice cap at the summit and generated a large lahar (0.017 km3) causing more than 20000 casualties (Pierson and Janda, 1994). Similar recent examples, but without fatalities, were observed at Mt. St. Helens in 1982 and 1983 and at Redoubt volcano, Alaska, in 1989 causing lahar-type mass movements with volumes up to 0.034 km3. At the Mt. Rainier, more than 55 large mass movements occurred during the Holocene and future events present significant risks to local communities (Crandell, 1971). The mass movements include debris avalanches and lahars with volumes up to 3 km3 and runout distances of more than 100 km such as the well known Osceola mudflow (Vallance and Scott, 1997). 3000. Altitude in m. III 2000. II. I. 1000. 0. 1000. 2000. 3000. 4000. 5000. 6000. 7000. Horizontal distance in m. Figure 2.2: Profile of Mt. St. Helens landslide. Dashed line indicates the preslide topography. Thick lines show the failure surfaces and the approximate boundaries of the three slide blocks. Grey shaded area indicates the dome intrusion (after Voight et al., 1983). 8.
(22) State of the art Recent submarine geophysical techniques have enabled the detection of many extensive landslide deposits on the sea floor around volcanic islands caused by giant slope failures. The major amount of such events have been identified around the Hawaiian archipelago (Moore, 1964; Lipman et al., 1988; Moore et al., 1989; Garcia and Hull, 1994; Moore et al., 1994; Moore et al., 1995), but also around the Canary Islands (Holcomb and Searle, 1991; Watts and Masson, 1995; Masson, 1996; Urgeles et al., 1997; Carracedo et al., 1999; Urgeles et al., 1999), La Réunion Island (Chevallier and Bachelery, 1981; Duffield et al., 1982; Lénat et al., 1989; Labazuy, 1996), Stromboli (Kokelaar and Romagnoli, 1995), St. Augustine Island (Begét and Kienle, 1992; Siebert et al., 1995; Waythomas, 1997), Ritter Island (Johnson, 1987), Tristan da Cunha (Holcomb and Searle, 1991), Martinique (Semet and Boudon, 1994), Cape Verde (Elsworth and Day, 1999) and others. Most of these studies, however, have focussed on the description of the offshore bathymetric data including the accumulation zone of the landslides and an analysis of the mechanics of the failures mostly lacks. Only the Hilina event on Mauna Loa, Hawaii, and the Piton de la Fournaise failures on La Réunion have been investigated more comprehensively, because both events are characterised by active displacements currently measured. The Hilina event, a typical slump, is an enormous, active creeping landslide that involves most of the southeast flank of Kilauea volcano (Figure 2.3). The slump covers about 5200 km2, is about 100 km wide and 40 km long and has an inferred maximum depth of 5 km (Moore et al., 1989). Its location on an active volcano induces that the mass movement is influenced by sustained magmatic, seismic and hydrothermal activity. The head scarp of the slump is located adjacent to the active East Rift zone and the Kilauea caldera. The recurrent landslides on Piton de la Fournaise volcano were defined as debris avalanches and include at least three different events (Labazuy, 1996). A total volume of 550 km3 was estimated for the entire submarine accumulation zone. The multiple failures cut a huge amphitheatre into the volcano edifice with lateral scarps of heights between 100 and 300 m. The amphitheatre lies between two rift zones and the large Enclos caldera is located at its head (Figure 2.3a). Recent magma intrusions and flank eruptions provoked seaward displacements of the materials filling the amphitheatre and a big part of the volcanic edifice (Duffield et al., 1982). The examples of the Hilina and Piton de la Fournaise landslides have not only been selected due to their big amount of data, but also because of the volcanic setting adjacent to the failures which are similar to the one on Tenerife. The La Orotava valley events and both of the described examples are characterised by the presence of an important rift zone and of a collapse caldera.. 9.
(23) State of the art. a). Enclos caldera. N. Altitude in m. 2000 sea level. 0 -2000. 0. b). 10000. N. Altitude in m. S. 2000. 20000. Koae fault system. Kilauea caldera. S Hilina fault system sea level. 0 -2000. 0. 10000. 20000. N. c) 2000 Altitude in m. S Hilina fault system. East rift zone. sea level. 0. -2000. 0. 10000. 20000. Horizontal distance in m. Figure 2.3: Cross sections of landslides on volcanic islands. a) Piton de la Fournaise on La Réunion with Enclos caldera, (b) Hilina landslide with Kilauea caldera, and (c) Hilina landslide with east rift zone. Arrows indicate slope movements. Dashed lines represent the inferred ring faults of the calderas, thick solid lines show intruding dikes and grey-shaded area indicates the magma chamber. Modified from Duffield et al. (1982).. 10.
(24) State of the art. 2.3. Causes of large landslides. Generally, large landslides originate either by increasing the destabilising forces (driving forces) or by reducing the strength of the materials involved, or both. The causes of slope failures include: 1) preparing factors; and 2) triggering mechanisms. Landslides can have several preparing factors destabilising the natural slope, but only one mechanism finally triggering the failure. By definition a trigger is an external stimulus such as intense rainfall, a seismic shock or another mechanism that causes a near immediate response in the form of a landslide by rapidly increasing of the stresses or by reducing the strength of slope materials (Turner and Schuster, 1996). On the other hand the preparing factors or destabilising processes can include geological, morphological, physical and human components and can affect the slope stability over days, weeks or even years. Large non-volcanic landslides mainly have many preparing factors including geologic features such as bedding and foliation, rock alteration from weathering, the history of previous motions, hydrologic or climatologic variations and morphologic features, amongst others. On the other side, the triggering mechanisms of such large events include strong and/or long-lasting rainfalls, rapid snow melts, strong earthquakes or a combination of different factors (Heim, 1932; Voight, 1978c; Eisbacher and Clague, 1984; Turner and Schuster, 1996). In contrast, the causes of large volcanic events are more complex due to the influence of volcanic activity. The volcanic activity produces many different processes destabilising directly or indirectly the natural slopes. These processes include explosive or effusive eruptions, volcanic or volcano-tectonic tremors, magma intrusion in form of dikes, sills or domes, inflation or deflation of the magma chamber, hydrothermal alteration and caldera collapse episodes. The complexity of factors influencing on the mechanical stability of volcanic slopes can been seen in Table 2.2, where non-volcanic and volcanic agents are listed. In this study, however, only some of these factors have been studied including agents of point 1 (morphologic and geologic features), point 2 (e.g. earthquakes) and point 3 (pore fluid pressure enhancement and changes in structure).. In the following Sections the most important causes will be described dividing into non-volcanic and volcanic causes. Sometimes, the division between non-volcanic and volcanic causes is diffuse because they are often correlated with each other. Hydrothermal alteration can be taken as such an example since the hydrogeological setting with the existence of water and the volcanic activity generating heat and gas are two indispensable factors for this process. Another example are the seismic shocks which can be caused by a tectonic, volcano-tectonic or volcanogenic origin.. 11.
(25) State of the art Table 2.2: Causes of volcanic landslides (after Voight and Elsworth, 1997). 1. Inherent causes • Initial composition • Texture : loose, porous, weak materials are slide-prone • Bedding attitude relative to slope face • Layering sequences in relation to strength and permeability • Discontinuity systems : faults, joints, dikes, bedding planes • Slope forming process history, movement history : bedding slip and fault slip history and orientation of movement • Initial physicochemical setting conditions of weathering and alteration • History of seismicity and seismic damage • Ambient (seasonal) groundwater conditions 2. Increase of shear stress • Removal of lateral or underlying support of slopes - Erosional processes producing, steepening, or undercutting natural slopes - Prior mass movements - Phreatic explosion near base of slope • Static loading - Natural deposition : slope or river sedimentation volcanic sedimentation (tephra, lava) - Weight of water added by natural precipitation or by exsolved volatiles - Seepage pressure and joint water pressures - Magma pressure - Swelling pressures in expansion clays • Dynamic loading - Regional or local tectonic earthquakes - Vibrations from volcanic earthquakes, explosion and eruptive processes - Vibrations from adjacent, rapidly moving landslides • Increase of surface slope - Magma intrusion related deformation (cryptodomes) - Regional tectonics (slow or episodic change) - Slope changes due to depositional processes 3. Reduction of shear strength • Physicochemical factors - Hydrothermal alteration - Softening of clays - Hydration of clay minerals - Ion exchange of clays - Weathering - Solution of grain cement - Decomposition of organic materials - Physicochemical fracturing • Pore fluid pressure enhancement - Heavy rainfall or rapid snowmelt - Changes in groundwater flow regime - Pore-pressure changes in aquifers adjacent to magma intrusion, due to poroelastic deformation, thermal expansion, or separation of gas from magma chambers - Pore-pressure changes due to hydrothermal processes - Thermal expansion of pore fluid due to frictional slip -Vibration induced pore fluid pressure rise - Shear deformation induced pressure rise - Consolidation seepage induced by surcharge - Base level change in reservoirs, lakes or oceans - Flow boundary condition changes (e.g. iced or plugged flow egress points) - Enhanced glacier melting due to increased geothermal flux • Changes in structure - Disturbance, remoulding - Particle reorientation due to slip or dynamic loading ; peak to residual strength loss - Grain collapse in altered, weakened tephra deposits - Fracturing and loosening of valley walls, stress relief etc. - Deep seated fracturing associated with magma intrusion, stress relief, geothermal processes, physiochemical alteration - Adjustments to groundwater flow paths; slope drainage enhanced or impeded. 12.
(26) State of the art. 2.3.1 Non-volcanic factors Morphologic factors The slope angle has traditionally been assumed to be one of the most important morphologic features which influences the stability of the volcano flanks. The slope angles of 55 Quaternary volcanoes, which have undergone major slope failure, are shown in Figure 2.4. Large landslides appear most likely when the slope angle exceeds 20°, but mass movements on volcano flanks with an inclination of less than 10° have also been observed (Siebert, 1984). While the events with slope inclinations of about 30°mainly occurred at steep-sided stratovolcanoes, the events with a slope angle of about 10°are characteristic for volcanic islands. In addition, the comparison of the elevation above base of 845 Holocene volcanoes with that of volcanoes which have suffered large landslide events suggests that failure can occur with edifice heights as low as 500 – 1000 m. The most critical height of volcanic edifices, however, seems to be between 1000 and 1500 m (Siebert, 1984). Similar results revealed the analysis of 55 rock avalanches exceeding volumes greater than 106 m3 in mountainous terrains (Hermanns and Strecker, 1999). This study suggests that vertical relief contrasts between the breakaway zone and the toe of the failure must exceed a threshold of 400 m and slope inclinations must be steeper than 20°.. number of events. 10 8 6 4 2 0 0. 10. 20. 30. 40. slope angle [degree]. Figure 2.4: Influence of slope angle on the failure of 55 Quarternary volcanoes (after Siebert, 1984).. Geologic factors The geologic setting including texture, bedding, discontinuities or weathering conditions strongly influences on the stability of natural slopes (e.g. Pearce and O'Loughlin, 1985). The orientation of rock layering and discontinuities, or bedding planes, exfoliation joints and cleavage dipping slope outwards often encourage mass movements, and long-term weathering decreases the frictional resistance of the rock. However, the mechanical properties of the materials composing volcanoes are not well known and geotechnical studies on volcanic deposits hardly exist. Nevertheless, some potential weak layers destabilising the volcano flanks have been proposed by several authors. Weak pyroclastic rocks were detected at Bandai or Stromboli within the volcano slopes (Siebert, 1984) or at the contact with the basement (Van Wyk de Vries and Francis, 1997). Hyaloclastite deposits as a potential slip surface have been proposed for the events on La Réunion and Kilauea volcano (Duffield et al., 1982) and the destabilising effect of a ductile layer of olivine cumulates is another factor found on Hawaiian volcanoes (Clague and Denlinger, 1994).. 13.
(27) State of the art Eisbacher and Clague (1984) defined water saturated pyroclastic deposits and fractured lava flows as soil and rock types with high risk of landslide initiation and described different cases in the western hemisphere: the Dusty Creek landslide in 1963 with a poorly consolidated tuff breccia and columnar jointed dacites, the Pylon Peak event in 1975 with weakly consolidated pyroclastic rocks or the Guatemala landslides in 1976 at steep slopes of Pleistocene pumice deposits.. Hydrologic and hydrogeological factors The relationship between the climate and the groundwater system is a fundamental point in the stability analysis of natural slopes. There is increasing evidence that water plays an important role in the stability conditions of volcanic edifices, as it does in non-volcanic slopes. Pore water pressure controls the strength of the material and thus the slope stability mechanics. The significant effect of pore fluid pressure in the initiation of landslides has mainly been constrained for non-volcanic events (e.g. Iverson et al., 1997), while only theoretical models have been applied to those associated with volcanic events (Elsworth and Voight, 1995; Day, 1996; Voight and Elsworth, 1997). In volcanic environment, hydrothermal alteration does not only play a major role in increasing susceptibility to failure, but the common association of lateral collapse events with phreatic explosions supports a significant involvement by hydrothermal pore fluids in the failure process (McGuire, 1996b). The effects of volcanic activity on the pore fluid pressures and the hydrothermal alteration are the topic of many recent and running research projects and will be discussed in the Section refering to volcanic factors later in this Chapter.. Sea level changes Many of the largest landslide events are located on volcanic islands (Figure 2.1) and the destabilising effect of sea level changes on the stability of the volcanic edifice has been proposed by different authors (Bray, 1977; Firth et al., 1996; McGuire, 1996a; McGuire et al., 1997; Ablay and Hürlimann, 1999). The principal origins of sea level changes are twofold: 1) the global climatic variations with the associated increase of the ice sheets; and 2) the vertical movement of the volcanic island due to magma loading and unloading. The construction and destruction of the volcanic edifice applies a vertical stress to the lithosphere deforming the oceanic crust upwards or downwards. The resulting flexural moat in the oceanic crust can have a depth of up to 2500 m as in Tenerife (Watts et al., 1997) or 1000 m as in Gran Canaria (Funck and Schmincke, 1998). The correlation between mechanical stability of oceanic islands and sea level fluctuations is complex and the destabilising factors include many different processes such as sea wave erosion at the coast, sea water loading onto the submarine volcano flank or pore pressure changes. The most important factor, however, plays the suggested relationship between large rapid sea level changes and its influence on the volcanic activity (McGuire et al., 1997).. Tectonic seismicity Seismicity in volcanic terrains can have tectonic, volcanic or volcano-tectonic origins. Often a clear distinction between tectonic and volcanic earthquakes is difficult. In contrast to purely tectonic dynamics, where all seismic failures can be ascribed to double-couple systems of shear forces acting on two orthogonal planes, the seismic source at active volcanoes may be highly complex, since it often involves interactions between gas and liquid or liquid and solid (Ekström, 1994; Ferrucci, 1995). However, while the tectonic shocks can be characterised by shear failures, the volcanic shocks are generally tensional failures.. 14.
Figure


+7


Documento similar
ABSTRACT Transformation of the Specialized Knowledge of Future Primary Teachers on Fraction Division
From the phenomenology associated with contexts (C.1), for the statement of task T 1.1 , the future teachers use their knowledge of situations of the personal
Abstract: Transepidermal water-loss (TEWL), stratum-corneum hydration (SCH), erythema, elas- ticity, pH and melanin, are parameters of the epidermal barrier function and
In the preparation of this report, the Venice Commission has relied on the comments of its rapporteurs; its recently adopted Report on Respect for Democracy, Human Rights and the Rule
The main goal of this work is to extend the Hamilton-Jacobi theory to different geometric frameworks (reduction, Poisson, almost-Poisson, presymplectic...) and obtain new ways,
The paper is structured as follows: In the next section, we briefly characterize the production technology and present the definition of the ML index as the geometric mean of
In the previous sections we have shown how astronomical alignments and solar hierophanies – with a common interest in the solstices − were substantiated in the
Díaz Soto has raised the point about banning religious garb in the ―public space.‖ He states, ―for example, in most Spanish public Universities, there is a Catholic chapel
teriza por dos factores, que vienen a determinar la especial responsabilidad que incumbe al Tribunal de Justicia en esta materia: de un lado, la inexistencia, en el
