no pueda perdonarte. Aliéntame y nunca te olvidaré.
William Arthur Ward
Chapter 5
Chapter 5: The role of fuels in the resulting heterogeneity of fire severities
Abstract
Large forest fires have become one of the major forest management concerns, due to their consequences at an environmental, social and economical level. These broad-scale disturbances are frequently heterogeneous in their effects across the landscape, due to variations in the factors that influence their final severity: topography, meteorology and fuels. Even though several authors have minimized the role of fuels under severe meteorological conditions, fuels represent the major interest from the point of view of forest management, because they are the only factor that can be modified by humans. The alteration of wildfire behavior through changes in the fuel complex has long be intended, and constitutes the goal of fuel management . While there exists quite a long list of landscape studies dealing with the role of fuels and their influence on fire severity patterns, less effort has concentrated on lower-scale forest properties, such as the age and size of the trees, density or fuel arrangement, in terms of fuel continuity. This study analyses these lower-scale properties in an area affected by a large fire in North-eastern Spain, where fire had a patchy dynamic, leaving a heterogeneous combination of fire severities. It tests if, under moderate weather conditions, the structural characteristics of our forest stands affected the resulting distribution of fire severity. The results of our analysis report that forest structure did affect the final severity of fire. Green surviving plots were mainly those with more mature characteristics: lower densities, lower percent of small trees (DBH between 5 and 10 cm), higher percents of dominant trees, and higher basal areas. Dominant trees in these green plots were characterized by higher heights, larger trunks, and higher crown projections. This trend was also confirmed by the results of the individual trees, which also indicated that dominant trees with higher sizes, were the ones that survived the most. Regarding the fuel arrangement of these plots, more mature plots were characterized by larger horizontal continuities. At a tree level, individual green trees were associated to larger vertical continuities -and larger crown proportions-, and lower horizontal continuities. A preliminary review of these results, under the optic of forest stand structure, suggests that the structure of these trees could be related to more irregular, uneven-aged forests. This study give clues for forest management, as it shows how fuel structure conditions fire behavior in a Mediterranean fire. This reaffirms the key role of preventive fuel treatments, as powerful tools to avoid fire ignition, and to difficult the advance of fire in case it develops.
INTRODUCTION
Large fires are one of the most important management problems in many regions of the world (Malingreau et
al. 1985, Minnich and Chou 1997, Johnson et al. 1998, Piñol et al. 1998, Vélez 2000). These large fires are
frequently characterized by severe ecological, economic and social effects (Moritz 1997, González-Cabán
2000, Retana et al. 2002), whose importance, at least partially, depends on the spatial heterogeneity of burn
severities (Glitzenstein et al. 1995, Schimmel and Granström 1996). This resulting heterogeneous
distribution of burn severities and islands of unburned vegetation created by fire is mainly determined by
three major groups of variables (Rothermel 1983, Pyne 1984): topography (i.e. elevation, aspect, slope);
meteorology (i.e. wind, temperature, fuel moisture); and fuels (i.e. stand structure, fuel arrangement, forest
composition). From the point of view of forestmanagement, the greatest interest focuses on fuels, because
they are the only one of these factors that can be modified by humans. The modification of wildfire behavior
through changes in the fuel complex has long be intended, and constitutes the goal of fuel management
(Agee et al. 2000, Finney 2001).
There is a reasonable consensus in the literature about the importance of fuels on the final heterogeneity of burn severities when meteorological conditions are not extreme (Williams and Rothermel 1992, Turner and Romme 1994, Kushla and Ripple 1997, Turner et al. 1997, Agee et al. 2000, Finney 2001). However, authors differ about the importance of fuels on fire severity under severe weather episodes. This disagreement has led to the establishment of two alternative hypotheses (see reviews in Bessie and Johnson 1995, Agee 1997, Cumming 2001): the weather and the fuel hypotheses. The weather hypothesis states that large severe fires are driven by extreme weather events and burn intensely through forests regardless of the condition of their fuels. The fuel hypothesis states that the spatial variations in fuels influence fire spread or severity, even under severe meteorological episodes. These hypotheses were originally established for western North American forests, but the dilemma has been extended to other forest ecosystems under other topics. Thus, Minnich and Bahre (1995), Minnich and Chou (1997), and Minnich (2001) defend, for Chaparral ecosystems, that the non-random turnover of fire patches, the structure of the landscape in areas with and without fire suppression policies, and the relatively few fires that develop into large fires, are related to characteristics of the fuels and stand-age. On the contrary, Johnson et al. (2001) and Keeley and Fotheringham (2001) defend that in closed canopy ecosystems, such as boreal forests or chaparral, large fires are weather-driven phenomena, not dependent on stand-age. They report that the idea of large fires associated to enhanced fuel build-up is not applicable to those ecosystems where fire suppression policies have not resulted in a reduced number of ignitions.
Chapter 5: The role of fuels in the resulting heterogeneity of fire severities
2001). However, few studies have focused on lower-scale forest structure properties, such as theage and size of trees, density, and fuel homogeneity, on fire behavior (Turner and Romme 1994, Glitzenstein et al. 1995, Chappel and Agee 1996, Kushla and Ripple 1997, Turner et al. 1999). In these studies, certain consensus exists on the importance of some variables, such as tree size, on tree survival, while less agreement exists on other variables, such as the successional stage of the forest, probably due to differences in the ecosystems under study. This might explain why the main controversies about the effects of forest management on fire severity (e.g. even-aged versus uneven-aged structures, or species arrangement at the stand scale), remain in a qualitative, theoretical level, but few quantitative data are available to the decision makers.
In the Mediterranean basin, fuel management has a particular importance, due to the severity of fire episodes (Vélez 2000), the inflammability and combustibility of fuels (Pereira et al. 1995, Dimitrakopoulos & Panov 2001) and the hardness of climate (Delabraze 1986, Mérida 2000 ). This study focuses on the role of fuel structure in the variations of fire severity in an area affected by a large fire that occurred in the western Mediterranean area (Catalonia, NE Spain) in 1998. The objective is to test if the structural characteristics of forest stands affected the pattern of fire severities, in areas with similar topographic and weather conditions during the fire. To minimize external factors (i.e. meteorological conditions or topography) that could influence the resulting pattern of fire severities, homogeneous slopes without topographic disruptions or land cover changes were selected, and extensive field work was carried out to analyze the relationship between forest structure and fire severity.
MATERIAL AND METHODS
STUDY AREA
12ºC, with mean temperatures in the month of July around 21ºC (WWW1). Soils are mainly bright calcareous sandstones and loams.
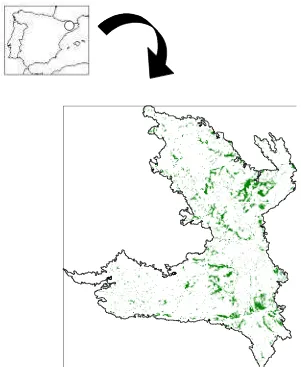
Figure 1: Location (in blue) of the large forest fire occurred in El Solsonés (northeastern Spain) in 1998, at a 1:125000 scale. The yellow box indicates the area where the two study zones were located.
Experimental design and sampling
Chapter 5: The role of fuels in the resulting heterogeneity of fire severities
fields in the middle of the slope). Selected slopes included the presence of three types of severities, similar to those described in Turner et al. (1994): i) charred areas: charcoal transformed stands or trees, with branches of different diameters left; ii) green surviving areas: stands with trees with a minimum of 45% of alive crown; and iii) mixed-severity areas: fire presented a patchy dynamics in these areas, resulting in a combination of burn severities, with charred, green and toasted stands-trees. Toasted trees were those affected by radiant heat, still holding their dried needles in the tree).
In each zone, 25 circular plots of 7.5-m radius were randomly selected for each severity, following a stratified random design. Due to the smaller size of the mixed areas, only 19 plots were carried out for this category in each zone. Sampling also included plots in patches of a given severity within a matrix of another severity (i.e. green surviving stands inside a homogeneous matrix of charred severity, or vice versa), in order to detect differences in forest structure between the patch and the surrounding matrix. The numbers of patches sampled were the following: six green patches inside the charred area in each zone, seven toasted patches inside the charred area in zone 2, and six charred patches inside the green area in zone 1.
In each plot, the total number of trees (with diameter at breadth height -DBH- larger than 5cm) and their DBH values were measured, in order to obtain total density and basal area per plot. Twenty-five trees were randomly chosen per plot. When the number of trees per plot did not reach 25, outer concentric trees were randomly selected. For each tree, the species, burn severity (categorical: charred, green or toasted), and vertical layer (categorical) were determined. The vertical layer was established dividing the maximum height of the trees in the plot in three levels: dominant trees were those reaching the tallest level, intermediate trees reached the height of the second layer, and dominated trees were located in the lower level. Total height and height to the crown base were measured for each tree. The percent of crown of each tree was computed from these two variables. When the crowns displayed different severities, their heights till each severity were also collected, so that the percent of crown affected by different severities could be calculated. Crown projection of each tree was also obtained as the ellipse of two perpendicular diameters of the crown.
To test the importance of fuel continuity, horizontal and vertical continuity indices were created following several steps:
i) the crown of each tree was divided into 8 directions, separated by angles of 45º.
ii) for each direction, the distances from the end of the crown of each selected tree, to the nearest crown in its same vertical layer and in the lower vertical layers, were measured. Thus, for dominant trees, these horizontal measures were calculated a) for the nearest dominant trees, b) for the nearest intermediate trees and c) the nearest dominated trees. Distances were limited to a range between 0 cm (contact) to a maximum value of 200 cm (no continuity). These thresholds (0-200 cm) were selected from the perspective of fuels, not from the perspective of fire.
iv) the Vertical Continuity Index (VCI) was calculated as the sum of horizontal distances to the one-two lower vertical levels (i.e. for a dominant tree, distances to surrounding intermediate and dominated trees). Again, the inverse values were used; thus, for dominant trees, this index ranged between 3200 (maximum continuity), and 0 (vertical isolation).
Mean values of the 25 trees sampled per plot were used to determine values at the plot level for the following variables: height, crown projection and DBH of dominant trees, horizontal continuity values for dominant and dominated trees, and the vertical continuity value for dominant trees.
Data analysis
To test the importance of forest structure in the landscape distribution of fire severity, analyses were carried out at the plot and the tree levels. At the plot level, these analyses looked for differences i) among general severities defined in each zone: charred plots, green plots and mixed plots; and ii) among patches included into matrices of a different severity. The effects of SEVERITY, ZONE and their interaction were analysed by two-way ANOVA’s over the selected structural variables of the plot: plot density, basal area, percent of basal area of conifers, height, crown projection and DBH of dominant trees, percent of dominant trees, percent of trees with DBH between 5-10 cm, percent of trees with DBH above 20 cm, horizontal continuity index for dominant and dominated trees, and the vertical continuity index for dominant trees. ANOVA’s were calculated separately when considering plots of all severities for both zones, and when dealing with patches of a given severity included into a matrix of a different severity. When focusing on the structural differences between patches and their matrices, three analyses were made: i) green plots inside a charred matrix; this analysis included zone 1 and zone 2, as the same number of green patches were available in each zone; ii) toasted-trees patches included into a charred matrix, only for zone 2; iii) charred patches inside a green-unburned matrix, only for zone 1. In all cases, inspection of residuals was carried out to check for normality and homocedasticity. When necessary, analyses were run on transformed data. For all statistical tests, the sequential Bonferroni method was employed to control the group-wide type I error rate (Rice 1989). The individual values of the different levels of each variable were compared with a post-hoc test (Fisher’s protected least significant difference).
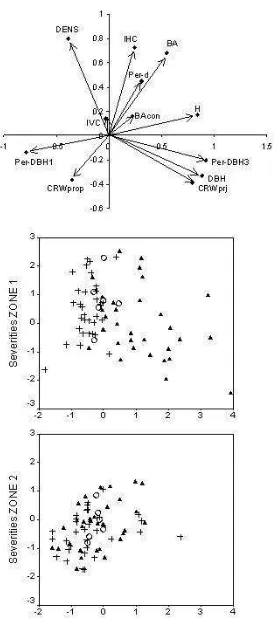
As a further step to analyze the differences among plots in each severity, a principal component analysis (PCA) was performed. Plots of all severities of both zones, were included in this PCA. Using the information on the general distribution of variables offered by this PCA, a visual representation of plots of all severities was made. ANOVA’s were performed to test for significant differences in the location of the plots of different severity (i.e., green, toasted and charred) along each of the first two PCA axes.
Chapter 5: The role of fuels in the resulting heterogeneity of fire severities
ANOVA’s were performed to test for significant differences in the location of the trees of different severity along the first PCA axes.
RESULTS
Structural differences among plots of different fire severities
Plots of different severities, without considering patches of a given severity immersed into a matrix of a different severity, displayed significant structural differences (Table 1). Structural variables whose response to fire severity was independent of zone were the density of trees in the plot, the basal area, the percent of trees with DBH between 5 and 10 cm, and the crown proportion. In these cases, green plots displayed lower densities of trees, lower percents of small trees (DBH between 5-10 cm), higher basal areas and higher crown proportions than the charred plots (Figure 2). The remaining significant variables were conditioned by ZONE due to structural differences between these zones (see interaction SEVERITY x ZONE in Table 1). Thus, zone 1 displayed higher percents of dominant trees (68.7±16 versus 57.9±15%), higher heights for the dominant trees (10.5±2.1 versus 9.0±1.5 m), higher basal areas (29±10.4 versus 23.2±7.9 m2.ha-1), higher horizontal continuities for the dominant trees (1185±216 versus 1109±226), and lower crown proportions (0.5±0.09 versus 0.6±0.09), than those of zone 2. According to the results shown in Figure 3, the patterns of this SEVERITY x ZONE interaction were similar for all significant variables (except the IHC): green plots of zone 1 displayed higher values than mixed or charred plots (Figure 3). In the case of the IHC, green plots displayed higher values than burned and mixed plots only in zone 2 (Figure 3E).
A principal component analysis (PCA) was performed at a plot level to revise trends among the considered structural variables (Figure 4). The first axis was responsible for 36% of the variance, while the second yielded another 19.6%. Variables distributed along the positive direction of the first axis include structural characteristics of the plots: height, DBH, percent of large trees (DBH>20cm), basal area, and crown projection (all of them referred to the dominant trees) (Figure 4A). In the opposite direction of this group of variables, for the first axis, it mainly appears the percent of trees with small diameters (5-10 cm). Variables related to fuel continuity are distributed along the second axis, with only the horizontal continuity playing an important role, while the importance of the vertical continuity is negligible in the first two axes. Basal area, plot density, and percent of dominant trees display similar trends to the horizontal continuity. The crown proportion displayed an opposite trend to the horizontal continuity. Considering this distribution of variables, several trends are observed when representing the plots of each zone (Figure 4B,C):
- In zone 2, none of the two first axes display significant differences among plots of different severities, (F=0.7, d.f.=2, p=0.5) for the first axis, and (F=1.2, d.f.=2, p=0.3) for the second axis.
Table 1: F values from the ANOVA tests of the effects of zone and severity on several structural variables at a plot level, for all severities. Significant coefficients (at _=0.05 when the sequential Bonferroni method is employed) are indicated in bold. Degrees of freedom: Severity, 2; Zone, 1; Severity x Zone, 2; Residual, 132.
Structural variables ZONE SEVERITY ZONE X SEVERITY
Total density (trees ha-1) 2.0 4.9 2.0
Basal area (m2 ha) 8.2 12.4 2.5
Percent of basal area of conifers (m2 ha-1) 0.004 3.3 1.4
Height of dominant trees (m) 4.6 19.4 17.7
Crown projection of dominant trees (m2) 3.3 23.7 19.0
Crown proportion (m.m-1) 14.8 12.4 1.7
Percent of dominant trees 9.1 0.84 3.9
Percent of trees with DBH between 5-10 cm 0.07 7.5 1.4
Percent of trees with DBH above 20 cm 3.3 14.9 7.4
DBH of dominant trees (cm) 0.6 33.0 22.7
IHC for dominant trees 10.9 2.9 5.1
IVC for dominant trees 1.3 1.9 2.8
Structural differences between patches of a given severity versus their matrices
Chapter 5: The role of fuels in the resulting heterogeneity of fire severities
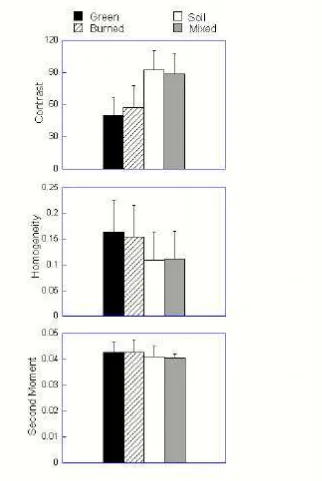
Figure 2: Mean ± standard deviation of the basal area (m2.ha-1), the density of trees (num.m2), the crown proportion (m.m-1), and the percent of small trees (DBH between 5 and 10 cm), for green, mixed and charred plots. Letters indicate significant differences among plot severities according to the Fisher PSLD post-hoc test.
Patterns of forest structure among trees burned with different severity
marked opposite trend between them. For this tree level, the vertical continuity index, together with the proportion of tree crown, display a strong positive trend, while the participation of horizontal continuity was in the opposite direction. Considering this distribution of variables, several trends can be observed when representing all trees separated by zones (Figure 5, B,C):
- In zone 1, trees of different severities were significantly separated along the first axis (F=360, d.f.=2, p<0.0001). Green trees display the highest mean, being significantly different to the toasted and charred trees (0.74±1.0, -0.7±0.9, -0.19±0.8 for the green, toasted and burned respectively). Green trees are therefore associated to higher heights, DBHs and crown projections. For the second component (F=118, d.f.=2, p<0.0001), burned trees display the lowest mean (-0.5±0.8), significantly different to the toasted and green trees (0.5±0.9 and 0.04±1.1, respectively), that is, burned trees are characterized by lower vertical continuities, lower crown proportions and higher horizontal continuities than green/toasted individuals.
[image:11.595.93.530.343.717.2]- In zone 2, trees with different severities displayed the same trends than those of zone 1, being significantly separated along both axes (F=57.4, d.f.=2, p<0.0001; F=17, d.f.=2, p<0.0001, respectively). Again, green trees are characterized by larger tree sizes, lower horizontal continuity and higher vertical continuity and crown proportions.
Chapter 5: The role of fuels in the resulting heterogeneity of fire severities
[image:12.595.159.438.46.665.2]Table 2: F values from the ANOVA tests of the effects of zone and severity on several structural variables of the green patches versus their charred matrices, at a plot level. Significant coefficients (at _=0.05 when the sequential Bonferroni method is employed) are indicated in bold. Degrees of freedom: Severity, 1; Zone, 1; Severity x Zone, 1; Residual, 58.
Structural variables ZONE SEVERITY ZONE x SEVERITY
Total density (trees ha-1) 3.9 0.07 0.04
Basal area (m2 ha) 0.3 5.2 0.8
Percent of basal area of conifers (m2 ha-1) 4.9 1.9 2.2
Height of dominant trees (m) 0.03 10.6 0.5
Crown projection of dominant trees (m2) 0.05 0.29 6.1
Crown proportion (m.m-1) 9.7 4.2 4.0
Percent of dominant trees 1.5 0.1 7.5
Percent of trees with DBH between 5-10 cm 1.6 8.6 0.4
Percent of trees with DBH above 20 cm 0.5 0.6 0.3
DBH of dominant trees (cm) 10.5 6.3 0.15
IHC for dominant trees 0.1 5.6 0.4
IVC for dominant trees 18.0 3.2 0.2
Table 3: F values from the ANOVA tests of the effects of zone and severity on several structural variables of the toasted patches versus their charred matrices, at a plot level. Significant coefficients (at _=0.05 when the sequential Bonferroni method is employed) are indicated in bold. Degrees of freedom: Severity, 1; Zone, 1; Severity x Zone, 1; Residual, 56.
Structural variables ZONE SEVERITY ZONE x SEVERITY
Total density (trees ha-1) 0.5 7.6 1.6
Basal area (m2 ha) 0.02 3.9 2.2
Percent of basal area of conifers (m2 ha-1) 0 0.1 0.4
Height of dominant trees (m) 1.7 13.7 0.8
Crown projection of dominant trees (m2) 0.29 0.23 5.8
Crown proportion 9.3 10.9 2.2
Percent of dominant trees 5.9 8.2 0.8
Percent of trees with DBH between 5-10 cm 0.9 0.3 0.15
Percent of trees with DBH above 20 cm 1 1.1 0.008
DBH of dominant trees (cm) 7.7 7.9 0.015
IHC for dominant trees 0.005 16.0 0.7
IVC for dominant trees 11.03 2.4 0.14
[image:14.595.56.561.488.726.2]DISCUSSION
Forest structure and fuel continuity influencing fire severity
The results of this study determine that, under moderate climatic conditions, forest structure, both in terms of tree sizes and fuel continuity, influence the distribution of fire severities. This influence is reported both among general severities in the slope, and also between patches of a given severity immersed in a matrix of a different severity (i.e. burned patches inside a green matrix). In our study, both green surviving plots and green trees, are mainly those with more mature characteristics -in terms of larger tree sizes- (larger DBH, higher heights, higher percents of trees with DBH>20cm, higher crown projections). Conversely, plots with high percents of dominated trees, lower heights and thinner trunks are more easily charred by fire. Studies dealing with forest pre-fire heterogeneity and its influence on the distribution of fire severity generally agree on the importance of larger sizes on tree survival (Turner et al. 1994,1999, Glitzenstein et al. 1995, Chappel and Agee 1996, Trabaud and Valina 1998, Agee et al. 2000, Finney 2001). It could then be hypothesized that more mature forests would be less affected by fire, and that any fuel management measure should accelerate the evolution of young forest stands, susceptible to fire, towards other stages, with lower susceptibilities to fire (Delabraze 1986). Studies performed by Glitzenstein et al. (1995), Chappel and Agee (1996), and Kushla and Ripple (1997) have also reported how old stands appear less susceptible to high-severity fire, while young stands burn more severely. Even though the obviousness of this statement, several studies have shown that older stands might burn more easily than younger ones. Thus, Turner et al. (1999) show a tendency of older successional stages to be affected by crown fire more than expected. Turner and Romme (1994) have also reported that fire burned intensely through 300-yr old forest stands but failed to be carried through the canopy when reaching 100-yr old stands. In the same line, Agee and Huff (1986) have reported an increased fire susceptibility on extreme successional stages: very young and very old forests burned more easily than intermediate age stages. The explanation given to this higher affectation of older stands relates to an increased fuel hazard linked to stand age, due to the development of a flammable conifer understory. These contrasting results indicate that more mature and older successional stages are not necessarily always less susceptible to fire, and that a revision of fuel evolution and fire susceptibility is required for each forest ecosystem under study.
relation with the horizontal continuity). At the tree level, the horizontal continuity and vertical continuities played an important contrasted role. This last vertical index was associated to the proportion of tree crown. In this line, even though large crowns can help fire move along the crown, they may also have the opposite effect, under certain conditions. Thus, large crowns may act as a heat screen, favoring the survival of the upper parts of the crown. Regarding the structural characteristics of the trees and the forest structure, traditional silviculture relates larger tree crown proportions to more irregular stands (Oliver and Larson 1990). This irregular forest structure could be supported by the high vertical continuities and lower horizontal continuities of the green surviving trees. However, the role forest structure in terms of even-aged, uneven-aged, mature-immature structures and their relationship with fire risk, is still an open debate (Van Wagner 1983, Delabraze 1985, Stocks 1987, 1989, Madrigal 1992). In this line, Stocks (1987,1989) revised fire behavior in mature and immature stands of jack pine forests. Mature stands were characterized by an open understory, well separated from the canopy, that avoided fuel vertical continuity. This contrasted with immature, even-aged stands, where natural thinning, dense stand conditions, and the vertical fuel continuity allowed crown fire development once a moderated rate of spread is achieved. In terms of even-aged versus uneven-aged stands, and contrarily to our results, several authors have reported a lower susceptibility to fire of even-aged forests (Delabraze 1986, Madrigal 1992, Turner and Romme 1994). These authors defend that even-aged forests are less susceptible to fire when they have large dominant trees, with large distance from the ground to the crown base and a closed canopy that makes difficult the establishment of a dominated understory. Delabraze (1986) considered the juxtaposition of eve-aged stands of different age classes as a strategy to reduce the flammability of the landscape as a whole.
Fuel management strategies
those stands with larger sizes. A third fuel treatment to reduce fuel hazard would refer to fuel conversion (Pyne et al. 1996), which implies the reduction of fire spread rates by species shifts towards less flammable species, most frequently increasing the density of deciduous trees. In our study, the percent of basal area corresponding to broadleaves was intended to measure the variability of broadleaves versus conifer species, in the stands. However, this variable was not significant, probably due to the low percent of broadleaves per plot.
If trees affected by lightings are the basis of the fires in the North-American old forests, dead, dry fuels, and large fuel continuities, are the basis for Mediterranean fires (Delabraze 1986). The continuity of ligneous fuels, the abundance of very flammable shrubs, a vegetation close to the withering point in summer months, dried soil surfaces, strong winds, a steep topography, and changes in socio-economic and lifestyles, have combined to worsen fire seasons in Mediterranean areas (Naveh et al. 1975, Delabraze 1986, Vélez 2000). Under these severe conditions, the role of fuels needs of further revision, as preventive fuel treatments are a powerful tool to avoid fire ignition, and to difficult the advance of fire in the case it develops (Velez 1990). This study shows that fuel structure may condition fire behavior in a Mediterranean large forest fire. That is, under moderate climatic conditions, the fuel complex influences the establishment of a heterogeneous distribution of burn severities. Altering the fuel complex should therefore be the objective of any forest manager that intends to protect the landscape against fire episodes. To cope with this objective, there exists a wide range of understory and overstory prescriptions and methods to modify fuels through manual and mechanical techniques, or prescribed fire (Agee et al. 2000). Among the potentials and limitations of each strategy to alter the fuel complex, manual and mechanical techniques are limited by their costs. Thus, fuel reduction and fuel isolation treatments by these means are only reasonable for small areas, but unaffordable for larger areas (Finney 2001). When prescribed burning is selected as the method to reduce and isolate fuels, costs are diminished, but a few aspects need to be considered (Johnson and Miyanishi 1995): i) the resilience of the affected communities and their habituality to the presence of fire; thus, as mentioned by Keeley and Fortheringham (2001) for the Californian chaparral, high fire frequencies, often caused by prescription burning, can pose an extinction risk to many species; and ii) the historical role of fire, to determine the extent to which prescription burning is needed for maintaining fire-dependent communities (Keeley and Fortheringham 2001). This creates the need to re-educate the public opinion about the goodness of certain types of fires, and to find an equilibrium between the benefits and prejudices of this ecosystem management.
ACKNOWLEDGEMENTS
REFERENCES
Agee, J.K.1997. The severe fire weather wildfire-too hot to handle?. Northwest Science 71:153-156.
Agee, J.K. and M.H. Huff. 1987. Fuel succession in western hemlock-Douglas-fir forest. Canadian Journal of Forest Research 17, 697-704.
Agee, J.K., B. Bahro, M. A Finney, P. N. Omi, D. B. Sapsis, C. N. Skinner, J. W. van Wagtendonk, C. P. Weatherspoon. 2000. The use of shaded fuelbreaks in landscape fire management. Forest Ecology and Management 127:55-66.
Baker, W. 1993. Spatially heterogeneous multi-scale response of landscapes to fire suppression. Oikos 66:66-71.
Bessie, W.C. and E.A. Johnson. 1995. The relative importance of fuels and weather on fire behavior in subalpine forests. Ecology 76:747-762.
Chappell. C.B., and J.K. Agee. 1996. Fire severity and tree seedling establishment in Abies Magnifica forests, in Southern Cascades, Oregon. Ecological Applications 6:628-640.
Cumming, S.G. 2001. Forest type and wildfire in the Alberta Boreal Mixedwood: what do fires burn?. Ecological Applications 11:92-110
DARP. 1990. Departament d’Agricultura, Ramaderia i Pesca. La gestió del bosc a Catalunya. Generalitat de Catalunya.
Delabraze,. 1986. Sylviculture méditerranéenne in Précis de sylviculture (Ed. L. Lanier), pages :365-376. Ecole Nationale du Génie Rural, des Eaux et des Forets. Nancy.
Dimitrakopoulos, A.P. and Panov, P.I. 2001. Pyric properties of some dominant vegetation species, International Journal of Wildland Fire 10:23-27.
Finney, Mark A. 2001.Design of regular landscape fuel treatment patterns for modifying fire growth and behavior. Forest Science 47:219-228
Glitzenstein, J.S., W.J. Platt, and D.R. Streng. 1995. Effects of fire regime and habitat on tree dynamics in north Florida longleaf pine savannas. Ecological Monographs 65:441-476.
González-Cabán, A. 2000. Aspectos económicos del daño producido por incendios forestales in La defensa contra incendios forestales. Fundamentos y experiencias (Ed. R. Vélez) capítulo 5.1. MacGraw and Hill, New York, USA.
González, M., & Castellnou, M. 1998. Fuego en la Cataluña Central. Montes, 53, 17-20. IEFC. 2000. Inventari Ecològic i Forestal de Catalunya. Regió Forestal IV. CREAF, Barcelona.
Johnson, E.A., and K. Miyanishi. 1995. The need for consideration of fire behavior and effects in prescribed burning. Restoration Ecology 3: 271-278.
Johnson,E.A., Miyanishi,K., and Weir, J.M.H. 1998. Wildfires in the western Canadian boreal forest: landscape patterns and ecosystem management, 9:603-610.
Johnson, E.A., Miyanishi K. and Bridge, R.J. 2001. Wildfire Regime in the boreal forest and the idea of suppression and fuel buildup. Conservation Biology 15:1554-1557.
Keeley,J and Fortheringham,J. 2001.History and management of crown-fire ecosystems: a summary and response. Conservation Biology 15:1561-1567.
Kushla,J.D., and W.J. Ripple. 1997. The role of terrain in fire mosaic of a temperate coniferous forest. Forest Ecology and Management 95:97-107.
Llasat, C. 1997. Meteorologia agrícola i forestal a Catalunya. Conceptes, estacions i estadístiques. Departament d’Agricultura, Ramaderia i Pesca. Pages:291.
Madrigal, A. 1992. Selvicultura mediterránea: una primera aproximación al tema. Jornadas de selvicultura mediterránea. ETSI Montes, Madrid.
Malingreau, J.G, G. Stephens, and L. Fellows. 1985. Remote Sensing of Forest Fires in Kalimantan and Northern Borneo in 1982-1983. Ambio 14:314-321.
Mérida, J.C. 2000. Factores ambientales. Factores meteorológicos in La defensa contra incendios forestales. Fundamentos y experiencias (Ed. R. Vélez) capítulo 8.1. MacGraw and Hill, New York, USA. Miller,C. and DL Urban. 2000. Connectivity of forest fuels and surface fire regimes. Landscape Ecology
15:145-154
Minnich, R.A., and C.J. Bahre. 1995. Wildland fire and chaparral succession along the California-Baja California boundary. International Journal Wildland fire 5:13-24.
Minnich, R.A., and Chou, Y.H. 1997. Wildland fire dynamics in the chaparral of southern California and Northern Baja California. International Journal of Wildland Fire, 7:221-248.
Minnich, R.A. 2001. An integrated model of two fire regimes. Conservation Biology 15:1549-1553.
Moritz, M. 1997. Analysing extreme disturbance events: fire in Los Padres National Forest. Ecological Applications, 7:1252-1262.
Naveh, Z. 1975. The evolutionary significance of fire in the Mediterranean region. Vegetatio 29, 199-208. Oliver, C., and Larson, B. 1990. Forest stand dynamics. Biological Resource Management Series.
McGraw-Hill Inc., USA.
Pereira,J.M., Sequeira, N,M.S., Carreiras, J.M.B. 1995. Structural properties and dimensional relations of some Mediterranean shrub fuels. International Journal of Wildland Fire 5:35-42.
Piñol, J., Terradas, J., and Lloret, F. 1998. Climate warming, wildfire hazard and wildfire occurrence in coastal Eastern Spain. Climatic Change 38:345-357.
Pyne, S. 1984. Introduction to Wildland Fires: Fire Management in the United States, pp. 1-34, John Wiley, New York.
Pyne, S. J., PL Andrews, and RD Laven. 1996. Introduction to Wildland Fire. New York: John Wiley & Sons, Inc.
Retana,J., Espelta, J.M, Habrouk,A., Ordóñez, J.L, and de Solà-Morales, F. 2002. Regeneration patterns of three Mediterranean pines and forest changes after a large wildifre in northeastern Spain. Ecoscience, 9:89-97.
Rothermel, R.C.1983. How to predict the spread and intensity of forest and range fires. USDA Forest Service Res. Pap. INT-115. Odgen, UT: U.S. Department of Agriculture, Forest Service, Intermountain Research Station. Utah.
Schimmel, J., and A. Granström. 1996. Fire severity and vegetation response in the boreal Swedish forest. Ecology 77:1436-1450.
Trabaud, L., and Valina, J. 1998. Importance of tree size in Pinus halepensis Mill. fire survival. in Fire Management and Landsape Ecology (Ed. L. Trabaud) pages:189-197. International Association of Wildland Fire.
Turner, M.G., and W.H. Romme. 1994. Landscape dynamics in crown fire ecosystems. Landscape ecology 9:59-77.
Turner, M.G., Hargrove, W.W., Gardner, R.H. & Romme, W.H. 1994. Effects of fire on landscape heterogeneity in Yellowstone National Park, Wyoming. Journal of Vegetation Science 5:731-742.
Turner, M.G., W.H. Romme, R.H. Gardner and W.W. Hargrove. 1997. Effects on fire size and pattern on early succession in Yellowstone National Park. Ecological Monographs 67:411-433
Turner, M.G., W.H. Romme, and R.H. Gardner. 1999. Prefire heterogeneity, fire severity and early postfire plant reestablishment in subalpine forests of Yellowstone National Park, Wyoming. International Journal of Wildland Fire 9:21-36.
Van Wagner, C.E. 1983. Fire behavior in northern conifer forests and shrublands in The role of fire in northern circumpolar ecosystems (Ed. R.W.Wein and D.A. MacLean). Chap. 4. John Wiley and Sons, New York, pp:65-80.
Van Wagner, C.E. 1992. Prediction of crown fire behavior in two stands of jack pine. Canadian Journal of Forest Research 23: 442-449.
Vélez,R. 1990. Selvicultura preventiva de incendios forestales. Ecologia, Fuera de Serie. N.1 1990. ICONA,PP:561-571
Vélez, R. 2000. Los incendios forestales en la Cuenca Mediterránea in La defensa contra incendios forestales. Fundamentos y experiencias (ed. R. Vélez) capítulo 3. MacGraw and Hill, New York, USA. Williams, J.C., and Rothermel, R.C. 1992. Fire dynamics on northern Rocky Mountain Stand types.
Research Note. INT-405. Odgen, UT: U.S. Department of Agriculture, Forest Service, Intermountain Research Station.
WEBsites
WWW1: Climatic Atlas of Catalonia web. http://www.uab.es/atles-climatic
General conclusions
1. Fire regime in Chiapas is characterized by a large number of small fires (80 % of the incidences are fires
between 1 and 250 ha). However, these small fires are only responsible for a reduced percent of the
total burned area (22%). Large forest fires play, therefore, an important role in the ecology of Chiapas’
forests (8% of the incidences and 62% of the area burned in fires larger than 500 ha). Some
municipalities have been particularly affected by these large fires, suffering from 32 large forest fires in
the period 1993-1999 (Villacorzo). Most of these large fires are, however, surface fires of low intensities
(80% of the incidences and 60% of the total area), that mainly affect non-forested land (shrubs and
herbaceous layers).
2. The problem of fire in Chiapas is framed by several structural causes that include: i) a marked seasonal
distribution of rainfall, ii) a habitual use of fire in traditional land activities and a lack of real alternatives,
iii) a marked sensitivity to the presence of ENSO episodes, specially concentrated in rainforests, iv) a
land tenure distribution that displays remarkable pressure on national lands, and v) particular
flammability characteristics of its forests that concentrates fire in pine-oak ecosystems under non-ENSO
conditions. Among the immediate causality, negligence and deliberate burning are the major causes of
Chiapas’ fires.
3. Factors that influence fire trends in Chiapas, under ENSO and non-ENSO conditions, reveal that there is
an interesting shift in the major group of variables that determines fire trends, depending on the climatic
conditions: environmental variables are the major factors determining fire trends in non-ENSO years
while human variables are the major factors in ENSO years. Thus, in non-El Niño years, the status of the
vegetation is the main cause determining fire ignition and fire spread in these years, while in the El Niño
period, fire trends are mainly determined by the presence of ignition agents.
4. Altitude, pine-oak communities and poverty levels played major roles in the arboreal fire incidence in
non-El Niño years, whereas the distribution of pastures appeared as an important variable determining
arboreal fire incidence in El Niño years.
5. The main vegetation types affected by fire in non-El Niño years were the most flammable ones (i.e.
pine-oak communities), while rain forests burned the most in El Niño years. The results of this study strength
the importance of El Niño years in the conservation of rain forest ecosystems and suggest the existence
of synergistic effects between fires, fragmentation and certain elements of the landscape, such as cattle
pastures, in tropical areas.
6. The results of the methodological revision of remote sensing techniques that better characterize burned
land, and better improve post-fire assessments, indicate that time consuming and expensive
methodologies are not necessarily the most accurate, especially when potentially easily distinguishable
classes are involved. Since no image processing technique was applied to the Raw Reflectance Data, it
can be considered the most cost-effective methodology, whose importance was reinforced by the tree
classifier.
7. When non-pure classes are included into the classification process, spectral noise is enhanced, and the
overall accuracy decreases, offering an unacceptably low value. This noise is related to limitations in the
non-pure class, both for the field survey and the satellite images.
8. For the classification procedure, three major limitations were detected for the image processing
techniques: i) the use of a maximum likelihood classifier, ii) the presence of a strong dark background,
and iii) technical constraints of some methodologies (i.e. the edge phenomenon in texture, atmospherical
and soil noise in vegetation indices, and endmember selection and spectral ambiguity in SMA).
9. The revision of those factors that influence the survival of green islands within a fire indicate that the
distribution of these unburned patches was not random. Conversely, vegetation islands were frequently
located on large slopes, in areas with large amounts of forests, north and western aspects, with more
mature forests (higher volumes of wood), lower infrastructures and lower diversities. The size of these
islands was conditioned by the percent of forests, the size of the slope, the level of infrastructures and
the volume of wood.
10. Landscape fragmentation was negatively related with island formation, in a way that, there were less
islands in slopes with higher infrastructures and higher landscape diversities. For this reason, our results
suggest that any fuel management strategy should avoid linear features (i.e. firelines and firebreaks),
favoring any treatment that affects areas. The selection of these areas should take into account those
factors that enhanced the creation of vegetation islands (i.e. larger slopes with more mature forests).
11. Structural characteristics of forest stands influenced the post-fire distribution of fire severity. Thus, under
moderate climatic conditions, green surviving plots were mainly those with more mature characteristics:
lower densities, lower percent of small trees (DBH between 5 and 10 cm), higher percents of dominant
trees, and higher basal areas. Dominant trees in these green plots were characterized by higher heights,
larger trunks, and higher crown projections. This trend was also confirmed by the results of the individual
trees in plots of any severity, which also indicated that dominant trees with higher sizes, were the ones
that survived the most. Any fuel management strategy should enhanced the evolution towards more
mature conditions, as they better skip fire, under moderate climatic conditions.
12. Fuel arrangement is also a known variable that affects the post-fire distribution of severities in a burned
landscape. In our plots, more mature stands were characterized by larger horizontal continuities, while
individual trees displayed strong opposite trends between vertical and horizontal continuities, with green
trees displaying higher vertical continuities and lower horizontal continuities. This fuel continuity will
condition the forest management strategies to minimize fuel hazard. Thus, in the frame of our study, any
forest management that favoured the establishment of irregular forest stands would have been preferred
Chapter 4
Abstract
Large forest fires are recently becoming more frequent and more severe in many ecosystems. As these disturbances affect large areas, they are likely to be heterogeneous in their effects. One of the characteristics of this heterogeneity is the formation of unburned islands of vegetation, and a spatial variability of fire severities in the affected ecosystem. The importance of these unburned patches relies on their contribution to ecological processes, such as regeneration patterns, soil erosion, fauna distribution and biodiversity conservation. The survival of these vegetation islands is conditioned by three major factors: topography, meteorology and fuels. The combined effect of these three factors will influence the characteristics of these islands: number and areas of the unburned patches.This study focuses on a large forest fire that occurred in north-east Spain, in 1998. The area of the fire is divided into slopes of different aspects, in order to separate the differential microclimatic conditions of contrasted aspects (i.e. wetter and more productive forests in northern aspects versus more water stressed and less productive forests in southern slopes). The number of vegetation islands and their sizes are related to 12 potential variables that influence their formation (i.e. land cover characteristics, aspects, rugged terrain (slope inclination), forest structure, and two landscape indices). We hypothesize that there is not a random pattern in the formation of unburned islands. Conversely, vegetation islands will be concentrated on northern aspects, in less flammable forests (i.e. broadleaves) and higher fragmentation, to interrupt the advance of fire. The results of our study suggest a non-random distribution of the islands within the fire perimeter. A higher number of vegetation islands (island frequency) was associated to higher slope areas, higher percent of forests, lower densities of infrastructures and lower diversities. Northern and western aspects enhanced the formation of vegetation islands. In the other hand, the area of these islands seemed to be conditioned by the percent of forest, the area of the slope, the existence of more mature forests (higher volumes of wood), steep slopes and lower levels of infrastructures. Among the results of this study, the negative relationships between larger islands and fragmented landscapes, suggests that, under severe meteorological conditions, fragmented forests can be more affected by wind and by water stress, burning more easily than forests that are protected from these edge-phenomenon. The importance of size, aspect, forest structure and landscape heterogeneity, as potential factors enhancing the formation of islands, had been already reported by several authors. The results of this study would reinforce those forest management strategies that avoided linear features (firelines, fire-breaks), to enhance any forest treatment that focused on areas and avoided fragmentation (i.e. fuel reduction over selected slopes, in northern aspects, larger slopes, higher percent of forest, and more mature forests).
Chapter 4: Factors influencing the formation of unburned islands within a fire perimeter
INTRODUCTION
In the last decades, the occurrence of severe fire episodes affecting large extensions of forested areas has called the public attention about the ecological, social and economical importance of these disturbances, in diverse forest ecosystems (Christensen 1989, Johnson et al. 1998, González-Cabán 2000, Retana et al. 2002). The effects of these large forest fires, an increased sensibility towards large-scale disturbances, and a recent popularity of ecological studies from broader-scales perspectives (Caley and Schluter 1997, Angermeier and Winston 1998), have resulted in a considerable number of studies dealing with factors that influence large forest fires (Bessie and Johnson 1995, Minnich and Chou 1997, Keeley and Fortheringham 2001, Minnich 2001) Among these studies, several have focused on the pre-fire heterogeneity of the landscape, as a way to determine the resulting variability of fire severity in the affected area (Eberhart and Woodard 1987, Turner et al. 1994,1999, Kushla and Ripple 1997, Cumming 2001, Finney 2001). The post-fire mosaic of burned vegetation and islands of unburned vegetation, is finally conditioned by those variables that influence fire severity: topography, meteorology, and fuels (Rothermel 1983, Pyne 1984). These factors play a key role in the intensity of the fireline and its rate of spread, which determine the final severity of a fire, and therefore, the formation of unburned islands within the fire perimeter (William and Rothermel 1992, Schimmel and Granström 1996,Tuner et al. 1997).
ha), the proportion of burned area that was in crown fire varied from 5 to 60%, while this percent was reduced to 35-55% in larger fires. Corroborating the importance of fire size as a key factor controlling the abundance of unburned areas, Eberhart and Woodard (1987) analyzed several characteristics of “residual vegetation” within the fire perimeter. Among their results, they found that the percent of disturbed area -area without surviving islands- decreased significantly with increasing fire sizes, while the median area of the surviving islands significantly increased. Other variables that
An understanding of the pattern of island formation would improve forest management and would offer clues for the design of less fire-prone landscapes. Moreover, it would provide managers with knowledge of the on-site resources available to them for rehabilitation of the disturbed area and an indication of the possible impacts on other resources including wildlife (Eberhart and Woodard 1987). This study will search for environmental variables that influence the frequency and size of unburned islands within the fire perimeter, and will categorize their importance by means of a tree classifier. To fulfill this goal, a large forest fire occurred in north-eastern Spain (Catalonia) in 1998, will be analyzed. This large fire was characterized by a patchy fire dynamic that left a mosaic of small surviving islands immersed in a charred matrix. We hypothesize that these unburned patches are not randomly located, and that northern aspects, areas with higher landscape diversities, higher percents of less flammable materials (i.e. broadleaves), and more abrupt topography, will favor the formation of these unburned islands.
MATERIAL AND METHODS
STUDY AREA
Chapter 4: Factors influencing the formation of unburned islands within a fire perimeter
The evolution of forest fires in this area is similar to the rest of Spain, in terms of an increased number of fires and burned areas, in the last three decades (Peix 1999). For the period of 1988-1997, fire fighting and control systems had efficiently reduced the number of fires in Catalonia, with the exception of the large forest fires, which are responsible for 0.43 percent of the incidences, and 75 percent of the annual affected area (Peix 1999). This situation partly relates to the accumulation of fuel loads which has not modified the fire regime in terms of the type of fire, but has enhanced the severity of the episodes. Thus, between 1970-1990, the arboreal area increased in a percentage of 20 percent in Catalonia (DARP 1990). High demographic pressure, rural abandonment, disappearance of traditional activities, marginality related to low agrarian cost-effective, changes in the spare time habits and the second residence phenomena are the remaining factors explaining this fire situation (Llasat 1997, Peix 1999).
Characterization of the unburned islands pattern
The unburned-island layer used in this study was obtained from a classified digital map of the burned area (Román-Cuesta et al. unpublished data). These authors performed a quantitative comparison between two broad methodologies for burned land classification: a field survey and four image processing techniques. The use of apparent reflectance data was the methodology that yielded better accuracies, and the best cost-effective ratio, as no transformation was required more than the image correction steps. This methodology resulted in a total of 2259 ha of unburned islands within the fire perimeter. For the purposes of this study, a minimum size of islands was selected (≥ 0.2 ha). Even though the ecological importance of these small
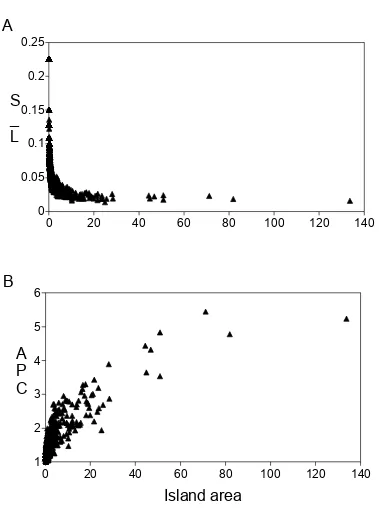
islands, they represented an unaffordable number and they accounted for a reduced area (see results for further information). In order to diminish biases, surviving islands larger than 0.2 ha with a land cover different from forests (i.e. green crops), or islands where fire did not pass through, were also eliminated from the island digital layer (information was obtained from a Field Survey map, Casas et al. 1999). The final number of surviving islands, after all these exclusions, was of n=817, with a total area of 2023 ha (Figure 1). In order to characterize the pattern of these unburned islands, three indices were selected: i) the patch area (m2), ii) the perimeter-area ratio (L-S), and iii) the corrected perimeter-area (CPA). The perimeter-area ratio index (m.ha-1) varies according to the size of the patch even when the shape is constant. The corrected perimeter-area (CPA) index informs about the shape of the patches. It partly diminishes the size effect of the previous index. It varies from 1 for a perfect circle, to infinity, for a long and narrow shape (Farina 1998):
CPA = (0.282*L) /
S
where L is the patch perimeter, in meters, and S its area, in ha.
Figure 1: Unburned-island layer, obtained from a IRS-1C, LISS-III image, by means of a maximum likelihood algorithm applied to the apparent surface reflectance data . Source: Román-Cuesta et al. unpublished data.
Factors affecting the formation of islands
In order to characterize those variables that influence the
formation and extent of unburned islands, the study area was divided into slopes larger than 2.5 ha, each of them associated to a given aspect. Smaller slopes represented an unaffordable number (10512, 86%) and were considered too small for landscape analyses. Slopes were, therefore, the spatial unit of all our analyses. This land division was considered the most appropriate for the Mediterranean conditions, in order to minimize the effect of aspect on different water stresses and vegetation distributions (Gràcia 2000). A total number of 1608 slopes were selected. Due to the threshold values of slopes (≥ 2.5 ha), and islands (≥ 0.2
Chapter 4: Factors influencing the formation of unburned islands within a fire perimeter
slope units, by means of the GIS system Miramon 4.0vh (Pons 2000). Multi-collineality analysis and elimination of redundant variables -correlation coefficients ≥ 0.8 and VIF (variance inflation factor) values higher than 10-, was also done.
Unburned-islands variables: Data were obtained regarding the incidence of islands: number of islands rated by the forest area in each slope (num.ha-1) and the total area of the unburned-islands in each slope, rated by the forest area in each slope. It was expressed in percentages. Each unburned-island variable was finally categorized into three groups, considering a balanced distribution of percentiles, by means of the SPSS statistical program: slopes with no island formation (0), slopes with relatively low incidence of islands or low percents of unburned areas (1: 0.01-0.36 islands.ha-1, 0-14.9 percent of unburned area), and slopes with relatively high incidence of islands or high percents of unburned areas (2: 0.36-4.57 islands. ha-1 ,14.9-100 percent of unburned area). The number of slopes in each category, both for the frequency and area of island was of n=791, n=409, n=408, for the categories 0,1 and 2 respectively.
Topographic variables included slope and aspect. These topographic variables were obtained from a Digital Elevation Model (DEM) of 25 m of pixel resolution. Elevation was not included as its range of variation in the study area (407-936 m) was considered insufficient to incorporate it in the analysis. Aspect was a categorical variable with four final classes: north, south, east and west. Due to the very reduced number of flat slopes, this category was eliminated from our study. Slope was calculated as the weighted mean of the slope area occupied by three categories of slope: 0-10 º, 10-30º, and >30º.
Slm= = n
i 1
si / 100 * pi
where Slm is the mean slope, in degrees, and si refers to the percent of slope area with a category p i .
Land cover variables: they were obtained from a digital land cover map (IEFC 1993, 1:3000), and from a digital land use map (CORINE 1986-1988, 1:250000) (broadleaves). The study area contained 14 different land covers, mainly concentrated on crop-fields and woods. Originally, there were 8 variables that were reduced to three: forested land, crop-fields, shrubland, and broadleaves. This last variable pretended to assess the effect of forest species on the final survival of forest stands. These land cover variables were incorporated in the analysis as the percent of slope area occupied by each of them. The percent of understory and the volume of wood (m3.ha-1) were derived from data collected within the fire area, in a National Forestry Inventory (IEFC) performed in 1988. There were 143 forest stations available within the fire area, which were used to create a continuous variable by means of a GIS interpolation. Each continuous layer was transformed into 6 categories, and a mean value per slope was given, by means of the following procedure:
Volwoodm= = n
i 1
where ni is the number of cells in the slope with a mean volume of wood vi. The summatry is then divided by the total number of cells in the slope.
The density of infrastructures was derived from digital topographic data regarding the road network in the study area. It represents the appearance of roads in each slope, divided by the total area of the slope (num of cells with a road. ha-1). It was also computed by means of a GIS system.
Landscape variables: two landscape indices were selected in order to determine if, and when, slopes affected differently the formation and characteristics of islands. These variables are a measure of the spatial arrangement of the patches in our selected landscapes (slopes). Selected indices were the Shannon diversity (H’), and a textural index: the angular second moment (ASM).
• Shannon diversity (H’): This index combines richness and evenness and is an indicator of the relative abundance of a land cover.
H= -
∑
p
*
ln(
p
)
’where p corresponds to the proportion of grid cells on the landscape for the land use i selected.
• Angular second moment (ASM). Texture measures are used to determine the brightness patterns within an image (see Haralick et al. 1973, Musick and Grover 1991 and Soares et al. 1997). They can be use as a measure of spatial complexity and contrast among patches. The angular second moment variable is the sum of co-occurrence probabilities:
ASM =
∑∑
(
p
i,j)
2where p (i,j) is the relative abundance of cells i that are adjacent to cells j . ASM increases with mosaic homogeneity as the co-occurrence of identical values has a marked influence in this index. ASM is 1 when all co-occurrences are identical. This index is insensitive to the magnitude of the difference between cells of different values (Farina 1998).
Chapter 4: Factors influencing the formation of unburned islands within a fire perimeter
decrease in deviance (i.e. measure of heterogeneity) (Andersen et al. 2000). After extracting training data from the user defined classes, it iterates to develop several splitting rules that divide the original data into progressively more homogeneous branches. Binary recursive partioning continues until the original data has been divided into pure nodes or the remaining data are too sparse. To create these trees, a randomly elected sample test was selected (n=981), while the remaining 609 cases were used to test the model. SPSS and STATISTICA, were the employed statistical packages.
RESULTS
Unburned island patterns
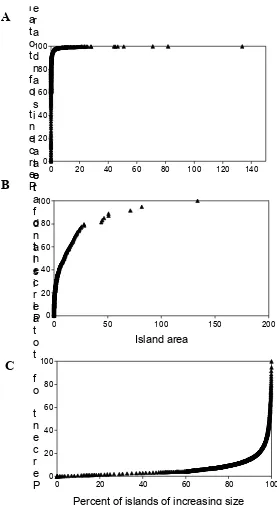
6102 islands were formed within the fire perimeter, with a mean area of 0.42 ± 3.0 ha and a median of 0.031 ha. The minimum island size was of 0.03 ha and the maximum of 137 ha. Even though this large number of unburned patches, most of these vegetation islands were small (i.e. 82% of the cases were islands ≤ 0.2 ha),
and they accounted for 13% of the total unburned area (Figure 2 A,B). The Lorenz curve for the surviving islands indicated that 50% of the total number of islands were responsible for 3.7% of the total unburned area, while 4.5% of the total number of islands accounted for 75.57% of the total unburned area (Figure 2,C).
A revision of the attributes of these unburned patches indicated that the perimeter increased linearly with the size of the islands (R2=0.95). The ratio perimeter-area of the islands, versus the island area, responded to a decreasing potential function (R2=0.98). Thus, small islands were strongly conditioned by their areas, while larger patches (≥ 10ha) were more balanced by their perimeters, oscillating around a fixed ratio value (0.02) (Figure 3,A). For the CPA variable, more regular shapes (lower values) corresponded to small islands, while patches larger than 16 ha were characterized by more irregular shapes (values above 3) (Figure 3, B).
Variables affecting the formation of vegetation islands
exception of the area of the slope, the percent of understory, and the density of infrastructures, the rest of the predictors did not display significant differences between low and high frequencies of islands, being more influenced by the dichotomy: island formation-no formation (Table 2). When revising the island area instead of the frequency of islands, the same trends were observed for all predictors.
A
B
C
0 20 40 60 80 1000 20 40 60 80 100
P
e
r
c
e
n
t
o
f
t
o
t
a
l
i
s
l
a
n
d
a
r
e
a
Percent of islands of increasing size
0 20 40 60 80 100
0 50 100 150 200
P
e
r
c
e
n
t
o
f
t
o
t
a
l
i
s
l
a
n
d
a
r
e
Island area
0 20 40 60 80 1000 20 40 60 80 100 120 140
[image:33.595.160.437.168.673.2]P
e
r
c
e
n
t
o
f
t
o
t
a
l
Chapter 4: Factors influencing the formation of unburned islands within a fire perimeter
0
0.05
0.1
0.15
0.2
0.25
0
20
40
60
80
100
120
140
L
_
S
1
2
3
4
5
6
0
20
40
60
80
100
120
140
C
P
A
Island area
A
[image:34.595.105.484.127.646.2]B
Figure 4 shows the relative importance of predictor variables on the frequency of islands, by means of classification tree, which is based in a learning sample of n=908. The area of the slope is one of the most influencing variables, followed by the percent of forests. Thus, more islands are expected in slopes with larger areas (≥ 15 ha), and larger amounts of forests (≥ 20%) (right side of the tree) . When the slope area is smaller, higher percents of forests (≥ 45%) favor larger island incidences, enhanced by the existence of higher volumes of wood (≥ 23 m3.ha-1), steeper slopes (≥ 8º), northern and western-faced slopes, lower understory (≥ 27%) and lower diversities (H<1.3). The predictive accuracy of this tree was of 56% (n-test sample=609).
When slopes with different categories of island areas are considered (Figure 5), large islands are conditioned by a minimum forest threshold (≥ 27.6%). Slopes with lower percent of forests are not very likely to form islands. Larger islands are formed in slopes with areas larger than 10 ha, higher percents of wood volume (≥ 23%) and lower infrastructures (< 0.25). Regarding this last variable, even though the number of islands is also high in slopes with high levels of infrastructures, the number of slopes with no islands increases drastically under this last condition (Figure 5). Steep slopes (≥ 21º) seem to slightly diminish the formation of large islands, enhancing the number of slopes without islands. When the are of the slope is lower than 10 ha, the presence of high percents of crops (≥ 28%) difficults the formation of large islands, which are more frequent in slopes with lower percents of crops, higher homogeneity (ASM≥ 0.4), higher volumes of wood (≥ 23.5%), and higher areas. The predictive accuracy of this tree was of 47% (n-test sample=609)
Table 1: Parametric and non-parametric tests for the 13 predictors of island formation. Significant coefficients (at α=0.05 when the sequential Bonferroni method is employed) are indicated in bold.
Variables Statistical test p-level
Forest (%) Kruskal-Wallis p<0.001 Shrubs (%) Kruskal-Wallis p<0.025 Crop-fields (%) Kruskal-Wallis p<0.001 Broadleaves (%) Kruskal-Wallis p<0.8
Slope (º) ANOVA p<0.001
Aspect ANOVA p<0.001
Area (ha) Kruskal-Wallis p<0.001 Understory (%) Kruskal-Wallis p<0.001 Volume of wood (m3.
ha-1)
Kruskal-Wallis p<0.001
Diversity (H’) ANOVA p<0.001
ASM ANOVA p>0.15
Infrastructures (num.ha-1)
Table 2: Descriptive statistics for the selected predictors of island formation, for each categories of island. Letters indicate the post-hoc differences among classes, calculated with the Fisher’s minimum significative distance, α=0.05. Post-hoc differences among categories are only displayed for the significant variables.
Table 3: Descriptive statistics for the aspect variable, versus the frequency of islands and the percent of unburned area.
Statistical test North East South West
Island frequency (num.ha-1) ANOVA n.s 0.25±0.3 0.26±0.4 0.25±0.5 0.23±0.2 Island area (%) ANOVA p<0.001 15.5±22.8 a 11.8±20.8 b,c 8.9±18 b 12.7±21.6 a,c
Variables Median Mean ± Standard deviation
0 1 2 0 1 2
Island frequency (num.ha-1) 0.00 0.2 0.6 0.00 ± 0.00 a 0.21 ± 0.09 b 0.76 ± 0.51 c
Island area (%) 0.00 4.8 34.3 0.00 ± 0.00 a 5.4 ± 4.0 b 40.3 ± 23.5 c
Forest (%) 52.2 75.8 69.4 53.8 ± 30.3 a 71.4 ± 21.4 b 64.96 ± 27.5 b
Shrubs (%) 3.3 1.6 1.4 10.8 ± 17.3 4.9 ± 7.7 9.53 ± 17.2 Crop-fields (%) 32.7 19.6 18.4 35.2 ± 27.9 a 23.5 ± 20.0 b 25.16 ± 24.0 b
Broadleaves (%) 1.5 1.6 1.4 4.4 ± 9.02.8 ± 4.4 2.90 ± 5.89 Slope (º) 2021.6 21.020.3 ± 6.9 a 21.8 ± 6.6 b 21.77 ± 6.93 b
Area (ha) 5.8 15.7 5.6 10.0 ± 19.2 a 27.3 ± 32.7 b 9.10 ± 11.2 a,b
Understory (%) 7.5 6.0 7.5 10.2 ± 10.0 a 8.2 ± 8.1 b 9.21 ± 9.38 a,b
Volume of wood (m3.ha-1) 37.5 37.5 37.5 36.1 ± 12.8 a 39.6 ± 11.7 b 40.6 ± 13.1 c
Diversity (H’) 1 1 1 1.0 ± 0.5 a 0.91 ± 0.5 b 0.90 ± 0.51 b
1
2 3
4 5 6 7
8 9 10 11 12 13 14 15 16 17 18 19
AREA≤15
FOREST≤45.2 FOREST≤20.4
AREA≤5.8
VOLWOOD≤22.7
SLOPE≤8.1
ASPECT=north and west
UNDERSTO≤26.6
H≤1.27 0
0 1
0 0 0 1
0 0 0 1 0 1 1 1 1 0 1 0 1 2 3 4 5
6 7 8 9
10 11 12 13
14 15 16 17
18 19 20 21
22 23
FOREST≤27.6
AREA≤10
CROPS≤27.6 VOLWOOD≤23
ASM≤.43166 INFRASTR≤0.25
VOLWOOD≤23.5 SLOPE≤20.6
AREA≤5.1 INFRASTR≤0.07
INFRASTR≤0.21 0
0 0
0 1
0 0 0 1
0 2 1 0
0 0 1 1
0 1 2 1
2 1
Figure 4: Classification tree for the frequency of unburned islands within each slope (n=981 cases were used to create the tree, and 609 were used to test the validity of the model.). Black bars indicate slopes with 0 islands. Bright green bars refer to slopes with low island incidences and dark green refer to high incidences. Red boxes are terminal nodes. Volwood:volumen of wood (m3.ha-1);Understo:understory (%); H:Shannon diversity. Numbers in the right top corner of the boxes refer to the predicted island category (0, 1, 2)