Attribution-NonCommercial-NoDerivatives 4.0 International (CC BY-NC-ND 4.0) license DOI. http://dx.doi.org/10.22201/fi.25940732e.2018.19n3.030
Abstract
This study compares the climate change signal (CCS) on hydrological indicators over an east central Mexican basin by using two 5-member ensemble climate simulations under the A2 emission scenario: a) the Canadian Regional Climate Model (CRCM) driven by the Canadian Global Model (CGC), hereinafter referred to as CRCM-CGC, and b) CGC simulations. The dynamically downscaled simulations generated from the regional climate model provide a higher resolution. However, both CGC and CRCM-CGC simulations are affected by systematic biases which were corrected before being used in a hydrological model. The bias corrected ensemble climate simulations were used to feed the hydrological model GR4J in order to obtain discharge simulations in a reference (1971-2000) and a future (2046-2065) period. Results show that, in the reference period, the CGC and CRCM-CGC simulations lead to a good representation of the hydrological annual cycle. Regarding the future period, climate simulations produce a decrease in strea-mflow and a change in the annual cycle. In particular, CRCM-CGC lead to a larger decrease on the selected indicators than CGC; for example, the median CCS on mean monthly streamflow is -48% and -59% for CGC and CRCM-CGC, respectively. Overall, the choice of CGC or CRCM-CGC yields to different CCS (similar direction but different magnitude) for the study basin. This aspect should be taken into account in the evaluation of climate change impact on water resources for those southern Mexican basins which are excluded from the CRCM and other regional climate models domain.
Keywords: Climate change impact, dynamical downscaling, hydrology.
Resumen
Este trabajo compara la Señal de Cambio Climático (SCC) sobre indicadores hidrológicos en una cuenca del centro-este de México utilizando dos ensambles (de 5 miembros) de simulaciones bajo el escenario de emisión A2: a) Simulaciones del Modelo Regional Canadiense (CRCM) conducido por el Modelo Global Canadiense (CGC), en lo sucesivo CRCM-CGC y b) simulaciones de CGC. Las simulaciones dinámicamente regionalizadas (por los modelos climáticos regionales) proporcionan una resolución más fina. Sin em-bargo, tanto CGC como CRCM-CGC presentan sesgos sistemáticos que se corrigieron antes de su utilización en un modelo hidroló-gico. Las simulaciones climáticas se usaron como datos de entrada del modelo hidrológico GR4J para obtener caudales en un periodo de referencia (1971-2000) y en un periodo futuro (2046-2065). Los resultados muestran que ambas simulaciones climáticas reproducen correctamente el ciclo hidrológico anual en el periodo de referencia. Por otro lado, el caudal simulado en el periodo futuro muestra un cambio en el ciclo anual y un decremento del caudal. Los resultados muestran que el decremento producido con CRCM-CGC es más grande que el obtenido con CGC. Por ejemplo, la SCC mediana en el caudal medio mensual es -48% y -59% para CGC y CRCM-CGC, respectivamente. En general, para la cuenca de estudio, la elección de CGC o CRCM-CGC conduce a una SCC de similar dirección, pero con diferente magnitud. Este aspecto debe tomarse en cuenta en la evaluación del impacto del cam-bio climático en aquellas cuencas mexicanas del sur del país fuera de los rangos de CRCM y de otros modelos regionales.
Descriptores: Impacto del cambio climático, regionalización dinámica, hidrología.
Comparing the climate change signal on a mexican basin’s hydrology evaluated with
global and regional climate simulations
Comparación de la señal de cambio climático en la hidrología de una cuenca mexicana
evaluada con simulaciones climáticas globales y regionales
Velázquez-ZapataJuan Alberto
Consejo Nacional de Ciencia y Tecnología-El Colegio de San Luis E-mail: javelazquezza@conacyt.mx
Dávila-Ortiz Rodrigo
IntroductIon
The modeling chain in the evaluation of the climate change impact on hydrology generally includes climate simulations (in reference and future periods) from a global climate model (GCM) which are used to feed a
hydrological model. Then, the simulated streamflow is
compared in order to obtain the climate change signal
between periods (Muerth et al., 2013). However, climate
change impact studies are often based on GCM simula-tions dynamically downscaled by a regional climate model (RCM) instead of direct GCM simulations (e.g.
Graham et al., 2007; Boé et al., 2009; Seiller and Anctil,
2014; Velázquez et al., 2015). In the dynamical
downsca-ling approach, GCMs provide the boundary conditions to RCMs leading to high resolution physically-based climate simulations that improve the climate variables
(Maraun et al., 2010). Nevertheless, GCM and RCM
si-mulations have systematic biases (i.e., differences bet -ween the climate model simulations and the observations) that should be corrected in order to obtain consistent
streamflow (Teutschbein et al., 2011).
Several studies have evaluated the advantages of
the fine resolution provided by RCMs over GCMs in the representation of streamflow. For example, the stu -dy of Hay and Clark (2003) evaluated the performance of a RCM and a GCM (before and after bias correction)
to reproduce observed streamflow in three large catch -ments in west U.S. Results show an advantage of the raw RCM simulations over the raw GCM outputs; thus,
the former led to more realistic runoff simulations;
however, both models showed a good performance
af-ter bias correction. On the other hand, Troin et al., (2015)
compared the climate change signal (CSS) on hydrolo-gical indicators obtained with a given GCM and a cou-pled RCM-GCM over two snowmelt-driven Canadian basins. Results show similar direction and magnitude
on the selected indicators, and authors claim that the use of GCM outputs can provide a good reproduction of the hydrological regime as RCMs do.
The scope of this study is the comparison of the cli-mate change signal on hydrological indicators evalua-ted with a) simulations from the Canadian Global Model (CGC) dynamically downscaled by the Cana-dian Regional Climate Model (CRCM-CGC) and b)
CGC simulations, over a Mexican basin. CRCM-CGC
simulations, as well as other RCMs simulations, are in-cluded in the NARCCAP (North American Regional
Climate Change Assessment Program) experiment
(Mearns, et al., 2009) which provides high resolution
cli-mate scenarios for North America. Even if there are
other experiments covering Mexico, NARCCAP provi -des easily available climate simulations in order to in-vestigate climate change impact on water resources.
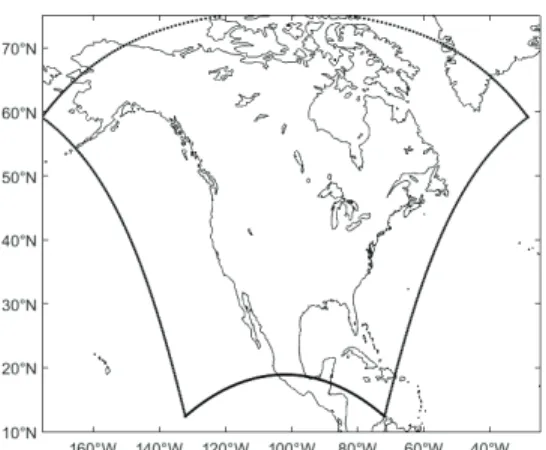
The topic is interesting since the Mexican territory is
partially covered by the CRCM-CGC (and other RCMs)
domain (Figure 1). Therefore, if the climate change on
hydrological indicators is similar either with the global or the regional climate simulations, the former could be
used with confidence in the evaluation of the climate change impact on water resources in southern Mexico
despite their lower resolution.
The manuscript is organized as follows: first, the
methods and data are presented, including the study basin, the climate model simulations, the bias correc-tion procedure and the hydrological model. Second, results of climate change signal on meteorological
va-riables and streamflow are presented. Finally, conclu -sions close the manuscript.
Methodsanddata
StudycatchmentandobServationaldataSet
The study catchment is the Tampaon River Basin
loca-ted in east-central Mexico (Figure 2), which covers an
area of 23 373 km2 (IMTA, 2016). The east part of the
basin is located in the Sierra Madre Oriental mountain chain, which provides an orographic barrier to the Oceans’ precipitation that leads to a variety of climatic regions within the basin: the east region presents a tro-pical Savannah (Aw) and trotro-pical monsoon (Am) cli-mate types; the central region has a temperate dry winter hot summer (Cwa) climate type and the west region presents an arid cold steppe (BSk) climate type (Peel et al., 2007).
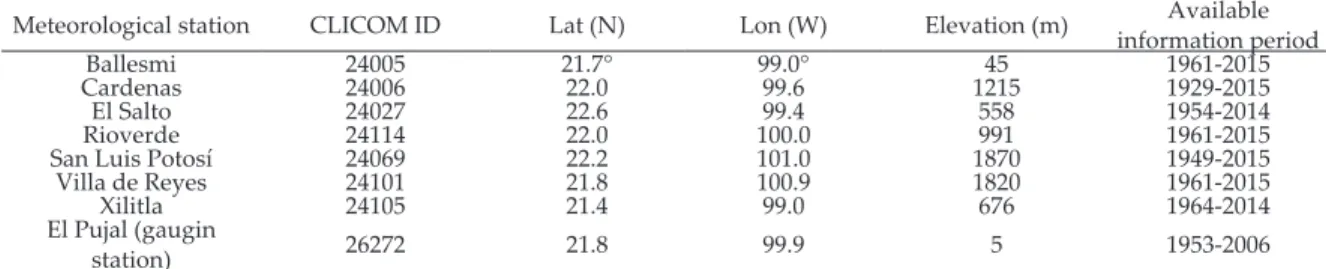
For this study, meteorological data from the stations depicted in Figure 2 were considered. The daily time series of precipitation and minimum and maximum
temperature were obtained from the Climatologic Data Set (CLICOM, 2017) for the 1971-2000 period. The Tam-paon River Basin has a mean annual temperature of
21.5⁰C and the area’s mean annual rainfall is 1080 mm.
Table 1 shows the description of the hydro-meteorolo-gical stations considered in this study. The homogenei-ty of the precipitation data was evaluated with the
Helmert test (e.g. Moreno et al., 2004). Results shows
issues with station 24027; however, the station was
re-tained, for the hydrological model efficiency was affec -ted when such data were removed.
The discharge data were obtained from the National Database of Surface Water (IMTA, 2016) for the 1971-2000 period. These data come from the gauging station El Pujal (I.D. 26272), located downstream the Valles Ri-ver. The gauging station drains the Tampaon River ba-sin, whose farthest headwater is the Santa Maria River.
This river flows west to east and its junction with the
Verde River makes the start of the Tampaon River.
From here, the Tampaon River flows to the northeast to
join the Gallinas River and the Valles River (Velázquez
et al., 2015). Figure 3 shows that the Tampaon River Ba
-sin presents two peak flows in July and September.
clIMatesIMulatIons
The climate simulations were taken from the Cana-dian Regional Climate Model (CRCM) version 4.2.3 (De Elía and Côté, 2010), driven by a 5-member
en-semble of the third generation Canadian Centre for Climate Modelling and Analysis Coupled Global
Cli-mate Model (CGC; Scinocca et al., 2008). In this inves
-tigation, the dynamically downscaled simulations
(hereinafter referred to as CRCM-CGC, ∼ 45 km) were
used along with the ensemble of climate simulations
obtained from CGC (∼ 400km), under the SRES
emis-sion scenario A2. The IPCC emisemis-sion scenarios are
al-ternative images of the future considering different of
demographic and socio-economic development and technological change. The increase of the global po-pulation and the technological change is more frag-mented and slower for scenario A2 than in other
scenarios. For instance, the projected change in mean global temperature is 3.4°C and 1.8°C for scenarios
A2 and B1, respectively, for decade 2090-2099
compa-red to decade 1980-1990 (IPCC, 2010). Therefore, sce -nario A2 generally provides a larger CSS than other scenarios.
An estimation of the natural variability is given by the 5-member ensemble, which was obtained by
repea-ting the climate change experiment using the climate
model with changes in the initial conditions induced by
small perturbations (Murphy et al., 2009). Periods
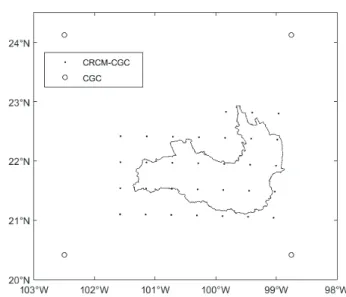
1971-2000 and 2046-2065 were selected for this study given
the data availability for both climate models. Figure 4
shows the grid points considered in evaluating the cli-mate change impact on the study basin for both the re-gional and the global climate model.
BIascorrectIonprocedure
The direct use of GCM or RCM climate simulations to feed a hydrological model generally leads to
unrealis-tic streamflow due to systemaunrealis-tic biases of the climate
models (Teutschbein et al., 2011). Therefore, the
co-rrection of the time series of temperature (T) and pre-cipitation (P) is necessary before being used in hydrological models.
The monthly bias between climate simulations and observations over the reference period (ref) is compu-ted as equation 1.
Table 1. Brief description of the hydro-meteorological stations used in this study
Meteorological station CLICOM ID Lat (N) Lon (W) Elevation (m) information period Available
Ballesmi 24005 21.7° 99.0° 45 1961-2015
Cardenas 24006 22.0 99.6 1215 1929-2015
El Salto 24027 22.6 99.4 558 1954-2014
Rioverde 24114 22.0 100.0 991 1961-2015
San Luis Potosí 24069 22.2 101.0 1870 1949-2015
Villa de Reyes 24101 21.8 100.9 1820 1961-2015
Xilitla 24105 21.4 99.0 676 1964-2014
El Pujal (gaugin
(1)
(2)
where and are the biases in temperature and precipitation, respectively; and are the ob-served variable values, and and are the
si-mulated variable values. The temperature is expressed
in °C and the precipitation in percentage (or in mm d-1
when no relative bias is considered).
The bias correction procedure used in this investiga-tion was proposed by Mpelasoka and Chiew (2009), and the method had been largely applied to climate
change impact studies (e.g. Chen, et al., 2013; Levison et
al., 2014; Velázquez et al., 2015). In this bias correction
method, a monthly transfer function between observa-tions and climate simulaobserva-tions is found for the reference period for a given number of percentiles:
(3)
(4)
where T(corr) and P(corr)are the bias-corrected variables,
the indexes correspond to percentile (q), monthly (m)
and daily (d) time steps, raw climate simulations (sim)
and observations (obs). In a second step, the transfer
function is applied to climate simulations in future riod under the hypothesis that the biases in future
pe-riod will be the same than in reference pepe-riod (Ho et al.
2012). For future period (fut), the corrected precipita -tion and temperature are obtained as:
(5)
(6)
For this study, fifty percentiles were calculated for each
month. The bias correction method was performed with the meteorological observations of each meteoro-logical station (see Table 1). Therefore, the climate mo-dels outputs were bias corrected and statistically downscaled for each meteorological station.
thehydrologIcalModelandthe
hydrologIcalIndIcators
The model used in this study is GR4J, which is a con
-ceptual lumped model that simulates streamflow at daily time step. GR4J uses mean daily precipitation (P)
and potential evapotranspiration (PE) as input varia-bles. PE was computed with the formulation proposed
by Oudin et al. (2005), which is based in mean
tempera-ture and incoming solar radiation. A complete
descrip-( )refm sim mref( ) obs mref( )
bT =T -T
( ) ( ) ( ) 1 ref sim m ref m ref obs m P bP P =
-( )refm
bT ( )ref m bP
( ) ref obs m
T Pobs mref( )
( ) ref sim m
T Psim mref( )
(refcorr d, ) sim dref( ) ( , )refm q
T =T -bT
( , )
( , )
1 1
ref ref
corr d d ref
m q P P bP = +
(corr,dfut ) sim dfut( ) ( , )refm q
T =T -bT
( , )
( , ) 1
1 fut fut
corr d d ref m q P P bP +
tion of GR4J can be found in Perrin et al. (2003). The
hydrological model was calibrated (1971-1985) and va
-lidated (1986-2000) over the study basin. The Nash-Sut
-cliffe Efficiency coefficient (NS; Nash and Sut-cliffe,
1970) was used to compare the observed and simulated
streamflow, and NS=1 corresponds to a perfect match between observed and simulated discharge. GR4J per
-forms well as the NS obtained was 0.87 and 0.72 for the
calibration and validation period, respectively.
Three hydrological indicators were used in this in-vestigation:
1. The mean monthly streamflow (Qm), which is the
mean of all of the daily values over a given monthly period.
2. The mean monthly high flow (Qmax), which is the
mean of the maximum streamflow values for a gi -ven month.
3. The mean monthly low flow (Qmin), which is the mean of the minimum streamflow values for a given
month.
The climate change signal (CCS) on hydrological
indi-cators (I) was computed as the differences of simulated
hydrological indicators from the reference ( )to the
future period ( )
(7)
resultsanddIscussIon
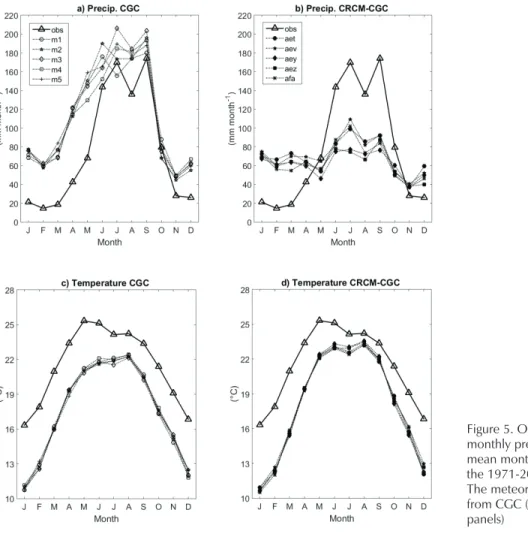
Figure 5 shows the observed and simulated mean
monthly precipitation and temperature over the Tam-paon River Basin for the 1971-2000 period. The mean precipitation was computed with the Thiessen Polygon method, while the mean temperature was computed
with the simple average. From Figures 5a and 5b, it can be seen that the maximum observed precipitation is presented in July and September, with a decrease in
August due to the midsummer drought (Magaña et al.,
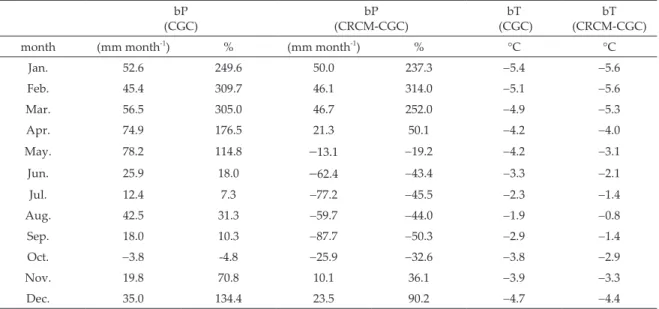
1999). Table 2 shows the mean monthly bias in
precipi-ref sim I fut
sim I
fut ref sim sim
ref sim
I I
CCS I
-=
tation and temperature as computed with Eq. 1 and 2.
The bias in precipitation is different for each climate model; for example, CGC (Figure 5a) overestimates
precipitation in the dry season (November to May),
thus, the bias ranges from 19.8 to 78.2 mm month-1, whi-le in the wet season (June to October) the bias ranges
from -3.8 to 42.5 mm month-1. On the other hand,
CRCM-CGC (Figure 5b) overestimates precipitation in
the dry season (from 10.1 to 50 mm month-1) and
under-estimates it in the wet season (from about -25.9 to -87.7
mm month-1).
Regarding the mean monthly temperature, Figures
5c and 5d show the observed annual cycle with a
mini-mum on January (16.3°C) and a maximini-mum on May
(25.1°C). The bias in temperature is comparable in both climate models; that is, a general underestimation with
values of about -5.5°C in January and from -0.8°C to
-1.9°C in August. We can say that, despite the higher
re-solution, the regional climate model did not reduce the systematic bias of the global climate model simulations.
Figure 6 depicts the climate change signal on preci -pitation and temperature before and after bias correc-tion. Regarding precipitation, the CCS for raw CGC
ranges from -13 to -17%, and after bias correction, the
CCS ranges from -13% to -19%. In addition, the CCS
on precipitation for CRCM-CGC ranges from -24 to
-27%, and from -26 to -29% before and after bias
rrection, respectively. These results show that bias co-rrection changes the climate change signal. In that
aspect, Muerth et al. (2013) claim that bias correction
of climate simulations does not guarantee physical
consistency and may affect the climate change signal to some extent.
On the other hand, the climate change signal on temperature ranges from 2.3°C to 2.6°C for CGC, whe-reas for CRCM-CGC the CSS ranges from 2.7° to 2.9°.
The CSS in temperature is not significantly changed af
-ter bias correction. Furthermore, results show that the
climate change signal is larger for CRCM-CGC than for CGC for both meteorological variables.
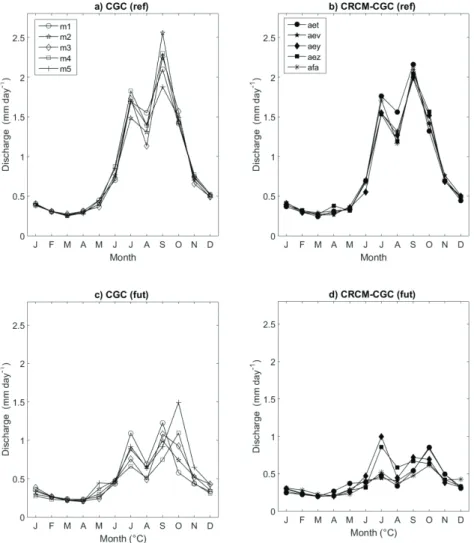
In the next step, GR4J was fed with bias corrected climate simulations in order to obtain streamflow simu
-lations in reference and future periods. Figures 7a and
7b show the hydrological annual cycle in the reference period as simulated with CGC and CRCM-CGC, res-pectively. Both climate simulations reproduce the ob-served annual cycle as well as the midsummer drought.
Regarding future period (Figure 7c and 7d), both types of climate simulations lead to a decrease on streamflow,
especially CRCM-CGC. Moreover, the annual cycle in
future period is somewhat modified, since October’s streamflow is higher that September’s streamflow for
some simulations (e.g. aey and aez).
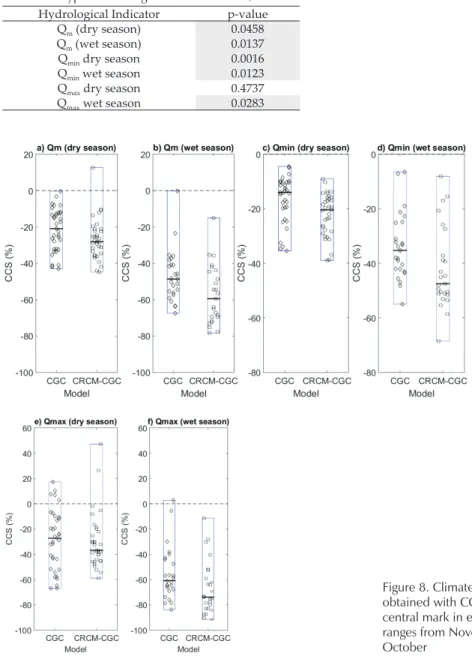
The simulated streamflow was used to compute the monthly hydrological indicators. Figure 8 shows the
climate change signal on hydrological indicators eva-luated for each member of the ensemble. The CCS was
calculated over the same member; for example, the CCS
for CGC member 1 was computed between member 1 in reference period and member 1 in future period.
Such procedure leads to five CCS values for a given month and for a given hydrological indicator. Also, Fi
-Table 2. Mean monthly bias in precipitation (bP) and temperature (bT) for the reference (1971-2000) period. The values are the average of the 5-member ensemble
bP
(CGC) (CRCM-CGC)bP (CGC)bT (CRCM-CGC)bT
month (mm month-1) % (mm month-1) % °C °C
Jan. 52.6 249.6 50.0 237.3 -5.4 -5.6
Feb. 45.4 309.7 46.1 314.0 -5.1 -5.6
Mar. 56.5 305.0 46.7 252.0 -4.9 -5.3
Apr. 74.9 176.5 21.3 50.1 -4.2 -4.0
May. 78.2 114.8 -13.1 -19.2 -4.2 -3.1
Jun. 25.9 18.0 -62.4 -43.4 -3.3 -2.1
Jul. 12.4 7.3 -77.2 -45.5 -2.3 -1.4
Aug. 42.5 31.3 -59.7 -44.0 -1.9 -0.8
Sep. 18.0 10.3 -87.7 -50.3 -2.9 -1.4
Oct. -3.8 -4.8 -25.9 -32.6 -3.8 -2.9
Nov. 19.8 70.8 10.1 36.1 -3.9 -3.3
Figure 7. Mean monthly discharge as simulated with CGC (left panels) and CRCM-CGC (right panels) simulations for the reference (1971-2000; upper panels) and future (2046-2065; lower panels) periods
gure 8 displays the CCS separated for the dry season (November to May) and for the wet season (June to Oc
-tober). The comparison of the median values in Figure 8 shows that, for all hydrological indicators, the CCS
obtained with CRCM-CGC is larger than the CSS obtai-ned with CGC. In addition, the decrease on hydrologi-cal indicators is larger for the wet season than for the
dry season. For example, the median value of the CCS on Qm in the dry season (Figure 8a) is -21% and -28%
for CGC and CRCM-CGC, respectively. Similarly, for
the wet season (Figure 7b) the median CSS on Qm is -48% and -59% for CGC and CRCM-CGC,
respecti-vely. Comparing hydrological indicators, the most
im-portant decrease is estimated for Qmax in the wet season
(Figure 7f), with values of -61% and -73% for CGC and CRCM-CGC, respectively.
The Wilcoxon test (Wilcoxon, 1945) was used to
compare the CCS on hydrological indicators obtained with CGC and CRCM-CGC. The null hypothesis is that two series of data are independent samples from iden-tical distribution with equal medians (Wilks, 2006).
Ta-ble 3 shows the result of the Wilcoxon test (p-value) performed to the series showed in Figure 8. In this ta -ble, it can be seen that the null hypothesis is rejected for
Table 3. Results of Wilcoxon test comparing the hydrological indicators obtained with CGC and CRCM-CGC. The p-value is shown and the shaded area indicates a rejection of the null hypothesis at significance level of 5%
Hydrological Indicator p-value
Qm (dry season) 0.0458 Qm (wet season) 0.0137 Qmin dry season 0.0016 Qmin wet season 0.0123 Qmax dry season 0.4737
Qmax wet season 0.0283
all indicators, but for Qmax in the dry season (with a
p-value of 0.4737), for the CSS in precipitation is smaller in the dry season than in the wet season.
The results of this study indicate that the CCS
obtai-ned with both types of climate simulations are different.
Therefore, for the considered climate models, the choice of using the CGM simulations with or without the dyna-mical downscaling is an important aspect in the evalua-tion of the climate change impact on water resources.
conclusIons
This study compares the climate change signal on me-teorological variables and hydrological indicators ob-tained with two 5-member ensembles of climate simulations for a reference (1971-2000) and a future (2046-2065) periods under the emission scenario A2: a) Canadian Global Climate Model (CGC) simulations dy-namically downscaled by the Canadian Regional Cli-mate Model (CRCM-CGC) and b) CGC simulations. The CRCM domain (as well as the domain of other
cli-mate models in the NARCCAP experiment) partially covers the Mexican territory; thus, the climate change impact on southern Mexicans basins cannot be evalua -ted with such simulations, losing the advantage of the higher resolution provided by the regional climate mo-del. Therefore, this study assesses if the climate change signal obtained with the selected global and regional climate models is similar on direction and magnitude
in one Mexican basin.
Results show that both types of climate simulations present biases in temperature and precipitation that do not allow their direct use to feed a hydrological model: CGC generally overestimates precipitation while CRCM-GCG underestimates precipitation in the wet
season (June to October) and overestimates it in the dry
season (November to May). On the other hand, both ty-pes of climate simulations generally underestimate temperature. Results also show that bias correction of climate simulations changes the climate change signal on meteorological variables, mainly in precipitation. Overall, CRCM-CGC leads to a larger climate change signal than CGC on meteorological variables.
The bias-corrected climate simulations were used to
feed the hydrological model GR4J. The resulting strea
-mflow simulations allowed the evaluation of the hydro -logical annual cycle. Results show that, in the reference period, both types of climate simulations lead to a co-rrect representation of the hydrological regime, inclu-ding the midsummer drought. Nevertheless, future
streamflow simulations indicate a change on the hydro -logical regime, especially in the wet season.
The evaluation of the climate change signal on hy-drological indicators shows that CRCM-CGC
simula-tions yield to a larger decrease on streamflow than CGC
simulations, especially for the wet season. Thus, the choice of using global or regional climate simulations is an important aspect in the assessment of the climate change impact on water resources for the study basin.
Our results differ from the study of Troin et al., (2015)
which did not find significant difference on the climate
change signal on hydrological indicators evaluated with the global climate model and its dynamical downscaling over two Canadian basins. In that aspect, such Canadian basins have a hydrological regime which is highly sensitive to changes in temperature, for
they are snow-melt driven basins which present maxi
-mum peak flows in spring. On the contrary, the Mexi -can basin in this study is rainfall-driven, so it is more sensitive to changes in precipitation, especially in the summer. In addition, the choice of the hydrological
mo-del has an influence on the simulation of streamflow
(Velázquez et al., 2015), and future work should include
several hydrological models to tackle this issue. Also, climate simulations obtained with the recent
represen-tative concentration pathways (van Vuuren et al., 2011)
should be taken into account.
acknowledgMents
The authors thank the research groups that made avai-lable the hydrometeorological data and the climate si-mulations. The authors acknowledge the fruitful comments of two anonymous reviewers. Rodrigo
Dávi-la thanks El Colegio de San Luis for the financial sup -port for his research internship.
references
Boé J., Terray L., Martin E., Habets F. Projected changes in compo
-nents of the hydrological cycle in French river basins during
the 21st century. Water Resources Research, volume 45 (issue 8), 2009: W08426, doi:10.1029/2008WR007437.
Chen J., Brissette F.P., Chaumont D., Braun M. Performance and
uncertainty evaluation of empirical downscaling methods in quantifying the climate change impacts on hydrology over two North American river basins. Journal of Hydrology, volu-me 479, 2013: 200-214.
CLICOM. Base de Datos Climatológica Nacional [en línea] [fecha de consulta: 16 de marzo de 2017], Centro de Investigación
De Elía R. and Côté H. Climate and climate change sensitivity to
mo-del configuration in the Canadian RCM over North America.
Meteorologische Zeitschrift, volume 19 (issue 4), 2010: 325- 339.
Graham L.P., Hagemann S., Jaun S., Beniston M. On interpreting
hydrological change from regional climate models. Climatic Change, volume 81 (issue1), 2007: 97-122.
Hay L.E. and Clark M.P. Use of statistically and dynamically downscaled atmospheric model output for hydrologic simu-lations in three mountainous basins in the western United States. Journal of Hydrology, volume 282 (issue 1), 2003: 56-75. Ho C.K., Stephenson D.B., Collins M., Ferro C.A.T., Brown S.J. Ca
-libration strategies: a source of additional uncertainty in cli-mate change projections. Bulletin of the American Meteorological Society, volume 93 (issue 1), 2012: 21-26.
IMTA, Banco Nacional de Datos de Aguas Superficiales (BANDAS)
[en línea] [fecha de consulta: 16 de marzo de 2016], Instituto
Mexicano de Tecnología del Agua, Jiutepec, Morelos, México,
2016. Disponible en: http://www.conagua.gob.mx/CONA
-GUA07/Contenido/Documentos/Portada%20BANDAS.htm. IPCC, 2010. Emissions Scenarios: IPCC Special Report. N.
Nakice-novic and R. Swart, Eds. Cambridge Univ. Press, Cambridge.
Levison J., Larocque M., Fournier V., Gagné S., Pellerin S., Ouellet
M.A. Dynamics of a headwater system and peatland under cu-rrent conditions and with climate change. Hydrological Proces-ses, volume 28 (issue 17), 2014: 4808-482. doi: 10.1002/hyp.9978. Magaña V., Amador J.A., Medina S. The midsummer drought
over Mexico and Central America. Journal of Climate, volume
12 (issue 6), 1999: 1577-1588.
Maraun D., Wetterhall F., Ireson A.M., Chandler R.E., Kendon E.J., Widmann M., Brienen S., Rust H.W., Sauter T., The
-meßl M., Venema V.K.C., Chun K.P., Goodess C.M., Jones
R.G., Onof C., Vrac M., Thiele-Eich I. Precipitation downs-caling under climate change: Recent developments to brid-ge the gap between dynamical models and the end user. Reviews of Geophysics, volume 48 (issue 3), 2010: RG3003. doi:10.1029/2009RG000314
Mearns L.O., Gutowski W.J., Jones R., Leung L.-Y., McGinnis S., Nunes A.M.B., Qian Y. A regional climate change assessment
program for North America. Eos, Trans. Amer. Geophys. Union, volume 90 (issue 36), 2009:311-312.
Moreno-Castro D., Campos-Aranda D.F., Cisneros-Almazán R.
Estadística climatológica del observatorio meteorológicos de San Luis Potosí (1877-2000), Universidad Autónoma de San Luis
Potosí, México, 2004, p. 52.
Mpelasoka F.S. and Chiew F.H.S. Influence of rainfall scenario construction methods on runoff projections. Journal of Hydro-meteorology, volume 10 (issue 5), 2009: 1168-1183.
Muerth M.J., Gauvin St-Denis B., Ricard S., Velázquez J.A., Schmid J., Minville M., Caya D., Chaumont D., Ludwig R., Turcotte R.
On the need for bias correction in regional climate scenarios to
assess climate change impacts on river runoff. Hydrology and Earth System Sciences, volume 17 (issue 3), 2013: 1189-1204.
Murphy J.M., Sexton D.M.H., Jenkins G.J., Booth B.B.B., Brown C.C., Clark R.T., Collins M., Harris G.R., Kendon E.J., Betts R.A., Brown S.J., Humphrey K.A., McCarthy M.P., McDonald
R.E., Stephens A., Wallace C., Warren R., Wilby R., Wood R.A. UK Climate Projections Science Report: Climate change projec-tions, Exeter, UK., Met Office Hadley Centre, 2009, 192 pp. Nash J.E. and Sutcliffe J.V. River flow forecasting through concep
-tual models part 1-A. Discussion of principles. Journal of Hy-drology, volume 10 (issue 3), 1970: 282-290.
Oudin L., Hervieu F., Michel C., Perrin C., Andreassian V., Anctil F., Loumagne C. Which Potential Evapotranspiration Input for a Lumped Rainfall-Runoff Model? Part 2 – Towards a Sim
-ple and Efficient Potential Evapotranspiration Model for Ra
-infall Runoff Modelling. Journal of Hydrology, volume 303 (issue1), 2005: 290-306.
Peel M.C., Finlayson B.L., McMahon T.A. Updated world map of the Köppen-Geiger climate classification. Hydrology and Earth System Sciences, volume 11, 2007: 1633-1644.
Perrin C., Michel C., Andréassian V. Improvement of a
Parsimo-nious Model for Streamflow Simulation. Journal of Hydrology,
volume 279 (issue 1-4), 2003: 275-289.
Scinocca J.F., Mcfarlane N.A., Lazare M., Li J., Plummer D. The CCCma third generation AGCM and its extension into the
middle atmosphere. Atmospheric Chemistry and Physics,
volu-me 8, 2008:7055-7074.
Seiller G. and Anctil F. Climate Change Impacts on the Hydrolo -gic Regime of a Canadian River: Comparing Uncertainties Arising from Climate Natural Variability and Lumped Hy-drological Model Structures. Hydrology and Earth System Scien-ces, volume 18 (issue 6), 2014: 2033-2047.
Teutschbein C., Wetterhall F., Seibert J. Evaluation of Different
Downscaling Techniques for Hydrological Climate-Change Impact Studies at the Catchment Scale. Climate Dynamics,
vo-lume 37(issue 9-10), 2011: 2087-2105.
Troin M., Caya, D, Velázquez J.A., Brissette F. Hydrological res -ponse to dynamical downscaling of climate model outputs: A case study for western and eastern snowmelt-dominated Ca-nada catchments. Journal of Hydrology: Regional Studies, volu-me 4, 2015:595-610.
Van-Vuuren D.P., Edmonds J., Kainuma M.K., Riahi-Thomson A., Hibbard K., Hurtt G.C., Kram T., Krey V., Lamarque J.F., Ma
-sui T., Meinshausen M., Nakicenovic N., Smith S.J., Rose S.K.
The representative concentration pathways: an overview. Cli-matic Change, volume 109 (issue 5), 2011. doi:10.1007/s10584-011-0148-z
Velázquez J.A., Troin M., Caya D. Hydrological Modelling of the Tampaon River in the context of climate change. Tecnología y Ciencias del Agua, volume 6 (issue 5), 2015: 17-30.
Wilcoxon F. Individual Comparisons by Ranking Methods. Biome-trics Bulletin, volume 1 (issue 6), 1945: 80-83.
Suggested citation:
Chicago style citation
Velázquez-Zapata, Juan Alberto, Rodrigo Dávila-Ortiz. Comparing the climate change signal on a mexican basin›s hydrology evaluated with global and regional climate simulations. Ingeniería Investigación y Tecnología, XIX, 03 (2018): 355-365.
ISO 690 citation style
Velázquez-Zapata J.A., Dávila-Ortiz R. Comparing the climate change signal on a mexican basin›s hydrology evaluated with global and re-gional climate simulations. Ingeniería Investigación y Tecnología, volu-me XIX (issue 3), July-September 2018: 355-365.
aBouttheauthors
Velázquez-Zapata Juan Alberto. Received a Civil Engineering degree and an Environ-mental Engineering Master´s degree from the Autonomous University of San Luis
Potosí, Mexico. He received his Ph.D. in Civil Engineering from Laval University at Québec City, Canada. Currently, he is a CONACYT (National Council of Scien -ce and Technology) researcher at El Colegio de San Luis. His research interests are related to hydro-meteorological risk and climate change impact on water resour-ces.