C a l i f o rn ia
M
a n a g e m e n t
Review
Blue Ocean Strategy:
From Theory to Practice
W. Chan Kim
Renée Mauborgne
F
ROM
T
HEORY TO
P
RACTICE
W. Chan Kim Renée Mauborgne
F
or twenty-five years, competition has been at the heart of corporate strategy. Today, one can hardly speak of strategy without involving the language of competition: competitive strategy, competitive benchmarking, building competitive advantages, and beating the competition. Such focus on the competition traces back to corporate strategy’s roots in military strategy. The very language of corporate strategy is deeply imbued with military references—chief executive “officers” in “headquarters,” “troops” on the “front lines,” and fighting over a defined battlefield.1Industrial organization (IO) economics gave formal expression to the prominent importance of competition to firms’ success. IO economics suggests a causal flow from market structure to conduct and performance.2Here, market
structure, given by supply and demand conditions, shapes sellers’ and buyers’ conduct, which, in turn, determines end performance.3 The academics call this the structuralist view, or environmental determinism. Taking market structure as given, much as military strategy takes land as given, such a view drives compa-nies to try to carve out a defensible position against the competition in the exist-ing market space. To sustain themselves in the marketplace, practitioners of strategy focus on building advantages over the competition, usually by assessing what competitors do and striving to do it better. Here, grabbing a bigger share of the market is also seen as a zero-sum game in which one company’s gain is achieved at another company’s loss. Hence, competition, the supply side of the equation, remains the defining variable of strategy with the focus on dividing up existing industry space.
Not surprisingly, the result has been a fairly good understanding of how to compete skillfully in established markets, from analyzing the underlying eco-nomic structure of an existing industry to choosing a strategic position of low cost or differentiation or focus.4The arsenal of analytic tools and frameworks ranging from the five force framework to the value chain successfully anchored competition at the core of strategy. But should it be?
Our research over the last fifteen years suggests no. Of course competition matters. However, by focusing on the strategies of competition, companies and scholars have ignored a very important—and, we would argue, more lucrative— aspect of strategy. This involves not competing, but making the competition irrelevant by creating a new market space where there are no competitors— what we call a “blue ocean.”
Blue Oceans
Imagine a market universe composed of two sorts of oceans: red oceans and blue oceans. Red oceans represent all the industries in existence today. This is the known market space. Blue oceans denote all the industries not in existence today. This is the unknown market space.
In the red oceans, industry boundaries are defined and accepted, and the competitive rules of the game are known.5 Here companies try to outperform their rivals to grab a greater share of existing demand. The dominant focus of strategy work over the past twenty-five years has been on competition-based red ocean strategies.6As the market space of red oceans gets crowded, prospects for profits and growth are reduced. Products become commodities, and cutthroat competition turns the red ocean bloody. Hence we use the term “red” oceans.
Blue oceans, in contrast, are defined by untapped market space, demand creation, and the opportunity for highly profitable growth. Although some blue
oceans are created well beyond existing industry boundaries, most are created from within red oceans by expanding existing industry boundaries. In blue oceans, compe-tition is irrelevant because the rules of the game are waiting to be set. The term “blue ocean” is an analogy to describe the wider potential of market space that is vast, deep, and not yet explored.
It will always be important to navigate successfully in the red ocean by outcompeting rivals. Red oceans will always matter and will always be a fact of business life. However, with supply exceeding demand in more industries, com-peting for a share of contracting markets, while necessary, will not be sufficient to sustain high performance. Companies need to go beyond competing in estab-lished industries. To seize new profit and growth opportunities, they also need to create blue oceans.
W. Chan Kim is The Boston Consulting Group Bruce D. Henderson Chair Professor of Strategy and International Management at INSEAD. <[email protected]>
Renée Mauborgne is The INSEAD Distinguished Fellow and a professor of strategy and
The Impact of Creating Blue Oceans
We conducted a study of business launches in 108 companies. We found that 86% of these launches were line extensions, i.e., incremental improve-ments to existing industry offerings within red oceans, while a mere 14% were aimed at creating new markets or blue oceans. While line extensions in red oceans did account for 62% of the total revenues, they only delivered 39% of the total profits. By contrast, the 14% invested in creating blue oceans delivered 38% of total revenues and a startling 61% of total profits. Given that business launches included the total investments made for creating red and blue oceans (regardless of their subsequent revenue and profit consequences, including fail-ures), the performance benefits of creating blue oceans are evident (see Figure 1).
The Rising Imperative of Creating Blue Oceans
There are several driving forces behind a rising imperative to create blue oceans. Accelerated technological advances have substantially improved indus-trial productivity and have allowed suppliers to produce an unprecedented array of products and services. The trend toward globalization compounds the situa-tion. As trade barriers between nations and regions are dismantled and as infor-mation on products and prices becomes instantly and globally available, niche markets and monopoly havens continue to disappear.7 While supply is on the rise as global competition intensifies, there is no clear evidence of an increase in demand worldwide, and statistics even point to declining populations in many developed markets.8
The result has been accelerated commoditization of products and services, increasing price wars, and shrinking profit margins. Recent industry-wide stud-ies on major American brands confirm this trend.9 They reveal that for major product and service categories, brands are generally becoming more similar,
FIGURE 1.
The Profit and Growth Consequences of Creating Blue Oceans62%
39%
86%
38%
61%
14%
Business Launches
Revenue Impact
Profit Impact
and as they are becoming more similar people increasingly select based on price.10 People no longer insist, as in the past, that their laundry detergent be Tide. Nor will they necessarily stick to Colgate when Crest is on sale, and vice versa. In overcrowded industries, differentiating brands becomes harder both in economic upturns and in downturns.
All this suggests that the business environment in which most strategy and management approaches evolved is increasingly disappearing. As red oceans become increasingly bloody, management will need to be more concerned with blue oceans than the current cohort of managers is accustomed to.
Blue Ocean Strategy
Although economic conditions indicate the rising imperative of blue oceans, there is a general belief that the odds of success are lower when compa-nies venture beyond existing industry space.11 The issue is how to succeed in blue oceans. How can companies systematically maximize the opportunities while simultaneously minimizing the risks of creating blue oceans?
Of course, there is no such thing as a riskless strategy.12Strategy will always involve both opportunity and risk, be it a red ocean or a blue ocean ini-tiative. At present, however, there is an overabundance of tools and analytical frameworks to succeed in red oceans. As long as this remains true, red oceans will continue to dominate companies’ strategic agenda even as the business imperative for creating blue oceans takes on new urgency. Perhaps this explains why companies—despite prior calls to go beyond existing industry space—have yet to act seriously on these recommendations. While executives have received calls to be brave and entrepreneurial, to learn from failure, and to seek out revo-lutionaries, as thought-provoking as these ideas may be, they are not substitutes for analytics to navigate successfully in blue waters.
We have spent more than a decade studying over 150 blue ocean creations in over 30 industries spanning more than 100 years from 1880 to 2000. Our central research question was whether there was a pattern by which blue oceans are created and high performance achieved.
A Reconstructionist View of Strategy
There are common characteristics across blue ocean creations. In sharp contrast to companies playing by traditional rules, the creators of blue oceans never used the competition as their benchmark. Instead they made it irrelevant by creating a leap in value for both buyers and the company itself.
strategy is essentially a choice between differentiation and low cost.13 In the reconstructionist world, however, the strategic aim is to create new rules of the game by breaking the existing value/cost trade-off and thereby creating a blue ocean.
Recognizing that structure and market boundaries exist only in managers’ minds, practitioners who hold the reconstructionist view do not let existing mar-ket structures limit their thinking. To them, extra demand is out there, largely untapped. The crux of the problem is how to create it. This, in turn, requires a shift of attention from supply to demand, from a focus on competing to a focus on leaving the competition behind. It involves looking systematically across established boundaries of competition and reordering existing elements in differ-ent markets to reconstruct them into a new market space where a new level of demand is generated.14
In the reconstructionist view, there is scarcely any attractive or unattrac-tive industry per se because the level of industry attracunattrac-tiveness can be altered through companies’ conscientious efforts of reconstruction. As market structure is changed in the reconstruction process, so are the rules of the game. Competi-tion in the old game is therefore rendered irrelevant. By stimulating the demand side of the economy, blue ocean strategy expands existing markets and creates new ones.
The creation of blue oceans is about driving costs down while simultane-ously driving value up for buyers. This is how a leap in value for both the com-pany and its buyers is achieved. Because buyer value comes from the utility and price that the company offers to buyers and because the value to the company is generated from price and its cost structure, blue ocean strategy is achieved only when the whole system of the company’s utility, price, and cost activities is properly aligned. It is this whole-system approach that makes the creation of blue oceans a sustainable strategy. Blue ocean strategy integrates the range of a firm’s functional and operational activities. In this sense, blue ocean strategy is more than innovation. It is about strategy that embraces the entire system of a company’s activities.15
Analytical Frameworks and Tools
In an attempt to make the formulation of blue ocean strategy as system-atic and actionable as competing in the red waters of the known market space, we studied companies around the world and developed practical methodologies in the quest of blue oceans. We then applied and tested these tools and frame-works in action by working with companies in their pursuit of blue oceans, enriching and refining them in the process in an attempt to move from a theory of reconstructionism to practical application.
These wines compete head-to-head with imported wines from France, Italy, and Spain and New World wines from countries such as Chile, Australia, and Argentina, which have increasingly targeted the U.S. market. With the supply of wines increasing from Oregon, Washington, and New York State and with newly mature vineyard plantings in California, the number of wines has exploded. Yet the U.S. consumer base has essentially remained stagnant. The United States remains stuck at thirty-third place in world per capita wine consumption.
The intense competition has fueled ongoing industry consolidation. The top eight companies produce more than 75 percent of the wine in the United States, and the estimated one thousand six hundred other wineries produce the remaining 25 percent. There is a simultaneous consolidation of retailers and distributors across the United States, something that raises their bargaining power against the plethora of winemakers. Titanic battles are being fought for retail and distribution space. Downward pressure on wine prices has set in.
In short, the U.S. wine industry faces intense competition, mounting price pressure, increasing bargaining power on the part of retail and distribution chan-nels, and flat demand despite overwhelming choice. Following conventional strategic thinking, the industry is hardly attractive. For strategists, the critical question is, how do you break out of this red ocean of bloody competition to make the competition irrelevant? How do you open up and capture a blue ocean of uncontested market space?
The Strategy Canvas
The strategy canvas is both a diagnostic and an action framework for building a compelling blue ocean strategy. It serves two purposes. First, it cap-tures the current state of play in the known market space. This allows you to understand where the competition is currently investing; the factors the indus-try currently competes on in products, service, and delivery; and what customers receive from the existing competitive offerings on the market. Figure 2 captures all this information in graphic form. The horizontal axis captures the range of factors the industry competes on and invests in.
In the case of the U.S. wine industry, there are seven principal factors:
▪ price per bottle of wine;
▪ an elite, refined image in packaging, including labels announcing the wine medals won and the use of esoteric enological terminology to stress the art and science of winemaking;
▪ above-the-line marketing to raise consumer awareness in a crowded mar-ket and to encourage distributors and retailers to give prominence to a particular wine house;
▪ aging quality of wine;
▪ the prestige of a wine’s vineyard and its legacy (hence the appellations of estates and chateaux and references to the historic age of the
▪ the complexity and sophistication of a wine’s taste, including such things as tannins and oak; and
▪ a diverse range of wines to cover all varieties of grapes and consumer preferences from Chardonnay to Merlot, and so on
These factors are viewed as key to the promotion of wine as a unique beverage for the informed wine drinker, worthy of special occasions.
That is the underlying structure of the U.S. wine industry from the mar-ket perspective. The vertical axis of the strategy canvas captures the offering level that buyers receive across all of these key competing factors. A high score means that a company offers buyers more, and hence invests more, in that fac-tor. In the case of price, a higher score indicates a higher price. We can now plot the current offering of wineries across all these factors to understand wineries’ strategic profiles, or value curves. The value curve, the basic component of the strategy canvas, is a graphic depiction of a company’s relative performance across its industry’s factors of competition.
Figure 2 shows that, although more than one thousand six hundred wineries participate in the U.S. wine industry, from the buyer’s point of view there is enormous convergence in their value curves. Despite the plethora of competitors, when premium brand wines are plotted on the strategy canvas, we discover that from the market point of view all of them essentially have the same strategic profile. They offer a high price and present a high level of offering across all the key competing factors. Their strategic profile follows a
FIGURE 2.
The Strategy Canvas of U.S. Wine Industry in the Late 1990sBudget Wines
High
Low Price
Use of
Enological Terminology and Distinctions in Wine
Communication
Wine Complexity Aging
Quality
Vineyard Prestige and Legacy
Wine Range
Premium Wines
classic differentiation strategy. From the market point of view, however, they are all different in the same way. On the other hand, budget wines also have the same essential strategic profile. Their price is low, as is their offering across all the key competing factors. These are classic low-cost players. Moreover, the value curves of premium and low-cost wines share the same basic shape. The two strategic groups’ strategies march in lockstep, but at different altitudes of offering level.
To set a company on a strong, profitable growth trajectory in the face of these industry conditions, it won’t work to benchmark competitors and try to outcompete them by offering a little more for a little less. Such a strategy may nudge sales up but will hardly drive a company to open up uncontested market space. Nor is conducting extensive customer research the path to blue oceans. Our research found that customers can scarcely imagine how to create uncon-tested market space. Their insight also tends toward the familiar “offer me more for less.” What customers typically want “more” of are those product and service features that the industry currently offers.
To fundamentally shift the strategy canvas of an industry, a company must begin by reorienting its strategic focus from competitors to alternatives, and from customers to noncustomers of the industry.16 To pursue both value and cost, companies should resist the old logic of benchmarking competitors in the exist-ing field and choosexist-ing between differentiation and cost leadership. As a com-pany shifts its strategic focus from current competition to alternatives and noncustomers, it gains insight into how to redefine the problem the industry focuses on and thereby how to reconstruct buyer value elements that reside across industry boundaries. Conventional strategic logic, by contrast, drives a company to offer better solutions than rivals to existing problems defined by an industry.
In the case of the U.S. wine industry, the problem the industry focused on was how to create a more sophisticated wine for special occasions. The two strategic groups—premium wines and budget wines—both strove to better answer this question; the only difference was that the premium wines strove |to create a more sophisticated wine for special occasions for those able to spend significant money, while budget wines strove to do the same but for people on tight budgets. In essence, conventional wisdom caused wineries to focus on over-delivering on prestige and the quality of wine at its price point. Over-deliv-ery meant adding complexity to the wine based on taste profiles shared by wine-makers and reinforced by the wine show judging system. Winewine-makers, show judges, and knowledgeable drinkers concur that complexity—layered personal-ity and characteristics that reflect the uniqueness of the soil, season, and wine-maker’s skill in tannins, oak, and aging processes—equates with quality.
Wines found that the mass of American adults saw wine as a turnoff. While the noncustomers outnumbered the customers three to one, the industry, so focused on competition, had ignored this population. By looking to industry alternatives and non-customers, Casella learned that to the mass of Americans wine was intimidating and pretentious, and the complexity of wine’s taste created flavor challenges for the average person even though it was the basis on which the industry fought to excel. With this insight, Casella Wines was ready to explore how to redraw the strategic profile of the U.S. wine industry to create a blue ocean. To achieve this, it turned to the second basic analytic underlying blue oceans: the four actions framework.
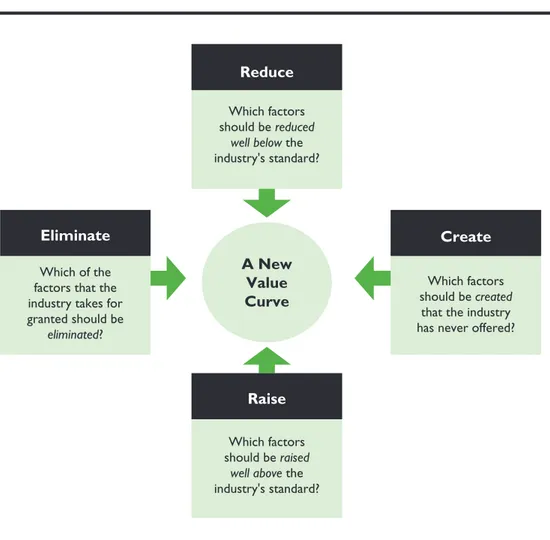
The Four Actions Framework
To reconstruct buyer value elements in crafting a new value curve, we have developed the four actions framework (see Figure 3) that asks four key questions to challenge an industry’s strategic logic and business model:
▪ The first question forces a company to consider eliminating factors that companies in an industry have long competed on. Often those factors are taken for granted even though they no longer have value or may even detract from value. Sometimes there is a fundamental change in what buyers value, but companies that are focused on benchmarking one another do not act on, or even perceive, the change.
▪ The second question forces a company to determine whether products or services have been over-designed in the race to match and beat the com-petition. Here, companies over-serve customers, increasing their cost structure for no gain.
▪ The third question pushes a company to uncover and eliminate the com-promises an industry forces customers to make.
▪ The fourth question helps a company to discover entirely new sources of value for buyers and to create new demand and shift the strategic pricing of the industry.
When a company applies the four actions framework to the strategy can-vas of an industry, it gets a revealing new look at old perceived truths. In the case of the U.S. wine industry, by thinking in terms of these four actions vis-à-vis the current industry logic and looking across industry alternatives and non-customers, Casella Wines created [yellow tail], a wine whose strategic profile broke from the competition and created a blue ocean. Instead of offering wine as wine, Casella created a social drink accessible to everyone: beer drinkers, cocktail drinkers, and other drinkers of non-wine beverages. In the space of two years, the fun, social drink [yellow tail] emerged as the fastest growing brand in the histories of both the Australian and the U.S. wine industries and the number one imported wine into the United States, surpassing the wines of France and Italy. By August 2003 it was the number one red wine in a 750-ml bottle sold in the United States, outstripping California labels. By 2004, [yellow tail] sold more than 11.2 million cases to the United States alone. In the context of a global wine glut, [yellow tail] has been racing to keep up with sales.
FIGURE 3.
The Four Actions FrameworkWhich of the factors that the industry takes for granted should be
eliminated?
Eliminate
Which factors should be reduced
well below the
industry's standard?
Reduce
Which factors should be created that the industry has never offered?
Create
Raise
Which factors should be raised
well above the
industry's standard?
What’s more, whereas large wine companies developed strong brands over decades of marketing investment, [yellow tail] leapfrogged tall competitors with no promotional campaign, mass media, or consumer advertising. It didn’t simply steal sales from competitors; it grew the market, pulling in more than 6 million new customers. [yellow tail] brought non-wine drinkers—beer and ready-to-drink cocktail consumers—into the wine market. Moreover, novice table wine drinkers started to drink wine more frequently, jug wine drinkers moved up, and drinkers of more expensive wines moved down to become con-sumers of [yellow tail].
Figure 4 shows the extent to which the application of these four actions led to a break from the competition in the U.S. wine industry. Here we can graphically compare [yellow tail]’s blue ocean strategy with the more than one thousand six hundred wineries competing in the United States. As shown in Figure 4, [yellow tail]’s value curve stands apart. Casella Wines acted on all four actions—eliminate, reduce, raise, and create—to unlock uncontested mar-ket space that changed the face of the U.S. wine industry in a span of two years.
By looking at the alternatives of beer and ready-to-drink cocktails and thinking in terms of noncustomers, Casella Wines created three new factors in the U.S. wine industry—easy drinking, easy to select, and fun and adventure— and eliminated or reduced everything else. Casella Wines found that the mass of Americans rejected wine because its complicated taste was difficult to appreciate.
FIGURE 4.
The Strategy Canvas [yellow tail]High
Low
[yellow tail] Budget Wines
Premium Wines
Price
Use of Enological Terminology and Distinctions
in Wine Communication
Wine Complexity
Ease of Selection
Easy Drinking Aging
Quality
Vineyard Prestige and Legacy
Wine Range
Fun and Adventure Above-the-Line
Beer and ready-to-drink cocktails, for example, were much sweeter and easier to drink. Accordingly, [yellow tail] was a completely new combination of wine characteristics that produced an uncomplicated wine structure that was instantly appealing to the mass of alcohol drinkers. The wine was soft in taste and approachable like ready-to-drink cocktails and beer, and it had up-front, primary flavors. The smooth fruitiness of the wine also kept people’s palate fresher, allowing them to enjoy another glass of wine without thinking about it. The result was an easy-drinking wine that did not require years to develop an appreciation for.
In line with this simple fruity sweetness, [yellow tail] dramatically reduced or eliminated all the factors the wine industry had long competed on— tannins, oak, complexity, and aging—in crafting fine wine, whether it was for the premium or the budget segment. With the need for aging eliminated, the needed working capital for aging wine at Casella Wines was also reduced, creat-ing a faster payback for the wine produced. The wine industry criticized the sweet fruitiness of [yellow tail] wine, seeing it as significantly lowering the qual-ity of wine and working against proper appreciation of fine grapes and historic wine craftsmanship. These claims may have been true, but customers of all sorts loved the wine.
Wine retailers in the United States offered buyers aisles of wine varieties, but to the general consumer the choice was overwhelming and intimidating. The bottles looked the same, labels were complicated with enological terminol-ogy understandable only to the wine connoisseur or hobbyist, and the choice was so extensive that salesclerks at retail shops were at an equal disadvantage in understanding or recommending wine to bewildered potential buyers. More-over, the rows of wine choice fatigued and de-motivated customers, making selection a difficult process that left the average wine purchaser insecure with the choice.
[yellow tail] changed all that by creating ease of selection. It dramatically reduced the range of wines offered, creating only two: Chardonnay, the most popular white in the United States, and a red, Shiraz. It removed all technical jargon from the bottles and created instead a striking, simple, and nontraditional label featuring a kangaroo in bright, vibrant colors of orange and yellow on a black background. The wine boxes [yellow tail] came in were also of the same vibrant colors, with the name [yellow tail] printed boldly on the sides; the boxes served the dual purpose of acting as eye-catching, non-intimidating displays for the wine.
[yellow tail] hit a home run in ease of selection when it made retail shop employees the ambassadors of [yellow tail] by giving them Australian outback clothing, including bushman’s hats and oilskin jackets to wear at work. The retail employees were inspired by the branded clothing and having a wine they themselves did not feel intimidated by, and recommendations to buy [yellow tail] flew out of their mouths. In short, it was fun to recommend [yellow tail].
The simplicity of offering only two wines at the start—a red and a
units maximized its stock turnover and minimized investment in warehouse inventory. In fact, this reduction of variety was carried over to the bottles inside the cases. [yellow tail] broke industry conventions. Casella Wines was the first company to put both red and white wine in the same-shaped bottle, a practice that created further simplicity in manufacturing and purchasing and resulted in stunningly simple wine displays.
The wine industry worldwide was proud to promote wine as a refined beverage with a long history and tradition. This is reflected in the target market for the United States: educated professionals in the upper income brackets (hence, the continuous focus on the quality and legacy of the vineyard, the chateau’s or estate’s historical tradition, and the wine medals won). Indeed the growth strategies of the major players in the U.S. wine industry were targeted at the premium end of the market, with tens of millions invested in brand advertis-ing to strengthen this image. By lookadvertis-ing to beer and ready-to-drink cocktail customers, however, [yellow tail] found that this elite image did not resonate with the general public, which found it intimidating. So [yellow tail] broke with tradition and created a personality that embodied the characteristics of the Aus-tralian culture: bold, laid back, fun, and adventurous. Approachability was the mantra: “The essence of a great land…Australia.” There was no traditional win-ery image. The lowercase spelling of the name [yellow tail], coupled with the vibrant colors and the kangaroo motif, echoed Australia. Indeed, no reference to the vineyard was made on the bottle. The wine promised to jump from the glass like an Aussie kangaroo.
The result is that [yellow tail] appealed to a broad cross section of alcohol beverage consumers. By offering this leap in value, [yellow tail] raised the price of its wines above the budget market, pricing them at $6.99 a bottle, more than double the price of a jug wine. From the moment the wine hit the retail shelves in July 2001, sales took off.
The Eliminate-Reduce-Raise-Create Grid
There is a third tool that is key to creation of blue oceans. It is a supple-mentary analytic to the four actions framework called the
eliminate-reduce-raise-create grid (see Figure 5). The grid pushes companies not only to ask all four
questions in the four actions framework but also to act on all four to create a new value curve. By driving companies to fill in the grid with the actions of eliminating and reducing as well as raising and creating, the grid gives compa-nies four immediate benefits:
▪ It pushes them to simultaneously pursue differentiation and low costs to break the value/cost trade-off.
▪ It immediately flags companies that are focused only on raising and creat-ing and thereby liftcreat-ing their cost structure and often over-engineercreat-ing products and services—a common plight in many companies.
▪ Because completing the grid is a challenging task, it drives companies to robustly scrutinize every factor the industry competes on, making them discover the range of implicit assumptions they make unconsciously in competing.
Three Characteristics of a Good Strategy
As a result of its strategic moves, [yellow tail] created a unique and exceptional value curve to unlock a blue ocean. As shown in the strategy can-vas, [yellow tail]’s value curve has focus; the company does not diffuse its efforts across all key factors of competition. The shape of its value curve diverges from the other players’, a result of not benchmarking competitors but instead looking across alternatives. The tagline of [yellow tail]’s strategic profile is clear: a fun and simple wine to be enjoyed every day.
When expressed through a value curve, then, an effective blue ocean strategy like [yellow tail]’s has three complementary qualities: focus, divergence, and a compelling tagline. Without these qualities, a company’s strategy will likely be muddled, undifferentiated, hard to communicate, and will have a high cost structure. The four actions of creating a new value curve should be well guided toward building a company’s strategic profile with these characteristics. These three characteristics serve as an initial litmus test of the commercial viabil-ity of blue ocean ideas. These three criteria guide companies in carrying out the process of reconstruction to arrive at a breakthrough in value both for buyers and for themselves.
FIGURE 5.
Eliminate-Reduce-Raise-Create Grid for the Case of [yellow tail]Eliminate
• Enological Terminology and Distinctions
• Aging Quality
• Above-the-line Marketing
Raise
• Price versus Budget Wines
• Retail Store Involvement
Reduce
• Wine Complexity
• Wine Range
• Vineyard Prestige
Create
• Easy Drinking
• Ease of Selection
Reading the Value Curves
The strategy canvas enables companies to see the future in the present. To achieve this, companies must understand how to read value curves. Embedded in the value curves of an industry is a wealth of strategic knowledge on the cur-rent status and future of a business.
A Blue Ocean Strategy
The first question the value curves answer is whether a business deserves to be a winner. When a company’s value curve, or its competitors’, meets the three criteria that define a good blue ocean strategy—focus, divergence, and a compelling tagline that speaks to the market—the company is on the right track. These three criteria serve as an initial litmus test of the commercial viability of blue ocean ideas.
On the other hand, when a company’s value curve lacks focus, its cost structure will tend to be high and its business model complex in implementation and execution. When it lacks divergence, a company’s strategy is a “me-too,” with no reason to stand apart in the marketplace. When it lacks a compelling tagline that speaks to buyers, it is likely to be internally driven or a classic exam-ple of innovation for innovation’s sake with no great commercial potential and no natural take-off capability.
A Company Caught in the Red Ocean
When a company’s value curve converges with its competitors, it signals that a company is likely caught within the red ocean of bloody competition. A company’s explicit or implicit strategy tends to be trying to outdo its competition on the basis of cost or quality.
Over-Delivery Without Payback
When a company’s value curve on the strategy canvas is shown to deliver high levels across all factors, the question is: Does the company’s market share and profitability reflect their investments? If not, the strategy canvas signals that the company may be oversupplying its customers, offering too much of those elements that add incremental value to buyers. The company must decide which factors to eliminate, reduce, raise, and create to construct a divergent value curve.
An Incoherent Strategy
Strategic Contradictions
Strategic contradictions are areas where a company is offering a high level on one competing factor while ignoring others that support that factor. An example is investing heavily in making a company’s web site easy to use but failing to correct the site’s slow speed of operation. Strategic inconsistencies can also be found between the level of offering and price. For example, a petroleum station company found that it offered “less for more”: fewer services than the best competitor at a higher price. No wonder it was losing market share fast.
An Internally Driven Company
In drawing the strategy canvas, how does a company label the industry’s competing factors? For example, does it use the word megahertz instead of speed, or thermal water temperature instead of hot water? Are the competing factors stated in terms buyers can understand and value, or are they in operational jargon? The kind of language used in the strategy canvas gives insight as to whether a company’s strategic vision is built on an “outside-in” perspective, driven by the demand side, or an “inside-out” perspective that is operationally driven. Analyz-ing the language of the strategy canvas helps a company understand how far it is from creating industry demand.
Conclusion
The frameworks and tools introduced here are essential analytics that can be applied to allow companies to break from the competition and open up blue oceans of uncontested market space. The market universe has never been con-stant; rather, blue oceans have continuously been created over time. To focus on the red ocean is therefore to accept the key constraining factors of competition— limited market space and the need to beat the enemy in order to succeed—and to deny the distinctive strength of the business world: the capacity to create new market space that is uncontested.
Notes
1. For a classic on military strategy and its fundamental focus on competition over a limited territory, see C. von Clausewitz, On War, translated by M. Howard and P. Paret (New York, NY: Knopf, 1993)
2. The structuralist school of IO economics finds its origin in Joe S. Bain’s structure-conduct-performance paradigm. Using a cross-industry empirical framework, Bain focuses mainly on the impact of structure on performance. For more discussions on this, see J.S. Bain, Barriers
to New Competition: Their Character and Consequences in Manufacturing Industries (Cambridge,
MA: Harvard University Press, 1956); J.S. Bain, ed., Industrial Organization (New York, NY: Wiley, 1959).
3. F.M. Scherer builds on Bain’s work and seeks to spell out the causal path between “struc-ture” and “performance” by using “conduct” as an intervening variable. For more, see F.M. Scherer, Industrial Market Structure and Economic Performance (Chicago, IL: Rand McNally, 1970).
4. Michael Porter has made the greatest and most profound contribution to the field of strategy in classic works such as Competitive Strategy and Competitive Advantage. See M.E. Porter,
York, NY: Free Press, 1985); M.E. Porter “What Is Strategy?” Harvard Business Review, 74/6 (November/December 1996): 61-78.
5. For discussions on how market boundaries are defined and how competitive rules of the game are set, see H.C. White, “Where Do Markets Come From?” American Journal of
Sociol-ogy, 87 (1981): 517–547; J. Porac and J.A. Rosa, “Rivalry, Industry Models, and the
Cogni-tive Embeddedness of the Comparable Firm,” Advances in Strategic Management, 13 (1996): 363–388.
6. Ever since the groundbreaking work of Michael Porter, competition has occupied the center of strategic thinking. See also P. Auerbach, Competition: The Economics of Industrial Change (Cambridge: Basil Blackwell, 1988); G.S. Day and D.J. Reibstein, with R. Gunther, eds.,
Wharton on Dynamic Competitive Strategy (New York, NY: John Wiley, 1997).
7. For more on globalization and its economic implications, see K. Ohmae, The Borderless World:
Power and Strategy in the Interlinked Economy (New York, NY: Harper Business, 1990); K.
Ohmae, End of the Nation State: The Rise of Regional Economies (New York, NY: HarperCollins, 1995).
8. See The Population and Vital Statistics Report (New York, NY: United Nations Statistics Division, 2002).
9. See, for example, Copernicus and Market Facts, The Commoditization of Brands and its
Implica-tions for Marketers (Auburndale, MA: Copernicus Marketing Consulting, 2001).
10. Ibid.
11. Although in different contexts, venturing into the new has been observed to be a risky enterprise. Steven P. Schnaars, for example, observes that market pioneers occupy a disad-vantaged position vis-à-vis their imitators. Chris Zook argues that diversification away from a company’s core business is risky and has low odds of success. See S.P. Schnaars, Managing
Imitation Strategies: How Later Entrants Seize Markets from Pioneers (New York, NY: Free Press,
1994); C. Zook, Beyond the Core: Expand Your Market Without Abandoning Your Roots (Boston, MA: Harvard Business School Press, 2004).
12. For example, Inga S. Baird and Howard Thomas argue that any strategic decisions involve risk taking. See I.S. Baird and H. Thomas, “What Is Risk Anyway? Using and Measuring Risk in Strategic Management,” in R.A. Bettis and H. Thomas, eds., Risk, Strategy, and Management (Greenwich, CT: JAI Press, 1990).
13. For detailed discussions on competitive strategy and the differentiation/low cost tradeoff, see Porter (1980, 1985, 1996), op. cit.
14. See C. Kim and R. Mauborgne, “Value Innovation: The Strategic Logic of High Growth,”
Harvard Business Review, 75/1 (January/February 1997): 102–112; C. Kim and R. Mauborgne,
“Creating New Market Space,” Harvard Business Review, 77/1 (January/February 1999): 83–93; C. Kim and R. Mauborgne, “Strategy, Value Innovation, and the Knowledge Econ-omy,” Sloan Management Review, 40/3 (1999): 41-54; C. Kim and R. Mauborgne, “A Recon-structionist View of Strategy,” in Blue Ocean Strategy: How to Create Uncontested Market Space
and Make the Competition Irrelevant (Cambridge, MA: Harvard Business School Press, 2005),
Appendix B.
15. For discussions on what strategy is and is not, see Porter (1996), op. cit. He argues that strategy should embrace the entire system of activities a firm performs. Operational improvements, on the other hand, can occur at the subsystem level.
16. Alternatives go beyond substitutes. A restaurant, for example, is an alternative to the cin-ema. It competes for potential buyers who want to enjoy a night out, even though it is neither a direct competitor nor a substitute for the cinema in its functional offering. There are six types of alternatives that companies can look across to create uncontested market space: alternative industries, strategic groups, buyer groups, complementary products and service offerings, functional/emotional orientation, and reference points in time. For more detailed discussions on alternatives and noncustomers, see C. Kim and R. Mauborgne, Blue
Ocean Strategy: How to Create Uncontested Market Space and Make the Competition Irrelevant


![FIGURE 5. Eliminate-Reduce-Raise-Create Grid for the Case of [yellow tail]](https://thumb-us.123doks.com/thumbv2/123dok_es/6652526.241881/15.918.175.737.139.510/figure-eliminate-reduce-raise-create-grid-case-yellow.webp)
