Universidad Nacional de La Plata
Sextas Jornadas de Economía
Monetaria e Internacional
La Plata, 10 y 11 de mayo de 2001
Creditor Protection and Financial Cycles
Arturo Galindo Alejandro Micco1
Research Department Inter-American Development Bank
First Draft:April 3,2001
Abstract
We develop a model in which the elasticity of credit to exogenous shocks depends on creditor rights regulations. We show that an increase in creditor protection reduces the elasticity of credit supply to exogenous shocks, and hence the amplitude of the credit cycle. Using an extended set of a measure of creditor rights protection in the spirit of La Porta et al. (1998), we find that stricter creditor rights regulations not only increase the breadth of the credit market but also reduce the volatility of the credit cycle.
1
1. Introduction
The implications of laws and regulations that protect creditors for the efficiency of financial markets have been amply debated in the literature. On one hand, several authors have argued that protecting creditors has important benefits since it allows credit markets to provide funds at a low cost. Outside investors are willing to pay more for financial assets -as equity and debt- when creditor’ rights are protected by law. Legal protection assures that more of firms’ profits would come back to investors as interest or dividends. Creditor rights protection leads to a large credit market and low interest margins.2
On the other hand, as noted by Padilla and Requejo (2000), other authors suggest that strict creditor protection can reduce risk-taking incentives, work against entrepreneurship, reduce credit demand, generate efficiency costs and may produce an effect opposite to what is intended.3 In addition, some pro creditor rights regulations can act as a barrier for entry into new industries and inhibit new growth opportunities.4
Recent papers by La Porta, Lopez-de-Silanes, Shleifer and Vishny (1997 and 1998), subsequently referred to as LLSV, have given new impetus to the discussion of the importance of regulations regarding creditor rights over collateral for the development of financial markets, by providing very valuable data on the state of creditor rights regulations around the world. Based on this data conflicting views on the impact of creditor rights on credit markets have been tested. Unlike theoretical arguments, empirical evidence tends to be inclined towards the first view described above.
LLSV find that, controlling for macro features, creditor rights and law enforceability have a strong positive effect on the size the of credit markets. However, when including additional macroeconomic controls, Padilla and Requejo (2000) conclude that creditor rights protection loses its explanatory power, casting doubts on the LLSV results.
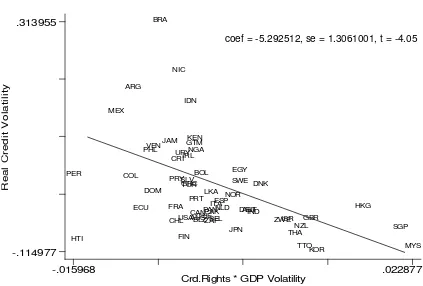
Although the benefit of creditor rights protection and law enforceability for financial development has been well documented, the effect of these variables on the credit cycle and volatility has received less attention. Figure 1 presents the
2
relationship between effective creditor rights and credit volatility across countries after controlling for GDP volatility. The former variable is the product of the LLSV creditor rights index and the Kaufmann et al. (1999) law enforceability measure, and credit volatility is measured as the standard deviation of the real credit growth rate during the nineties (idem for GDP).
Figure 1: Credit Volatility and Creditor Rights (Controlling by GDP Volatility)
Countries with lower effective creditor right seem to have lower credit volatility after controlling for GDP volatility. Figure 1 suggests that the effect of shocks (proxied by changes in GDP) on real credit is amplified by low creditor rights.5 In terms of this sample, an improvement in effective creditor rights from the 19th –Brazil- to the 80th percentile –Norway- reduces credit volatility in almost 50 percent (from 9.2 to 4.8 %).
There is a long tradition in macroeconomics, beginning with Fisher and Keynes, which emphasizes the role of credit markets in the propagation of cyclical fluctuations. In recent years, adverse credit-market conditions have been cited as
5
In Section 3 we deal with the potential inverse causality in this relation.
coef = -5.292512, se = 1.3061001, t = -4.05
R e a l C re d it V o la ti li ty
Crd.Rights * GDP Volatility
sources and propagation mechanisms of recessions (Japan, Latin America, U.S.).6 Kiyotaki and Moore (1997) study, from a theoretical point of view, how credit constraints interact with aggregate economic activity over the business cycle. Using a dynamic setup in which lenders cannot force borrowers to repay unless their debts are secured, these authors find that the interaction between credit limits (collateral) and asset prices turns out to be an important transmission and amplifier mechanism for exogenous shocks to credit and output. Using this setup, we can think that effective creditor rights decrease credits limits –collateral becomes more valuable-and therefore reduces the amplitude of the cycle for a given exogenous shock.7
Using a different approach, Bernake, Gertler and Gilchrist (1998) develop a dynamic general equilibrium model, which exhibits a “Financial Accelerator.” In their setup entrepreneurs are financially constrained and have to borrow from a financial intermediary. To motivate a nontrivial role for financial structure, they assume a “costly state verification.” This auditing cost, which is proportional to the debt, is paid only in case of default and therefore is interpretable as a bankruptcy cost. Using this setup, the paper finds that bankruptcy costs amplify the effect of exogenous shocks on both investment (which is related to credit) and output. In this model, an improvement of creditor rights can be thought of as a reduction in bankruptcy costs.
In a recent empirical paper, Johnson, Boone, Breach and Friedman (1999) present evidence that the weakness of legal institutions plays an important role in explaining the extent of depreciation and stock market decline in the “Asian Crisis” (1997-1998). Even though their work mainly focuses on minority shareholders’ expropriation by managers and not on private credit, this study suggests that corporate governance mattered a great deal for the extent of macro variables’ fluctuation during the crises.
Extending the LLSV country coverage to 15 developing countries, we replicate their work as well as the Padilla and Requejo exercise. We find strong evidence regarding the positive effect of creditor rights protection on the size of the credit market, even when controlling for all macroeconomic variables used by Padilla and Requejo. Additionally, we explore from an empirical and theoretical perspective the relationship between creditor rights regulations and the credit cycle. Using a costly state verification type of model, we find that an improvement in effective creditor rights reduces credit cycles. Our model features behavior is broadly consistent with the credit cycles observed around the world during the nineties.
6
See for example Bernanke and Lown (1991).
7
The rest of the paper is organized as follows. Section 2 discusses our basic model, which captures the links between creditor rights, credit market breadth and the credit cycle. Section 3 describes the data set used to test the implications of our basic model. Sections 4 and 5 present empirical evidence about the role of creditor rights regulation in explaining both credit market breadth and the amplitude of the credit cycle. Section 6 concludes.
2. The Basic Model
Consider a model in which firms seek to finance investment projects of a size normalized to one. Firms’ projects can either succeed with probability π, in which case the project yields Yi in the second period T2, or fail with probability (1-π), in
which case the project yields 0. In either case (failure or success), the entrepreneur enjoys a private benefit from running the firm (b>0). All projects are the same except in the benefit they yield in the case of success (Yi). In this set up a higher Yi means a higher quality of the project. This quality is observable by the bank. The cumulative distribution of firms in term of their quality is F(.).
After the project’s type is revealed (failure or success), but before the investment yields its outcome in period T2, the project can be stopped with a
liquidation value of α (>>b).8 This assumption implies that all bad projects should be liquidated, but the private benefit induces entrepreneurs to try to keep the firm running even when the project would yield nothing in period T2. This model could be thought of as one with short-term debt rollover. Banks lend I=1 in period To. If the project fails it does not roll over the debt and liquidates the firm –note that the entrepreneur does not have the incentives to liquidate by himself (b>0)-. In case of success the bank rolls over the debt.
Banks are competitive and face an infinitely elastic supply of deposits. The riskless interest rate is normalized to zero. In equilibrium, each bank asks a payment Di that could be collected in period T2 only if the project ends up being a good one.
If the project fails the bank liquidates its loan and receives α θ in period T1. The
bankruptcy cost parameter θ represents the fraction of the liquidation value that the bank effectively receives when it decides to liquidate a project. Therefore a lower θ means a higher bankruptcy cost.
8α
must be lower than one because of fire sale and asset specificity. See Shleifer and Vishny (1992). Nature Reveals Type
(success or failure)
To T1 T2
Perfect competition between banks implies that equation 1 will determine the equilibrium payment for a project type Yi.
1 ) 1 (
Di + −π αθ =
π [1]
This result implies that the gross interest rate (Ri) and the intermediation margin (ri) for the project i are:
π αθ π) 1 ( 1 D
Ri ≡ i = − − [2]
) 1 ( 1 1 D
ri i αθ
ππ − − = −
≡ [2´]
Both the margin and the gross interest rate decrease with the probability of success and the fraction of initial investment that the bank can get in case of bankruptcy (α θ). It is important to note that all financed projects have the same interest rate (Ri=R) and the same intermediation margin (ri=r).
The fraction of projects financed in this economy is given by one minus the cumulative distribution evaluated at the first project that a competitive bank would like to finance (Y*). For this marginal project Di is equal to Yi.
From equation 1 we estimate Y* and therefore we determine the aggregate level of credit (which equals to investment) in this economy:
( )
*1 F Y
C = − [3]
where
π αθ π) 1 ( 1 *= − −
Y [4]
From equations [2] and [3] it is easy to see that the lower the bankruptcy cost the higher the equilibrium amount of credit and the lower the gross interest rate.
*) ( * 1 1 *) ( 1 1 Y HR Y Y HR C αθ παθ π παθ ξ − + = −
= [5]9
where rate hazard the Y F Y f Y HR : *) ( 1 *) ( *) ( − ≡
During recessions credit falls because the generalized lower probability of success (π) reduces the number of projects that have an expected return higher than the riskless interest rate.
+ − − − = * *) ( 1 ) 1 ( *) ( dY Y dHR Y HR d d C π π αθ π α θ
ξ π [6]
For distributions with a non-extreme decreasing hazard rate, for example the exponential (Weibull with p>1), uniform,10 and log-normal,11 the fall in credit after a decrease in the probability of success is larger the higher the bankruptcy cost (lower
θ). The intuition behind this result is that the difference in banks’ payoffs between success and failure is bigger for countries with low creditor rights (low θ).
This last result suggests that countries with inefficient bankruptcy procedures should have a higher volatility in the amount of credit over the cycle. Focusing on the gross interest rate, we find that its elasticity with respect to the probability of success is: αθ παθ ξ π − + − = 1 1 1 R [7]
During recessions the gross interest rate increases because projects become more risky (the probability of failure is higher). This increase in the interest rate is smaller the lower the bankruptcy cost (large θ). This result suggests that countries
9
Depending on the distribution we use, one or the other specification makes results clearer.
10
For the case of Exponential (and Weibull p>1) and Uniform distribution we know that the hazard rate is not decreasing, therefore using the first specification we can see immediately that equation [6] is negative. The Hazard rate for an Exponential distribution is constant and therefore
*) (Y HR d d C π α θ ξπ =−
. For a Uniform distribution (between 0 and Yu) we have ( ) 1 1 ) 1 /( ) ( − − − − =π αθ αθ
ξCπ Yu ,
which is clearly decreasing with θ (note: Yu>1).
11
Using the second specification for Equation [5], we can rewrite equation [6] as:
+ − − − − − − − = * *)) ( * ( ) 1 ( ) 1 ( ) 1 ( 1 *) ( * ) 1 ( 1 2 dY Y HR Y d Y HR Y d d C π π αθ π αθ π αθ απ θ ξπ
with inefficient bankruptcy procedures should also have a higher volatility in the interest rate.
3. Data
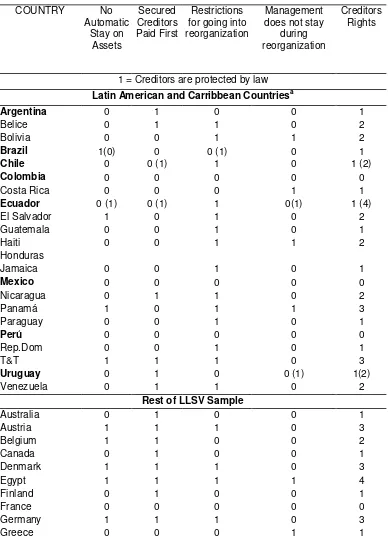
The LLSV study collects information for 48 countries on regulations regarding creditor rights. Their sample includes roughly as many developed as developing countries; given that developed countries account for less than 10% of the world, this can induce some bias in the further analysis. LLSV construct an index that summarizes regulations determining creditor rights to control collateral in case firms file for bankruptcy or reorganization. They study whether regulations impose an automatic stay on assets in case of reorganization, whether they grant secured creditors the right to be paid first in case of bankruptcy, whether they force firms to consult with creditors before filling for reorganization, and whether they force a removal of the firm’s management during reorganization. In short, these regulations provide an adequate picture of how regulation protects creditors.
By examining country codes and regulations on bankruptcy procedures and reorganizations and following LLSV, we update their sample to include the whole Latin American region and part of the Caribbean. Our index, in the spirit of LLSV, is reported in Table A1 in Appendix 1. In the table, LLSV’s measures are also reported. Except for Ecuador, which measures 1 in our index and 4 in LLSV, there are no major differences in the countries where overlaps occur.
4. Creditor Rights and Credit Market Breadth: Additional Evidence
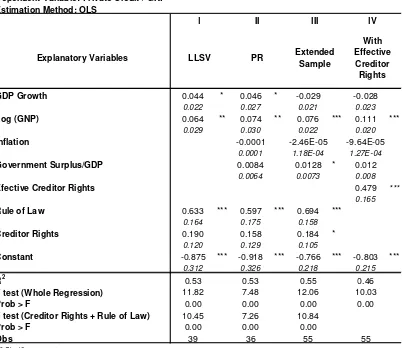
The model in Section 2, as well as the cited work by LLSV, suggest that credit market depth depends on the stance of the legal environment surrounding the credit market. In particular, LLSV show that once corrected for the size of the economy and previous growth, both their creditor rights measure and the rule of law index come in significant in an OLS regression having the ratio of private debt to GNP as the dependent variable. Padilla and Requejo (subsequently referred to as PR) extend the LLSV empirical analysis to include additional macro controls such as inflation and the ratio of government surplus to GDP. They find that once controlled for these the significance of the creditor rights variable vanishes, but the rule of law variable remains significant.
which is the interaction of the rule of law variable and the creditor rights index.12 This variable captures the effect of law enforcement on creditor regulation. Countries with high creditor rights can lose their benefits if rules and regulations are not enforced. Table A2 in Appendix 1 reports our measurement of effective creditor rights.
Table 1 presents our cross-country results. Columns I and II report regressions similar to LLSV and PR, in the sense that we use their exact data and specification.13 As in LLSV and PR, the creditor rights index in itself comes in significantly at a marginal level, but does not come in significant when including additional controls. An F test, however, rejects that both credit rights and rule of law are jointly insignificant. In columns III and IV we present regressions similar to the previous ones, but including a larger sample. We update the LLSV and PR data sets to include information on all Latin American and Caribbean countries for which we updated the LLSV index, and we complete some missing data of the previous data sets. In short,we extend the sample to include 58 countries. The only important difference regarding additional data is that we use the Kaufmann et al. (1999) rule of law index, which has a wider variety of countries.14 Unlike the PR study, in the expanded sample we find that creditor rights are a significant determinant of credit market breadth. The effective creditor rights index appears highly significant, but now the creditor rights variable in itself appears significant also. Coefficients, however, remain relatively constant across specifications, suggesting that the new data allows a more precise estimation of the model’s standard errors.15
Summarizing, this section has shown more robust evidence that confirms results that were previously questioned in the creditor rights empirical literature. Countries with higher creditor protection and with higher law enforcement tend to have deeper credit markets than those where credit protection is low.
12
Effective creditor rights = rule of law * creditor rights. Both rule of law and creditor rights have been normalized to the 0-1 interval, which implies that effective creditor rights protection also ranges between 0 and 1. Higher values indicate greater protection of creditors.
13
LLSV regress the ratio of debt to GNP in 1994, on the log of current GNP to capture scale effects, average growth rates of the previous 25 years to capture the fact that financial sectors grow more in more dynamic economies, rule of law, and the creditor rights index. PR extend the set of regressors to include inflation and government surplus as measures of policy performance. The coefficients on the rule of law index and the creditor rights index differ to theirs because we have normalized them to the 0-1 interval, so that our effective creditor rights index can be interpreted in the same interval.
14
Again we have normalized it to the 0-1 interval.
15
5. Creditor Rights and the Credit Cycle: Empirical Evidence
Equation 6 suggests that the credit cycle is smoother in countries with higher creditor rights than in those with low protection. To test for the validity of this proposition, we construct a panel in which we gather information for the 1990-1999 period for the 59 countries of our sample. Our panel is unbalanced due to lack of information on several years for some countries, and it is confined to the 1990s in order to avoid the impact of possible changes in regulation which we can not capture due to the fact that the creditor rights data is collected in only one moment in time.
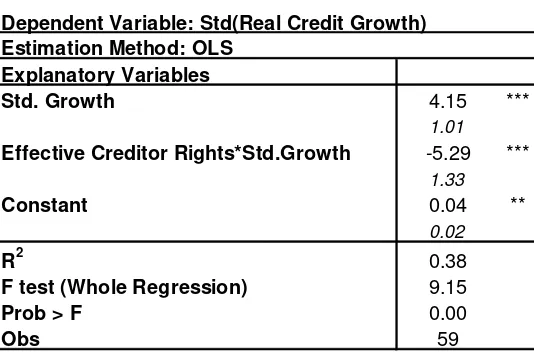
To describe some stylizedfacts, we study the relationship between real credit volatility and output shocks, which we initially assume equal to GDP volatility. The model presented in Section 4 suggests that the elasticity of credit growth with respect to shocks is a function of creditor protection, therefore for a given level of output volatility countries with lower effective creditor rights should have higher credit volatility. To test this hypothesis we estimate the following regression:
i i i
i
i GDPVol CredRigths GDPVol
CreditVol =α +β +δ . * +ε
where CredRights represents the effective creditor rights, and CreditVol and GDPVol are the cross time standard deviation of the de-trended rate of growth of real credit and GDP, respectively.16 Table 2 presents the estimated coefficient for the 59 countries in our sample.
As expected, higher variance in real credit is associated with countries with more volatile output. The GDP volatility coefficient is positive and significant at 1%. As predicted by theory, the coefficient of the interaction on the volatility of output and effective creditor protection is negative and also significant at 1%. In terms of this sample and for the median country in terms of output volatility, an increase in effective creditor rights from the 19th (Brazil) to 80th percentile (Norway) implies a 50% reduction in real credit volatility.
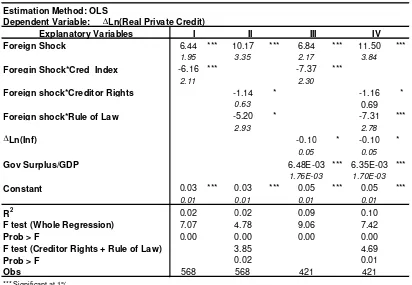
To see if these results hold at the yearly base, we study the effect of shocks on the real credit rate of growth using year-country data. We proxy the yearly change in the state of the economy (shocks) in two different ways. First, we construct a measure of exogenous shocks, which is basically the weighted average of the real growth rates of the countries’ trading partners.17 Second, we proxy it by GDP growth; however, since this is likely to be endogenous to credit cycles, we
16
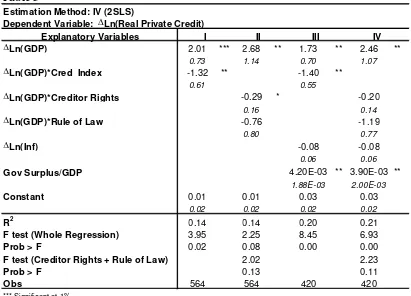
instrument it with our foreign shocks measure and year dummies, which capture a contagion effect. In order to capture the changing nature of the coefficient across different legal regimes we interact the state of the economy proxy variable with the creditor rights variable, as predicted by the model. In order to expand the model we also include additional controls such as the change in the rate of inflation and the government’s surplus in our specification.18 Tables 3 and 4 report our results using GDP growth and the foreign shock variable, respectively. Columns 1 and 2 show our findings using the effective aggregate index of creditor rights conditions. Column 2 includes the additional macro controls. Our results suggest that an increase in “effective” creditor rights reduces the amplitude of the real credit cycle.
Columns 3 and 4 reports similar results considering the creditor rights index and the rule of law index separately. Our results, even when controlling for macroeconomic conditions, remain unchanged. An increase in creditor protection reduces the impact of shocks over the credit market. An increase in creditor rights from the lowest level to the highest, can diminish the elasticity of credit growth to a shock by nearly 50%.
The IV estimation captures the impact of the exogenous component of GDP growth over credit expansion. In theory, if the instruments are set properly this must be the final result of the estimation. However, it is likely that some indirect effect of the shock, namely the effect of a change in credit demand as a response to GDP fluctuations, is not completely isolated. In order to eliminate such a source of uncertainty the regressions are run again, assuming that the shock operates directly and not through GDP. The results, as reported in Table 3, remain unchanged.
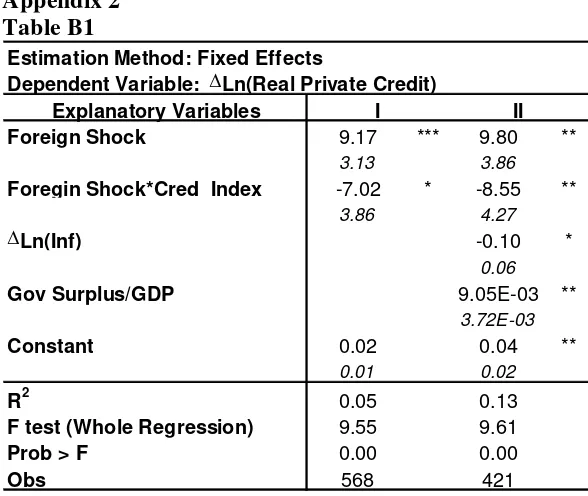
In order to corroborate the results above and to correct for country-specific institutional and macroeconomic factors that could have been ignored in previous specifications, Table B1 in Appendix 2 presents fixed effects regressions similar to those above. As shown, the results hold and their interpretation remains intact.
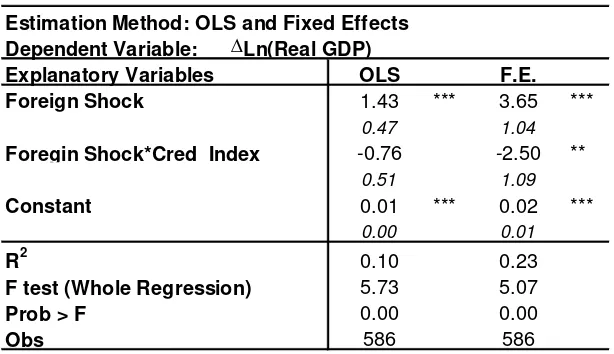
Finally Table 5 presents some evidence on the impact of creditor rights regulations on GDP. We use the panel described above to estimate the response of GDP growth to the external shock and to the shock interacted with the creditor rights index. Our results have the adequate sign, that is countries with lower creditor protection experience larger fluctuations after an external shock, but are significant only at the 15% significance level. This, however, can be a matter of specification, since at the end many different channels, which we are not capturing, interact in the process from shocks to GDP growth.
18
6. Non Parametric Evidence
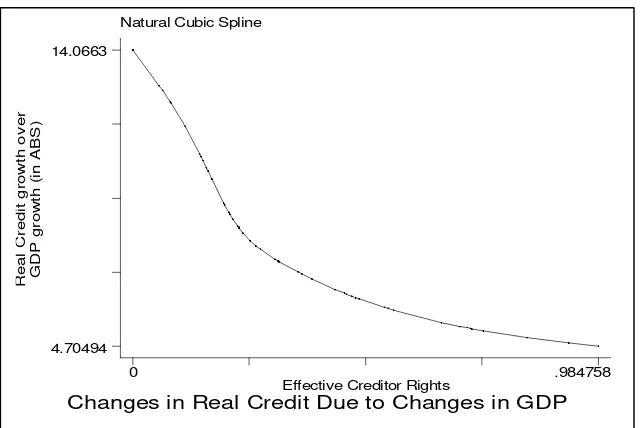
In order to test the robustness of our findings we explore an alternative empirical technique to assess the role of creditor protection in amplifying credit cycles. We fit a natural cubic spline based on the empirical model used in the previous section. In particular, we fit the spline in the effective creditor rights index to the absolute value of the ratio of de-trended credit growth to de-trended GDP growth. That is, as our dependent variable we use:
∆ − ∆ ∆ − ∆ ) log( ) log( ) log( ) log( i it i it GDP GDP Credit Credit ABS
[image:13.612.181.502.382.596.2]where credit and GDP are in real terms, and the bar over the variable reflects the sample average for each country. Country rates of growth are de-trended to reflect the cyclical component. To avoid instability around zero GDP growth rates we exclude observations within a 5% window around zero GDP growth, which leaves us with 536 observations.
Figure 2: Cubic Spline
Figure 2 shows our spline estimate. Clearly, and as predicted by theory, there is a negative relationship between creditor rights protection and the response of credit growth to economy-wide shocks captured in the de-trended GDP growth rate. The higher the degree of creditor protection, the lower the difference between
Natural Cubic Spline
R e a l C re d it g ro w th o v e r G D P g ro w th (i n A B S )
Changes in Real Credit Due to Changes in GDP Effective Creditor Rights
0 .984758
7. Conclusions
This paper extends the LLSV sample and includes creditor rights information for most of the Latin American and Caribbean countries. We find that once the sample of countries is balanced toward the true World share of developing countries, the LLSV results regarding the impact of creditor rights regulations on the size of credit markets, previously questioned by Padilla and Requejo, regain their statistical significance.
Additionally, we extend the previous analysis on the impact of regulation on the breadth of credit markets to analyze the impact on credit cycles and marginally on business cycles. We find that creditor rights play an important role, by exacerbating credit risk in countries where creditor rights are not protected, and hence induce an overreaction of credit markets to exogenous shocks. We present parametric panel data type evidence using various shock measures, and additionally non parametric spline regression to illustrate the findings of our theoretical model.
8. References
Angbazo, L. 1997."Commercial Bank Net Interest Margins, Default Risk, Interest Rate Risk and Off-Balance Sheet Banking".Journal of Banking and Finance. 21(1):55-87.
Bebchuk,L.A. and Fried,J.M. 1996 "The Uneasy Case for the Priority of Secured Claims in Bankruptcy". Yale Law Journal. 105(4):857-934.
Berkovitch,E., Ronen, I., Zender,J. "Optimal Bankruptcy Law and Firm-Specific Investments". European Economic Review (41)3-5: 487-497.
Bernanke,B. Gertler,M. and Gilchrist, S. 1998."The Financial Accelerator in a Quantitative Business Cycle Framework". National Bureau of Economic Research Working Paper: 6455
Bernanke,B. and Lown,C. 1991 "The Credit Crunch". Brookings Papers on Economic Activity .0(2): 204-39
Carr,J. and Mathiwson,G. 1988 ."Unlimited Liability as a Barrier to Entry". Journal of Political Economy. 96(4): 766-84
---. 1998. "Law and Finance." Journal of Political Economy. 106(6):1113-1155.
Kaufmann, D. Kraay, A. Zoido-Lobaton, P. 1999. "Aggregating Governance Indicators."World Bank Working Paper #2195.
Kiyotaki,N. and Moore, J. 1997. "Credit Cycles". Journal of Political Economy.v105 (2): 211-48.
La Porta, R. Lopez-de-Silanes,F. Shleifer, A, Vishny,R. 1997. "Legal Determinants of External Finance." Journal of Finance. 52(3):1131-1150.
Padilla, A. and Requejo,A. 2000. "The Costs and Benefits of the Strict Protection of Creditor Rights: Theory and Evidence." Inter-American Development Bank. Research Network Working Paper. R-384.
Shleifer,A. and Vishny,R. 1992. "Liquidation Values and Debt Capacity: A Market Equilibrium Approach". Journal of Finance 47(4): 1343-66
9. Tables Table 1
Dependent Variable: Private Credit / GNP Estimation Method: OLS
GDP Growth 0.044 * 0.046 * -0.029 -0.028
0.022 0.027 0.021 0.023
Log (GNP) 0.064 ** 0.074 ** 0.076 *** 0.111 ***
0.029 0.030 0.022 0.020
Inflation -0.0001 -2.46E-05 -9.64E-05
0.0001 1.18E-04 1.27E-04
Government Surplus/GDP 0.0084 0.0128 * 0.012
0.0064 0.0073 0.008
Efective Creditor Rights 0.479 ***
0.165
Rule of Law 0.633 *** 0.597 *** 0.694 ***
0.164 0.175 0.158
Creditor Rights 0.190 0.158 0.184 *
0.120 0.129 0.105
Constant -0.875 *** -0.918 *** -0.766 *** -0.803 ***
0.312 0.326 0.218 0.215
R2 0.53 0.53 0.55 0.46
F test (Whole Regression) 11.82 7.48 12.06 10.03
Prob > F 0.00 0.00 0.00 0.00
F test (Creditor Rights + Rule of Law) 10.45 7.26 10.84
Prob > F 0.00 0.00 0.00
Obs 39 36 55 55
*** Significant at 1%
** Significant at 5%
* Significant at 10%
III
Explanatory Variables
With Effective
Creditor Rights
IV
LLSV PR Extended
Sample
Table 2
Dependent Variable: Std(Real Credit Growth) Estimation Method: OLS
Explanatory Variables
Std. Growth 4.15 ***
1.01
Effective Creditor Rights*Std.Growth -5.29 ***
1.33
Constant 0.04 **
0.02
R2 0.38
F test (Whole Regression) 9.15
Prob > F 0.00
Obs 59
Table 3
Estimation Method: IV (2SLS)
Dependent Variable: ∆Ln(Real Private Credit)
Explanatory Variables I II III IV
∆Ln(GDP) 2.01 *** 2.68 ** 1.73 ** 2.46 **
0.73 1.14 0.70 1.07
∆Ln(GDP)*Cred_Index -1.32 ** -1.40 **
0.61 0.55
∆Ln(GDP)*Creditor Rights -0.29 * -0.20
0.16 0.14
∆Ln(GDP)*Rule of Law -0.76 -1.19
0.80 0.77
∆Ln(Inf) -0.08 -0.08
0.06 0.06
Gov Surplus/GDP 4.20E-03 ** 3.90E-03 **
1.88E-03 2.00E-03
Constant 0.01 0.01 0.03 0.03
0.02 0.02 0.02 0.02
R2 0.14 0.14 0.20 0.21
F test (Whole Regression) 3.95 2.25 8.45 6.93
Prob > F 0.02 0.08 0.00 0.00
F test (Creditor Rights + Rule of Law) 2.02 2.23
Prob > F 0.13 0.11
Obs 564 564 420 420
*** Significant at 1% ** Significant at 5%
Table 4
Estimation Method: OLS
Dependent Variable: ∆Ln(Real Private Credit)
Explanatory Variables I II III IV
Foreign Shock 6.44 *** 10.17 *** 6.84 *** 11.50 ***
1.95 3.35 2.17 3.84
Foregin Shock*Cred_Index -6.16 *** -7.37 ***
2.11 2.30
Foreign shock*Creditor Rights -1.14 * -1.16 *
0.63 0.69
Foreign shock*Rule of Law -5.20 * -7.31 ***
2.93 2.78
∆Ln(Inf) -0.10 * -0.10 *
0.05 0.05
Gov Surplus/GDP 6.48E-03 *** 6.35E-03 ***
1.76E-03 1.70E-03
Constant 0.03 *** 0.03 *** 0.05 *** 0.05 ***
0.01 0.01 0.01 0.01
R2 0.02 0.02 0.09 0.10
F test (Whole Regression) 7.07 4.78 9.06 7.42
Prob > F 0.00 0.00 0.00 0.00
F test (Creditor Rights + Rule of Law) 3.85 4.69
Prob > F 0.02 0.01
Obs 568 568 421 421
*** Significant at 1%
** Significant at 5%
Table 5
Estimation Method: OLS and Fixed Effects Dependent Variable: ∆Ln(Real GDP)
Explanatory Variables OLS F.E. Foreign Shock 1.43 *** 3.65 ***
0.47 1.04
Foregin Shock*Cred_Index -0.76 -2.50 **
0.51 1.09
Constant 0.01 *** 0.02 ***
0.00 0.01
R2 0.10 0.23
F test (Whole Regression) 5.73 5.07
Prob > F 0.00 0.00
Obs 586 586
Appendix 1
Table A1
Creditor Rights Index
COUNTRY No
Automatic Stay on
Assets
Secured Creditors Paid First
Restrictions for going into reorganization
Management does not stay
during reorganization
Creditors Rights
1 = Creditors are protected by law
Latin American and Carribbean Countriesa
Argentina 0 1 0 0 1
Belice 0 1 1 0 2
Bolivia 0 0 1 1 2
Brazil 1(0) 0 0 (1) 0 1
Chile 0 0 (1) 1 0 1 (2)
Colombia 0 0 0 0 0
Costa Rica 0 0 0 1 1
Ecuador 0 (1) 0 (1) 1 0(1) 1 (4)
El Salvador 1 0 1 0 2
Guatemala 0 0 1 0 1
Haiti 0 0 1 1 2
Honduras
Jamaica 0 0 1 0 1
Mexico 0 0 0 0 0
Nicaragua 0 1 1 0 2
Panamá 1 0 1 1 3
Paraguay 0 0 1 0 1
Perú 0 0 0 0 0
Rep.Dom 0 0 1 0 1
T&T 1 1 1 0 3
Uruguay 0 1 0 0 (1) 1(2)
Venezuela 0 1 1 0 2
Rest of LLSV Sample
Australia 0 1 0 0 1
Austria 1 1 1 0 3
Belgium 1 1 0 0 2
Canada 0 1 0 0 1
Denmark 1 1 1 0 3
Egypt 1 1 1 1 4
Finland 0 1 0 0 1
France 0 0 0 0 0
Hong Kong 1 1 1 1 4
India 1 1 1 1 4
Indonesia 1 1 1 1 4
Ireland 0 1 0 0 1
Israel 1 1 1 1 4
Italy 0 1 1 0 2
Japan 0 1 0 1 2
Kenya 1 1 1 1 4
Korea 1 1 0 1 3
Malaysia 1 1 1 1 4
Netherlands 0 1 1 0 2
New Zealand 1 0 1 1 3
Nigeria 1 1 1 1 4
Norway 0 1 1 0 2
Pakistan 1 1 1 1 4
Philippines 0 0 0 0 0
Portugal 0 1 0 0 1
Singapore 1 1 1 1 4
South Africa 0 1 1 1 3
Spain 1 1 0 0 2
Sri Lanka 1 0 1 1 3
Sweden 0 1 1 0 2
Switzerland 0 1 0 0 1
Thailand 1 1 0 1 3
Turkey 0 1 1 0 2
UK 1 1 1 1 4
USA 0 1 0 0 1
Zimbabwe 1 1 1 1 4
a
Source: Country codes and regulations. Bold names are those countries that also appear in LLSV.
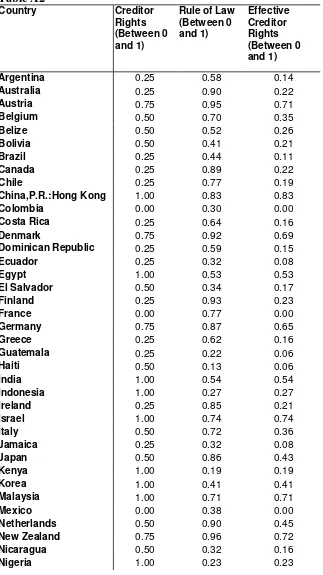
Table A2
Country Creditor
Rights (Between 0 and 1)
Rule of Law (Between 0 and 1)
Effective Creditor Rights (Between 0 and 1)
Argentina 0.25 0.58 0.14
Australia 0.25 0.90 0.22
Austria 0.75 0.95 0.71
Belgium 0.50 0.70 0.35
Belize 0.50 0.52 0.26
Bolivia 0.50 0.41 0.21
Brazil 0.25 0.44 0.11
Canada 0.25 0.89 0.22
Chile 0.25 0.77 0.19
China,P.R.:Hong Kong 1.00 0.83 0.83
Colombia 0.00 0.30 0.00
Costa Rica 0.25 0.64 0.16
Denmark 0.75 0.92 0.69
Dominican Republic 0.25 0.59 0.15
Ecuador 0.25 0.32 0.08
Egypt 1.00 0.53 0.53
El Salvador 0.50 0.34 0.17
Finland 0.25 0.93 0.23
France 0.00 0.77 0.00
Germany 0.75 0.87 0.65
Greece 0.25 0.62 0.16
Guatemala 0.25 0.22 0.06
Haiti 0.50 0.13 0.06
India 1.00 0.54 0.54
Indonesia 1.00 0.27 0.27
Ireland 0.25 0.85 0.21
Israel 1.00 0.74 0.74
Italy 0.50 0.72 0.36
Jamaica 0.25 0.32 0.08
Japan 0.50 0.86 0.43
Kenya 1.00 0.19 0.19
Korea 1.00 0.41 0.41
Malaysia 1.00 0.71 0.71
Mexico 0.00 0.38 0.00
Netherlands 0.50 0.90 0.45
New Zealand 0.75 0.96 0.72
Norway 0.50 0.96 0.48
Pakistan 1.00 0.31 0.31
Panama 0.75 0.40 0.30
Paraguay 0.25 0.33 0.08
Peru 0.00 0.37 0.00
Philippines 0.00 0.48 0.00
Portugal 0.25 0.77 0.19
Singapore 0.75 0.98 0.74
South Africa 0.75 0.74 0.55
Spain 0.50 0.76 0.38
Sri Lanka 0.75 0.41 0.31
Sweden 0.50 0.91 0.45
Switzerland 0.25 1.00 0.25
Taiwan 0.50 0.73 0.37
Thailand 0.75 0.60 0.45
Trinidad and Tobago 0.75 0.63 0.47
Turkey 0.50 0.50 0.25
United Kingdom 1.00 0.92 0.92
United States 0.25 0.81 0.20
Uruguay 0.25 0.57 0.14
Venezuela 0.50 0.33 0.17
Zimbabwe 1.00 0.46 0.46
Appendix 2 Table B1
Estimation Method: Fixed Effects
Dependent Variable: ∆Ln(Real Private Credit)
Explanatory Variables I II Foreign Shock 9.17 *** 9.80 **
3.13 3.86
Foregin Shock*Cred_Index -7.02 * -8.55 **
3.86 4.27
∆Ln(Inf) -0.10 *
0.06
Gov Surplus/GDP 9.05E-03 **
3.72E-03
Constant 0.02 0.04 **
0.01 0.02
R2 0.05 0.13
F test (Whole Regression) 9.55 9.61
Prob > F 0.00 0.00
Obs 568 421