C
C
|
E
E
|
D
D
|
L
L
|
A
A
|
S
S
Centro de Estudios
Distributivos, Laborales y Sociales
Maestría en Economía Universidad Nacional de La Plata
Ethnicity and the Millennium Development Goals in
Latin America and the Caribbean
Matías Busso, Martín Cicowiez y Leonardo Gasparini
ETHNICITY AND THE MILLENNIUM
DEVELOPMENT GOALS IN LATIN AMERICA AND
THE CARIBBEAN
*Executive Summary
Matías Busso Martín Cicowiez Leonardo Gasparini
Centro de Estudios Distributivos, Laborales y Sociales (CEDLAS) Universidad Nacional de La Plata
Keywords: ethnicity, race, MDG, poverty, education, Latin America, Caribbean
* Mariana Orloff co-authored Chapter 7. The authors are grateful to many researchers at UNDP, IDB and The
World Bank for useful suggestions and interactions, and particularly to Enrique Ganuza for his many valuable comments, and support throughout the process of writing the document. The authors would also like to thank Elisabeth Diaz for her support and inputs in the finalization of this study. The authors are very thankful to the research assistants at CEDLAS for their very able work, and their contributions to the study: Federico Gutiérrez, Leopoldo Tornarolli, Georgina Pizzolito, Paula Giovagnoli, Francisco Haimovich, Alejandro Támola, Joaquín Coleff, Hernán Winkler, Matías Horenstein, Evelyn Vezza, Rocío Crabajal, Gimena Ferreyra, María Victoria Fazio, Sergio Olivieri and Monserrat Bustelo.
Introduction
In September 2000, the world’s leaders adopted the UN Millennium Declaration, thereby committing all nations to exert stronger efforts to improve human welfare across the globe. This ambitious declaration defined a precise set of goals, known as the “Millennium Development Goals” (MDGs). Many international organizations in pursuit of progress towards completion of the MDGs are gathering data and making it comparable across countries. Most of the data produced in order to assess progress are, however, national averages; it is thus crucial to take into account that progress often differs widely across regions or groups in the same country. The emphasis in this study is placed on ethnicity. In particular, we analyze the situation of indigenous and afro-descendent groups vis-à-vis euro-descendent and mestizo groups using micro-data from household surveys from fifteen LAC countries. This paper mainly focuses on the analysis of the first three MDGs: (1) Halving extreme poverty and hunger; (2) Achieving universal primary education; and (3) Promoting gender equality.
Our sample includes fifteen LAC countries: Bolivia, Brazil, Chile, Colombia, Costa Rica, Ecuador, Guatemala, Haiti, Honduras, Mexico, Nicaragua, Panama, Paraguay, Peru, and Suriname. The sample represents almost 90% of the indigenous and afro-Latin population in LAC- making this paper, at least to the extent of our knowledge, the most representative analysis of poverty, educational outcomes and gender with respect to ethnicity for Latin American and Caribbean countries. We produce a large number of statistics by ethnicity that are included in this report, and can also be accessed and downloaded in a convenient format through www.depeco.econo.unlp.edu.ar/cedlas/ethnicity.
We have two main objectives. First, we explore the situation of indigenous and afro-descendent individuals in terms of poverty, educational achievement and gender equality. In particular, we investigate the “distance” of these groups to the national average in some of the MDGs, and their performance during the last decade toward those goals. Comparisons with other groups (e.g. euro-descendents and mestizos) of both the present situation and past
Chapter 1: Ethnicity in LAC
In this chapter we propose an operational definition that allows us to identify ethnic groups in LAC household surveys. According to some estimates, there are over 50 million indigenous peoples and over 120 million individuals of afro-descent in LAC, representing almost 33% of the total population in the region. Despite this relevance, many censuses and household surveys in LAC have not nearly identified ethnicity; only until very recently have some surveys included such types of questions.
We follow three general methods to identify ethnicity in household surveys. Depending on the country, we consider that a person is indigenous or of afro-descent if he or she: (i) identifies himself or herself as belonging to a certain ethnic group, (ii) identifies his or her native language or speaks an indigenous language, or (iii) lives in a territory that is mostly populated by persons from certain ethnic groups. We use self-perception as a method of identification in Bolivia, Brazil, Guatemala, Nicaragua, Panama, Peru, and Suriname. We use language as an identification criterion in the cases of Chile, Ecuador, Haiti, and Paraguay, and regions in Colombia, Costa Rica, Mexico and Honduras.
In chapter 1 of the study we present a description of important socio-economic characteristics (location, household type and labor market variables) among individuals of indigenous and afro-descent. We find that average non-white families in LAC countries live in rural areas and are slightly larger (usually having more children) than white families. Also, we show evidence that a typical indigenous or afro-descendent male has the same participation rate in the labor market and experiences lower rates of unemployment than his white counterpart. Additionally, he has a higher probability of working in the primary sector of the economy, is usually self-employed and works in a small firm. The average indigenous or afro-descendent female, on the other hand, tends to have lower participation and employment rates than her white counterpart.
Chapter 2: Poverty Reduction (MDG 1)
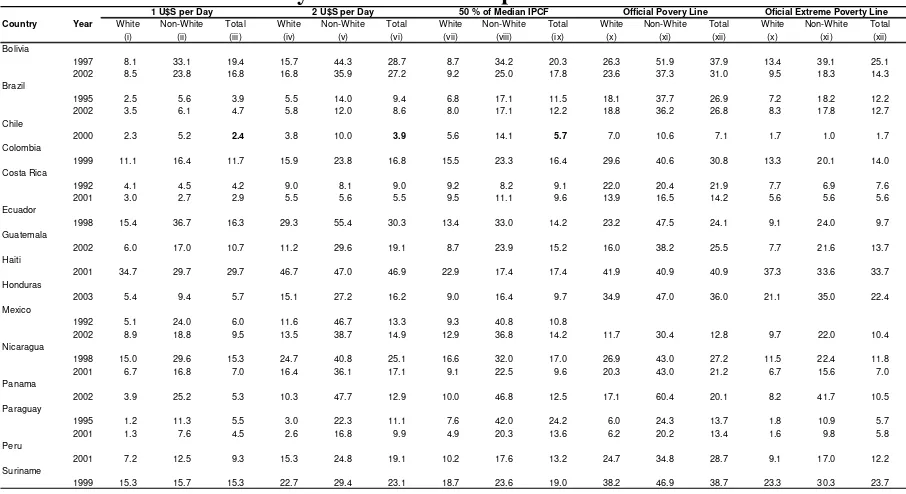
In almost every country and according to all poverty lines, non-white groups have higher poverty rates than white groups. For instance, the median ratio of non-white poverty to white poverty is 2.2 when using one dollar a day, and 1.8 when using two dollars a day.
Differences in other indicators of living conditions are also significant. In urban areas, non-whites have lower probabilities of access to safe water than do non-whites. Differences are more important regarding access to hygienic restrooms: on average, whites in urban LAC have 20% more access than do non-whites. In rural areas, these differences are smaller.
To provide preliminary evidence on potential ethnic discrimination, we estimate wage equations, where we regress the log of wage on a model that defines ethnicity and several control variables. The coefficient associated with ethnicity essentially tells us how much more an individual expects to earn if he or she is non-white, holding constant the other characteristics. We find that these estimated coefficients are in general negative, meaning that the expected wage is reduced because of being non-white. We find that lower coefficients (i.e.
more discrimination) are associated with higher poverty among non-whites.
Chapter 3: Improving Educational Outcomes (MDG 2)
In this chapter we first analyze educational outcomes from several perspectives, always highlighting the analysis of differences by ethnicity. We compute literacy rates, enrollment rates for different age groups, educational levels, and what is known as “school gaps”. We come to two important conclusions. First, we find that for children of primary school age, differences by ethnicity in all of these outcomes are not quantitatively important. That being said, however, it is also true that in some countries, differences do exist and should be addressed. Second, we find that differences by ethnicity in educational outcomes do exist for individuals of secondary school and college age.
Literacy rates are always higher for whites, for both the 10-65 and 15-24 age groups. Comparing estimates for the 10-65 and 15-24 age groups shows that differences between ethnic groups are narrower in the last case. In countries where we have information that has been collected for two years, we see that literacy rates for non-whites have been converging to those of whites. For instance, the literacy rates for whites and indigenous people aged 15-24 in Mexico were 97% and 80% in 1992, and 98% and 93% in 2002, respectively.
In contrast, differences in secondary school attendance between whites and non-whites are considerably high in some cases. In nine out of thirteen countries, the enrollment rates for non-whites is more that 10 percentage points lower than for whites. Also, differences by ethnicity in the enrollment rates for tertiary education are strikingly high in some countries, including Panama, Mexico, and Honduras.
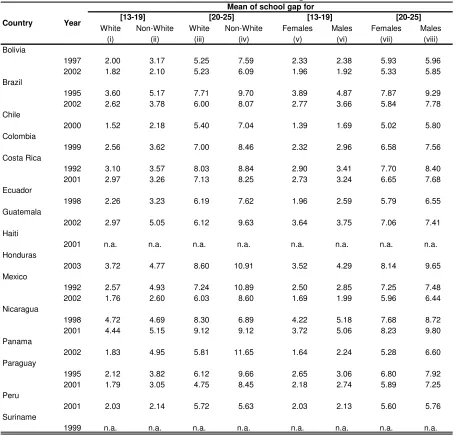
The schooling gap measures the number of years of missed education. The school gap of non-whites for the 13-19 age group varies across countries, from 2.1 in Bolivia to 5.2 in Nicaragua. The school gap is higher for non-whites than for whites in all countries for the 13-19 age group and in eleven out of thirteen for the 20-25 age group. This means, for example, that a young indigenous Guatemalan is missing, on average, 5.1 years education, while his white counterpart has missed only 2.9 years of education.
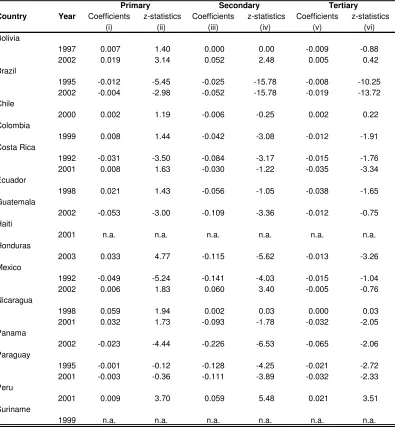
Differences in ethnicity are explicitly considered to be unacceptable sources for differences in access to education in the United Nations Millennium Declaration. In this chapter, we use econometric tools to assess how being indigenous or of afro-descent affects the probability of school attendance. We estimate the conditional probabilities of attending school in order to capture differences between groups. The coefficients associated with ethnicity are interpreted as the difference in the enrollment rates when we compare two individuals that have the same (average) characteristics, with ethnicity as the only exception. The results indicate that, for primary education, ethnic discrimination exists only in Brazil, Guatemala and Panama; it is important to note that ethnic discrimination has decreased in Brazil (from 1995 to 2002), and disappeared in Mexico (from 1992 to 2002) and Costa Rica (from 1992 to 2001). The results also suggest statistically significant differences in secondary enrollment rates due to ethnicity in Paraguay and Honduras. We find ethnic discrimination in college for all countries, excluding Bolivia, Chile and Peru.
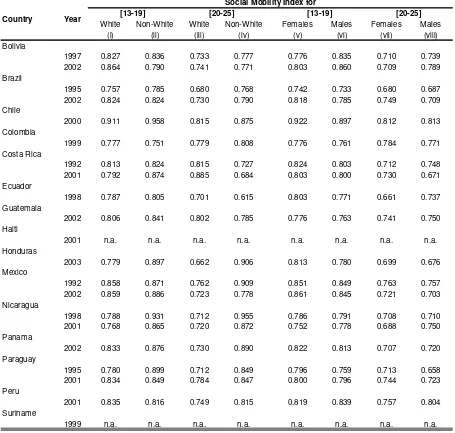
If family background explains children’s opportunities, then social mobility is low. We compute educational mobility indices based on Andersen (2001) for teenagers (aged 13-19) and young adults (aged 20-25) by ethnicity for all LAC countries in the sample. The SMI is lower for non-whites than for whites, in only three out of thirteen countries. The fact that the SMI is higher for whites than for whites may indicate that younger generations of non-whites might not be entrapped by their family background (at least compared to non-whites).
Chapter 4: Increasing Gender Equity (MDG 3)
The Millennium Development Goal 3 refers to the elimination of gender disparity in all levels of education by the year 2015. Latin America and the Caribbean is one of the regions in the world where the usual indicators of education show a relatively high gender equity- this holds when analyzing the sample by ethnicity. However, there are some exceptions worth noting. Whereas some countries do not exhibit this equality (e.g. Guatemala), in others, gender equality holds only in primary education, which is typically mandatory; in these countries, males tend to have higher secondary education enrollment rates.
As a measure for gender discrimination in educational scenarios, the MDGs propose the ratio of literate women to men aged 15–24 years old. This Literacy Gender Parity Index is considerably lower than 1 only for those indigenous and afro-descendants living in Peru (0.77), Panama (0.78) and Guatemala (0.85). The corresponding figures for whites are 0.92, 1.00 and 0.94, respectively. The other countries show no major differences by ethnicity in the ratio of literate women and men aged 15-24. Thus, most LAC countries in our sample seem to be performing well with respect to the MDG Literacy Gender Parity Index.
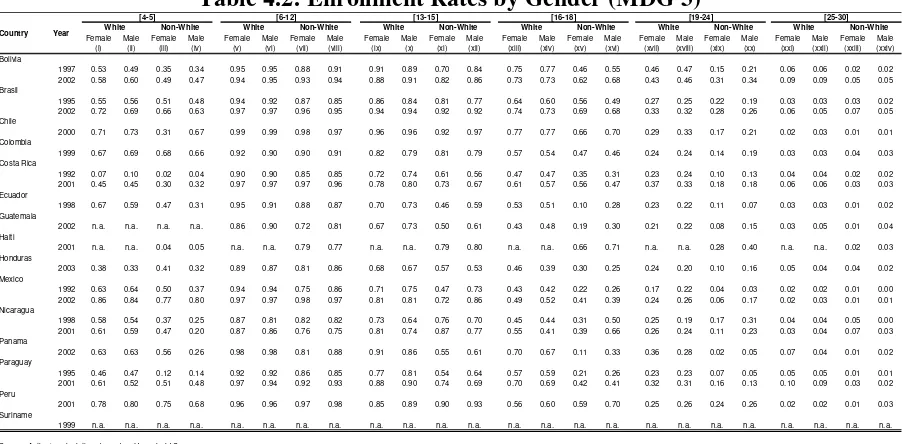
The ratio of girls to boys attending school is used as an indicator to monitor progress towards Goal 3, which regards gender equality in school enrollment. For children between 6-12 years old, we find gender equality in enrollment rates for both whites and non-whites in all countries, with the exception of Honduras and Panama for non-whites only, and Guatemala both for whites and non-whites. The 13-15 age cohort shows the smallest differences in school enrollment rates, by gender. Only non-white girls living in Ecuador, Guatemala and Mexico lag behind boys in the same age groups. We have found an increase in enrollment rates for non-white women and men in every country during the past few years.
There is evidence of statistical gender discrimination in access to primary education only for non-whites living in Guatemala and Panama. Bolivia and Peru show gender discrimination at the secondary school level for non-whites. Only among non-whites in Guatemala do we find gender discrimination in access to tertiary education. In summary, our results suggest that in most Latin American countries there is no evidence for gender discrimination with respect to access of education for both whites and non-whites.
Chapter 5: Achieving MDG Number One for Non-Whites
In this chapter we use a simple micro-simulation technique to estimate the effect at the national level of achieving the MDGs for the indigenous and afro-descendant populations in the Latin American and Caribbean countries in our sample. To this end, we simulate the implementation of a transfer program that allows indigenous and afro-descendent individuals to be relieved of poverty. The reduction in the poverty incidence at the national level varies widely between countries, ranging from 27 percentage points in the case of Haiti (from 51% to 24%) to 0.07 percentage points for Chile (from 3.53% to 3.46%). As expected, national poverty reduction is higher for those countries with a larger non-white population (i.e. Haiti, Bolivia, Guatemala, Paraguay, and Brazil).
It is useful to examine two basic ways in which the extent of poverty can be reduced: growth in the mean and/or reduction in inequality. Following ECLAC/IPEA/UNDP (2003), we present isopoverty curves that allow us to have an idea of the effort, in terms of income redistribution as well as economic growth, which would allow indigenous and afro-descendent individuals to halve their poverty incidence. The estimated isopoverty curves are relatively “flat”, implying that the poverty reduction impact of even a small transfer program is equivalent to that of many percentage points in accumulated economic growth. For example, in the case of Ecuador, an annual growth rate of 6% between 1998 and 2015 is equal, in terms of poverty reduction, to an income transfer 0.48% from income of the wealthy to poor non-whites. In the case of Bolivia, for instance, the MDG 1 poverty reduction target for the indigenous would be achieved, with no economic growth, and with a redistribution of 3.6% from total income of the wealthy to indigenous people in poverty.
Summarizing, the isopoverty curves show that the impact of even a small income redistribution from wealthy individuals to non-whites is equivalent to that of a relatively large annual growth rate until 2015. However, the simulation of a counterfactual income distribution through the mechanisms described above is a simple arithmetic exercise: there is no guarantee that it would be consistent either with (i) household behavior, and (ii) a general equilibrium of the markets in the economy (Ferreira and Leite, 2003).
Chapter 6: Explaining Differences Between Whites and Non-Whites:
Microeconometric Decompositions
incidence between whites and non-whites. To achieve this, we adapt the microeconometric decomposition methodology of Bourguignon et al. (2004) and Gasparini et al. (2004).
The basic idea of the decompositions is to simulate the income distribution of group g
(non-whites) if some of its determinants were those of group g’ (whites), and compare that
counterfactual income distribution to the real one of group g. The difference between the two
distributions can be attributed to differences between g and g’ in the selected determinants.
The observed and simulated income distributions can be compared in terms of a poverty index.
We find that the two most compelling poverty-increasing factors for non-whites are related to education: the returns-to-education effect, and the education effect. In eight out of twelve countries, the returns-to-education effect is poverty-decreasing. In countries such as Bolivia, Mexico, and Ecuador, if the returns to education of indigenous people were equal to those of white people, the poverty incidence for the first group would be more than 10 percentage points lower. In Brazil, Colombia, Peru, Guatemala, and Honduras, the difference in the returns to education also has a negative impact of about 5 percentage points in the indigenous and afro-descendent poverty incidence.
The differences in the education structure of the active population are important factors to the twelve countries in our sample. The indigenous and afro-descendant active populations tend to be less educated than their white counterparts. These differences have a negative effect in non-whites’ poverty incidence for eleven countries. The largest effects are observed in Mexico and Panama, where the education effect accounts for 15 and 13 percentage points of the difference in poverty incidence between whites and non-whites. In Honduras, Paraguay and Ecuador, the education effect accounts for more than 5 percentage points of the difference in poverty incidence by ethnicity.
We find that differences in individual characteristics among children of primary school attending age explain a large portion of the difference between rates of school attendance for whites and non-whites, in all countries. This conclusion applies to the three educational levels. The characteristic effects are always negative and, in most cases, they are larger than the parameter effects. This implies that differences in household per capita income, parental education, household size, and location are the most important factors behind the differences in enrollment rates between whites and non-whites. Differences in the way individuals make schooling decisions based on their characteristics (driven, for instance, by preferences) appear less important sources for differences in enrollment rates between ethnicity groups.
Chapter 7: Policies to Meet the MDGs
The underlying causes of poverty among the indigenous and individuals of afro-descent are largely structural. In addition, inequity manifests itself in terms of discrimination and inequality of opportunities for the indigenous and afro-descendant population with respect to access of basic services. Language, cultural differences and physical isolation can be important determinants of their situation, yet “social exclusion”, due to racial, ethnic and religious prejudice, tends to worsen their situation. Moreover, these groups have traditionally been excluded from the political process, thereby limiting their abilities to lobby for resources. Only until recently has this begun to change, especially since the transitions to democracy most Latin American countries experienced.
In this chapter we revise different policies to address the specific problems from which indigenous and afro-descendent populations suffer. The basic discussion regarding this issue is divided in two tendencies. Some people consider that both indigenous and afro-descendent individuals have to be treated as any other impoverished group of society and included in programs targeted to the poor population as a whole. Other individuals argue that indigenous and afro-descendant populations have cultural specificities that can only be addressed by special programs tailored to them.
To understand the profile of poor households and assess how government policies affect their welfare, it is necessary to have extensive, detailed and precise knowledge of the characteristics and behavior of the households in terms of income generation, consumption, location and access to social services. It has become clearer that it is necessary to improve the data-collecting tools in order to more accurately reflect the situation of the ethnic minorities in Latin America. If countries wish to address the challenges faced by the indigenous and afro-descendant population, the need to develop a set of standardized questions for surveys is urgent.
education programs. Various studies suggest that the implementation of this educational model can improve the performance of indigenous peoples through increasing enrollment rates, educational results and the level of attendance at school among girls, also reducing gender gaps in education, furthering comprehension of Spanish and increasing the participation of parents at school.
The experience of affirmative action policies in Latin America is still novel. The main challenge related to this type of policy is to identify the targeted population in a society that has more inter-racial marriages than in the US. The questions that remain to be answered before initiating this type of program are ‘who is black?’ and ‘who is indigenous?’ The use of a self-identification method can be a problem if the result of identifying oneself as black gives benefits with certainty.
A large problem related especially to some infrastructure projects undertaken in many countries is involuntary resettlement. Involuntary resettlement can have a dramatic impact on the lives of people living in areas that are undergoing large-scale development projects. Resettlement should be planned by trying to improve the living standards, physical security, productive capacity and income levels of the people affected or to restore these conditions to former levels within a reasonable time frame. Indigenous peoples represent a special case for resettlement because of their deep attachment to land and location. To date, there are only a handful of accounts of successful resettlements involving indigenous peoples. Nevertheless, indigenous social organization, cultural values and attachment to the land reflect centuries of practice, adaptation and survival strategies and hence, as a general rule, resettlement should be avoided.
Neither micro-enterprise nor social investment funds were originally designed to address rural poverty- a few countries have established specific funds for indigenous people. Social funds targeted to indigenous populations are distinguished by their approach and methodology. Typically, they have to address the features that differentiate the indigenous population from other sectors amongst the poor. There are four factors that are particularly important to this: (i) geographic isolation; (ii) social exclusion, based on ethnic or racial prejudice; (iii) social and cultural differences, covering areas such as language, structures of authority and economic values; and (iv) need to strengthen the capacity of indigenous organizations.
THE COLOR OF THE GOALS
ETHNICITY AND THE MILLENNIUM
DEVELOPMENT GOALS IN LATIN AMERICA AND
THE CARIBBEAN
*Matías Busso Martín Cicowiez Leonardo Gasparini
Centro de Estudios Distributivos, Laborales y Sociales (CEDLAS) Universidad Nacional de La Plata
Keywords: ethnicity, race, MDG, poverty, education, Latin America, Caribbean
* Mariana Orloff co-authored Chapter 7. The authors are grateful to many researchers at UNDP, IDB and The
World Bank for useful suggestions and interactions, and particularly to Enrique Ganuza for his many valuable comments, and support throughout the process of writing the document. The authors would also like to thank Elisabeth Diaz for her support and inputs in the finalization of this study The authors are very thankful to the research assistants at CEDLAS for their very able work, and their contributions to the study: Federico Gutiérrez, Leopoldo Tornarolli, Georgina Pizzolito, Paula Giovagnoli, Francisco Haimovich, Alejandro Támola, Joaquín Coleff, Hernán Winkler, Matías Horenstein, Evelyn Vezza, Rocío Crabajal, Gimena Ferreyra, María Victoria Fazio, Sergio Olivieri and Monserrat Bustelo.
Chapter 1
Ethnicity and the Millennium
Development Goals in Latin America and the Caribbean
*In September 2000, the world’s leaders adopted the UN Millennium Declaration, committing all nations to exert stronger efforts to improve human welfare across the globe. This ambitious declaration adopted by the General Assembly and ratified by other International Organizations defined a precise set of goals, numerical targets and quantifiable indicators to assess progress in several areas related to development. These objectives are now known as the “Millennium Development Goals” (MDGs), encompassing eight goals, eighteen targets and over fifty indicators (see Table 1.1). Taking the year 1990as a baseline, the MDGs to be achieved by 2015 include: (1) Halving extreme poverty and hunger; (2) Achieving universal primary education; (3) Promoting gender equality; (4) Reducing under-five mortality by two-thirds; (5) Reducing maternal mortality by three-quarters; (6) Reversing the spread of HIV/AIDS, malaria and tuberculosis; (7) Ensuring environmental sustainability; and (8) Developing a global partnership for development.
The progress towards the completion of the MDGs is being followed by many International Organizations, which are gathering data and making it comparable across countries. Most of the data produced to assess progress are, however, national averages. It is crucial to take into account that, while national performance indicators help to convey what is happening to a given country’s population, progress often differs widely across regions or groups within the same country. Countries with good average performance indicators might contain groups in the population that are being left behind- consequently, indicators used to assess national progress towards the MDGs may not adequately reflect the living conditions of many individuals. Some countries might, for instance, be involuntarily advancing via a top-down approach, investing resources in groups that are easier to reach, such as the middle class or urban population. For this reason, sub-national trends deserve attention even among countries that appear to be performing well in the aggregate. In an attempt to fill this informational gap, the aim of this paper is to determine if within LAC countries, there are differences between target groups as proposed by the Millennium Declaration.
The emphasis in this study is placed on ethnicity. In particular, we analyze the situation of indigenous and afro-descendent groups vis-à-vis euro-descendent and mestizo groups, using household surveys from fifteen LAC countries and using, when possible, comparable methodologies.
* All the tables included in this chapter can be downloaded from
1. MDGs in Latin America
1Many human development indicators in LAC are converging to the levels of wealthy countries. Some goals proposed in the Millennium Declaration were chosen taking into account the situation of countries that are less developed than the average country in the LAC region. For example, when comparing gender differences in education, in the case of LAC, women are equally and sometimes more educated than men. A similar situation occurs with populations living on less than one-dollar a day. Although this is not a good measure to define poverty in most LAC countries, it is still relevant in, for instance, for Sub-Saharan African countries.2 Here, we briefly introduce each goal and give a perspective of the relative situation of Latin America with respect to the rest of the world.
Goal 1. Eradicate extreme poverty and hunger. As seen in Graph 1.1, this target has already
been met in East Asia and the Pacific (mainly due to the extraordinary performance of China), while in the rest of the developing countries, more effort remains needed. Extreme poverty (i.e. 1 U$S PPP) declined everywhere during the last ten years, except in the poorest region of the world, Sub-Saharan Africa. A similar pattern is observed when measuring poverty according to 2 U$S PPP. In this case, it is clear that the situation in LAC countries is disappointing.
- Insert Graph 1.1 -
We can think of changes in income poverty as the result of changes in average income and changes in income inequality. During the 70s, the LAC region experienced a significant fall in poverty, mainly due to growing economies with stable income distributions. The 80s, however, experienced an opposite turn of events, with falling incomes and more unequal distributions combining to generate an important increase in poverty statistics. During the 90s, again a different combination of events was observed: despite some un-equalizing changes in the income distribution, the recovery of several LAC economies generated a reduction in the poverty indicators for the region as a whole as well as in most countries.3 Overall, in the last three decades the region has experienced a substantial fall in poverty. Still, the region requires an aggregate reduction of several points in poverty to accomplish the MDGs. Even if this is accomplished, it should be clear that this would not imply achieving the goals in every country; moreover, this would not imply the fulfillment of goals for every group within each country.
1 This section was based on data from http://www.developmentgoals.org/ (that belongs to the World Bank) and
http://www.worldbank.org/research/povmonitor/.
2 See Besley and Burguess (2003).
Goal 2. Achieve universal primary education. In the case of education, the situation is
different (see Graph 1.2). Many regions including LAC are on track to reach the target by 2015. Moreover, LAC countries have experienced the greatest increase in the primary completion rate. Nevertheless, the evidence presented in this paper suggests large differences across and within countries, which should be considered in order to target educational policies towards reaching the poorest.
- Insert Graph 1.2 -
Goal 3. Promote gender equality and empower women. In most developing countries, gender
gaps still exist in enrollment at all levels of education. In the case of LAC, as seen in Graph 1.2, girls have reached boys in the enrollment rate of primary and secondary education. However, even though regional averages show a great advancement among women as a whole, there are still persistent problems between certain groups of women; the greatest differences are between the rich and poor, urban and rural regions, and ethnic origins. In this study, we show that in almost every country the levels of education of indigenous women are significantly lower than those of non-indigenous women.
Goal 4. Reduce child mortality. In 2001, the average under-five mortality rate was 121 deaths
per 1,000 live births in low-income countries, 41 in lower-middle-income countries, and 27 in upper-middle-income countries. In high-income countries, the rate was less than 7.4 Usually, the cause of child death is a disease or a combination of diseases and malnutrition that could be preventable.5
In LAC, children’s health has been improving steadily over the past decades and it appears as though the region will achieve this MDG. As with the previous goals, the situation varies considerably from country to country as well as within countries. For instance, child mortality rates range from 80 per 1,000 live births in Haiti is to 7 per 1,000 in Cuba.. If we look at intra-country differences, in most of the countries, the situation is more severe in rural zones than it is in the urban areas, especially in Peru (28/60), Brazil (42/65) and Bolivia (53/100).6
Goal 5. Improve maternal health. Even though maternal mortality is higher in all developing
regions than in developed countries, within developing countries we can identify two groups; whereas Eastern Europe, Central and Eastern Asia, Middle East, North Africa and LAC countries have maternal mortality rates lower than 200 per 100,000 live birth, South Asia and Sub-Saharan Africa have maternal mortality rates much higher (600 and 900 per 100,000 live birth, respectively). Still, some authors have pointed out that maternal mortality rates in LAC
4 See World Bank (2004).
5 The most common causes being acute respiratory infections, diarrhea, measles, and malaria.
did not improve during the last decade7 and that, again, country differences are important, ranging from 27 in Uruguay to 680 in Haiti per 100,000 live births.
Goal 6. Fight HIV/AIDS, malaria and other diseases. HIV prevalence rates are still increasing
for men and women in the developing world. The rate is seven times higher in developing countries than developed countries for women and almost three times higher for men. If we look at LAC, the situation has recently been deteriorating; even if the prevalence index of HIV is low (relative to other regions), there are signs that the disease is propagating more rapidly, especially in the Caribbean and Central America. Also, in this case, certain groups within the population are more susceptible to the disease than others (e.g. individuals with little or no education). The condition with respect to tuberculosis is also grave. According to the World Health Organization, the world’s rate of death as a consequence of tuberculosis is 28 per 100,000 inhabitants. In LAC the average rate is 41, four times the rate of developed countries.
Goal 7. Ensure environmental sustainability. In this paper, when analyzing Goal 7 we focus
on living conditions of the population (access to water, sanitation and secure dwelling) and for expository simplicity, we associate that to poverty in place of environmental sustainability.
An estimated 75 million people do not have access to clean water in their regions8; these individuals represent 7% of urban and 39% of rural populations. Approximately 116 million people (13% of urban and 52% of rural populations) do not have access to sanitary services. Deficient sewage and water services are proven to directly cause the deterioration of health conditions and the increase of gastrointestinal diseases, premature death and diminution of life expectancy. This means that deterioration of water conditions may have an impact on other goals, especially those related to health, thus highlighting the urgency to improve this situation.
Goal 8. Develop a global partnership for development. According to the World Bank, this
calls for an open, rule-based trading and financial system, more generous aid to countries committed to poverty reduction, and relief of debt problems in developing countries. It also calls for cooperation with the private sector to address youth unemployment, ensure access to affordable, essential drugs, and make available the benefits of new technologies.
In this paper, we shall focus on the analysis of goals 1, 2, 3 and part of goal 7 for three
reasons. First, some goals are more relevant than others for LAC as a region, in the sense that there are goals in which significant improvements remain to be seen (such as the case of goal
7 AbouZahr and Wardlaw (2001).
1 and part of goal 7). Second, some goals are almost achieved in the aggregate- it is thus
important to check if some groups are left behind (as in the cases of goals 2 and 3). Finally, in
the event that it would be desirable to analyze goals 4, 5, and 6, it is impossible to do sowith
household survey data that does not include information on health.
2. Ethnicity and the MDGs
In addition to achieving the MDGs, countries should aim to achieve them in a context of equal opportunities for every citizen, regardless of ethnicity, gender, age-group or location. More specifically, we will analyze the MDGs through the lens of ethnicity and, in some cases, gender. In many cases, however, we will be implicitly analyzing differences associated with location as in several countries indigenous and afro-descendent groups live in some specific areas- or with age-groups, as many of the MDGs are targeted to individuals belonging to specific age-groups.
At this point one might wonder why ethnicity will be analyzed versus other characteristics: Latin America and the Caribbean is a racially and ethnically diverse region and, at the same time, it has a highly unequal distribution of income, suggesting that the level of well-being might not be equitably distributed between races. Furthermore, the fact that indigenous people are poorer, less educated and experience worse living conditions than the non-indigenous population in Latin America is a well-known fact. Psacharopoulos and Patrinos (1994) analyzed in great detail the situation of indigenous peoples in the four Latin American countries having the largest indigenous populations: Bolivia, Guatemala, Mexico and Peru. They found a higher incidence of poverty, worse living conditions and lower levels of educational attainment among indigenous peoples. Is that still the case? What is happening with indigenous people in other LAC countries? And what is the situation of afro-descendent people?
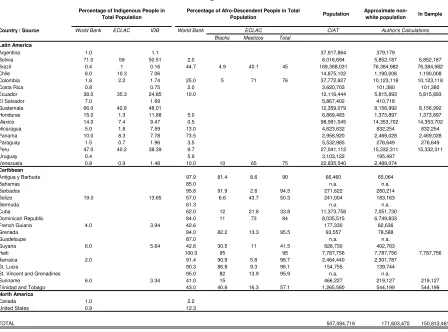
Our sample includes fifteen LAC countries: Bolivia, Brazil, Chile, Colombia, Costa Rica, Ecuador, Guatemala, Haiti, Honduras, Mexico, Nicaragua, Panama, Paraguay, Peru, and Suriname.9 It is estimated that the actual population of LAC is approximately 510 million people, of which approximately 172 million are non-white (i.e. indigenous or afro-descendent individuals). Our sample represents almost 90% of those indigenous and afro-Latin persons- making this paper, at least to the extent of our knowledge, the most representative analysis of
9 From Latin America, only Argentina, Uruguay, El Salvador and Venezuela were excluded from our sample. In
poverty, educational outcomes and gender with respect to ethnicity for Latin American and Caribbean countries.
We have two main objectives. First, we explore the situation of indigenous and afro-descendent people in terms of poverty, educational achievement and gender equality. In particular, we investigate the “distance” of these groups to the national average in some of the MDGs, and their performance during the last decade toward those goals. Comparisons with other groups (e.g. euro-descendents and mestizos10) of both the present situation and past
performance in relation to the MDGs will be highlighted.
Second, we will perform a set of micro-simulations to increase the understanding of the factors behind the income and educational disadvantages of indigenous and afro-descendent peoples, and to portray different scenarios (in terms of growth and redistribution) in which poverty in these groups can be significantly reduced.
3. How Many Indigenous and Black People Live in LAC Countries?
In this section we make an attempt to define ethnicity and to determine an operational definition that allows us to identify ethnic groups in LAC household surveys. We also try to determine, using several different sources, the number of indigenous and afro-descendent people who live in Latin America and the Caribbean today.
The concept of “ethnic group” refers to people who share a common language, territory, cultural background and/or physical characteristics and are somehow embedded in the rest of the society.11 This means that within what we usually call indigenous and afro-descendent
people, there exist potentially many ethnic groups.12 Indeed, Latin American’s ethnic
spectrum is very diverse. It comprises communities of people who speak very different languages, and share different cultures and traditions. There are approximately 400 different
indigenous languages spoken throughout Latin America and the Caribbean.13 Moreover,
among what we usually call indigenous peoples, there are descendent from very diverse pre-Columbian tribes. Afro-descendent people also have heterogeneous backgrounds: among them there include individuals whose ancestors were brought (or came) to Latin America in different times, from different countries and with a diverse cultural background. Some of these groups have remained isolated while others have mixed with the rest of the society, leading to further ethnic diversity.
10 The word mestizos refers to people who have both European and indigenous heritage.
11 Urban and Sherzer (1992).
12 See Gonzales (1994) for an interesting discussion about the culture heterogeneity among indigenous people in
Latin America.
As we shall see later, despite this cultural diversity, indigenous peoples and afro-descendents share a common characteristic: they are usually among the poorest and least educated people in all LAC countries. Because the goal of this paper is precisely to analyze those kinds of characteristics (included among the MDGs), we will ignore any cultural heterogeneity and focus on the situation of two aggregated groups: indigenous and afro-descendent people vis-à-vis euro-descendent people.14
Unfortunately, the definition of ethnicity is too broad for it to allow a precise identification of who and who is not of indigenous or afro-descent. Therefore, the number of people belonging to these groups in each country is not clearly determined (from a conceptual point of view). Moreover, estimations vary (in many cases widely) depending on the operative definition of ethnicity and on the source of the data, that is, whether it is a census or a survey.
According to some estimates there are more than 50 million indigenous people and more than 120 million afro-descendents in LAC (see Table 1.2). This represents almost 33% of the total population of the region. The heterogeneity in ethnic structure between countries, however, is great. In Bolivia, Guatemala, Peru and Ecuador more that 25% of the total population is indigenous whereas in Panama, Brazil, Nicaragua and almost every Caribbean country more than 25% of the population is black. On the other hand, in some other countries such as Argentina and Uruguay, only a small percentage of the population is indigenous or afro-descendent.
Despite the size of indigenous and afro-descendent populations, many censuses and household surveys in LAC have not identified ethnicity, at all. Only until very recently have some surveys included such types of questions. Furthermore, in the majority of cases the questions used to identify ethnicity vary between countries (and in many cases within countries, over time), thus impeding comparisons.
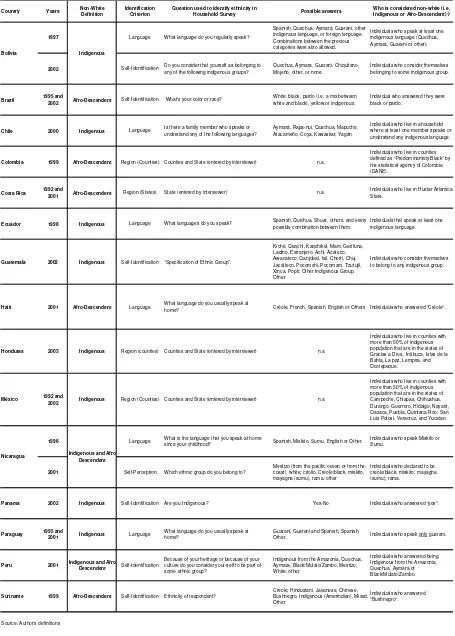
We follow three general methods to identify ethnicity in household surveys. Depending on the country, we consider that a person is indigenous or afro-descendent if he or she: (i) identifies himself or herself as belonging to a certain ethnic group, (ii) identifies his or her native language or speaks an indigenous language, or (iii) lives in a territory that is mostly populated by persons from a given ethnic group. Each method has some advantages and some drawbacks.
Many household surveys ask the individual if he or she considers himself or herself as belonging to certain ethnic group. This self-identification question can be used directly to
14 Further research should tackle the task of analyzing the situation of each ethnic group within indigenous and
identify ethnicity. In fact, an ethnic group is defined by some authors as “a self-reproducing social collectivity identified by myths of a common provenance and by identifying
markers”.15 The advantage of relying on self-identification is that it avoids language
proficiency issues and it allows individuals to choose whether or not they consider themselves as indigenous/blacks. This method’s drawback, however, is that classification as belonging to a certain ethnic group depends on how the survey’s question is asked, in what situation and by whom.16 This is particularly important where discrimination and social prejudice can induce the individual to deny affiliation to a certain ethnic group. We will use self-perception as a method of identification in Bolivia, Brazil, Guatemala, Nicaragua, Panama, Peru, and Suriname.
Alternatively, even if the household survey lacks information on self-identification, it may ask the individual whether he or she speaks an indigenous language. The underlying assumption (and main advantage) when using language as an identification variable is that language differences will exist until the ethnic group is completely integrated into the rest of the society. It can be claimed, however, that this might not be the case in those situations where primary education is predominantly given in the “official” language (i.e. Spanish, Portuguese, English or French, depending on the country). More importantly, if that “language policy” persists for a long period of time, it is likely that the native language would tend to disappear. For many years that was the case in almost every LAC country, and it is for this reason that we decided to use language only as a second resource to identify ethnicity; to partially overcome this drawback, we will consider as indigenous all those individuals who speak an indigenous language (even if they also speak the “official” language). There are typically three types of questions regarding language: one asks about the individual native tongue, the other about the ability of speaking an indigenous language and a final question asks the household head whether at least one individual in the household can speak an indigenous language. We will use language as an identification criterion in the cases of Chile, Ecuador, Haiti, and Paraguay.
Finally, a more imperfect way of identifying ethnicity is by the region in which the individual lives. This method essentially relies on the fact that some ethnic groups are geographically concentrated. The main advantage of this method is that it avoids any subjectivity. The disadvantage is, of course, that some individuals might be wrongly classified if segregation is
15 Smith (1990).
16 Gonzales (1994) claims that it is believed that the self-identification method may lead to underestimation
not complete. For each country where this criterion was used, we defined indigenous regions using census data. Indeed, the smaller the definition of region, the more efficient the criterion. Thus, whenever possible we used counties (municipalities) as the reference region.17 Also, if information of counties was not available in the household survey, we used states/provinces/departments. The first method was used in the cases of Colombia, Mexico and Honduras, whereas the second method was used only in Costa Rica.
In summary, we will be able to analyze the situation of indigenous and afro-descendent groups in terms of the MDGs in 15 countries covering almost 85% of the total population, and 90% of the indigenous and black populations in LAC countries.
4. Definitions of Ethnicity by Country
This section gives a detailed description of our operational definitions of ethnicity in each country: it discusses some assumptions we made, in addition to decisions we made, regarding those definitions and assesses the precision of those definitions.
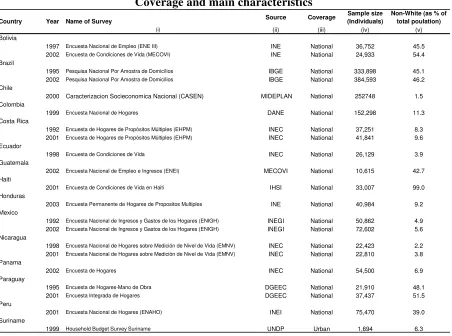
As we mentioned earlier, we consider a person as indigenous or afro-descendent if: (i) he or she perceives herself as indigenous, (ii) he or she speaks an indigenous language, or (iii) he or she lives in a region highly populated by indigenous/black individuals. Table 1.3 summarizes information on data source, coverage of household survey, sample size, and the percentage of non-white populations in each country. Four points are worth mentioning. First, all household surveys used in this paper cover both rural and urban areas: this is an extremely important fact given that many indigenous/black individuals live in rural areas. Second, it should be noted that the sample size varies widely between countries; Guatemala, Nicaragua and Suriname in particular have small samples.18 Finally, the percentage of indigenous/black people obtained in our samples approximately matches those obtained from census by other sources in Bolivia, Brazil, Guatemala, Haiti, Honduras, Mexico, Panama, and Peru. However, we do underestimate the number of indigenous/afro-descendant people in Colombia, Ecuador, and Nicaragua, and we overestimate the number in Costa Rica and Paraguay. Finally, it should be noted that the percentage of the non-white population captured by household surveys tends to be relatively constant over time, except in the case of Bolivia.19
17 This criterion was used by Panagides (1994) to identify indigenous people in Mexico.
18 In Guatemala this is not a problem since the number of indigenous people is large- therefore, when splitting
the sample between indigenous and non-indigenous each group has a relatively large number of observations. Unfortunately, Nicaragua and Suriname have a small sample size and a small percentage of indigenous/afro people in the sample. Consequently, some descriptive statistics will not be as reliable and some exercises will not be feasible.
19 This difference might be explained by a change in the definition of the sample. It is not explained by the fact
In Table 1.4 we summarize how we identified ethnicity in household surveys- it is worth discussing in greater detail some decisions we made in that process.
Decision 1 (Treatment of missing values). It is important to address the issue of how we treat
missing values in our samples. The interviewer always answers the question regarding “region”, so there are no missing values in that case. However, there is a prior expectation that some people do not answer questions on self-identification or on language. In those cases, we follow this procedure: (i) if he or she is not a child, we consider him or her as not indigenous/afro-descendent and (ii) if the individual is a child we assign him or her the answer of his or her mother (that is, if the mother is present in that household) or of the household head otherwise. This procedure was followed so as to minimize the loss of observations and important in countries with small samples and with small indigenous/black populations. Note, however, that the number of missing values was relatively small and thus our results are strong. There is only one exception: those cases where children who were 5 years old or less were not asked the questions (Bolivia and Peru). We claim that this exception is unique to those cases because ultimately, the child was assigned his or her mother’s (or household head’s) answer.
Decision 2 (Definition of “non-white” group). In general, every LAC country has in its
population euro-descendent, afro-descendent, indigenous peoples and people from other races (other races in LAC countries are typically a small fraction of the total population). Ideally, we would like to identify each of these groups in every country since that would allow for more accurate statistics. Unfortunately, LAC household surveys usually do not allow this kind of desegregation.
Since we are interested in determining how indigenous and afro-descendent individuals have faired (in terms of the MDGs) with respect to the euro-descendent population, we proceed in the following manner. We split our sample into two: a white group and a non-white group. The definition of white and non-white will differ between countries (Table 1.4). There are three cases:
• In those countries where we could identify both groups, we include in the non-white
group both indigenous and afro-Latin individuals. In Nicaragua and Peru the number of black people in the sample was too small to make any separate inference on their situation. In these two countries, we decided to analyze indigenous and afro-descendents as if they were one group. To obtain an idea of what data refers to in these countries it is important to highlight that in Nicaragua 5% of the population is indigenous and 13% is black while in Peru 47% is indigenous and almost 10% is black.
• In general, in countries where the indigenous population is small relative to the afro-descendent population, household surveys tend to capture only a small number of indigenous people (if any) and therefore we have to define the non-white group to be composed only of afro-descendent people (e.g. Haiti, Colombia, Costa Rica). The case of Brazil deserves special attention. Although there we were able to identify both indigenous and afro-descendent people, we decided to focus only on the afro-descendent population because studies of race and ethnicity in Brazil tend to work with this group that represents a high proportion of the total population.
• Finally, in those countries where the indigenous population is larger, household surveys tend to be designed in a way that allows for the identification of indigenous people and not afro-descendent individuals (i.e. household surveys use either self-identification or language that usually does not include an option for afro-descendent in its answers). We therefore define the non-white group in such a way that it only includes indigenous people (e.g. Bolivia).
Decision 3 (Analyzed years). We choose to analyze information from the latest available year
to have a perspective as updated as possible, and from one year during the 90s (in order to make comparisons). However, in several cases it was not possible to have information for the 90s because, as we have mentioned earlier, only until recently have many countries included questions on ethnicity.
Decision 4. (Self-Identification was chosen over Language –whenever possible-). In Peru
2001, Nicaragua 2001 and Bolivia 2002, we have information on self-perception and language to identify ethnicity. In the case of Nicaragua and Peru, the decision to use self-perception (even when we used language to identify ethnicity in Bolivia 1997 and Nicaragua 1998) was due to the fact that it allowed us to capture the situation of the afro-descendent and indigenous population –even if we were not able to analyze separately the situation of both groups- whereas having used language would have forced us to analyze only the situation of indigenous people. Having said that, it is important to note that the correlation between language and self-perception was highly positive and statistically significant in both cases20, and that all of our results are robust with this decision (i.e. results do not change when we use language instead of self-perception).
In order to make results comparable, in Bolivia we also used self-perception as an ethnic identifier. Again, we found a significantly positive correlation of 0.46 between language and self-perception, unfortunately some results from this paper were not robust with this decision (from a quantitative point of view). This was basically explained because many individuals who considered themselves as indigenous did not speak any indigenous languages. Wood and
Patrinos (1994) used language as an ethnic identifier in Bolivia (self-perception was not available in the survey they used). We decided to use self-perception because, as we mention above, language can be more influenced by the educational system.
Decision 5 (“Exceptions” to definitions of ethnicity). In every country where we used
self-perception to identify ethnicity, we decided to classify people who declare themselves to be “mestizos” as white (basically because they have some white heritage). The only exception was in Brazil, where we classified “pardos” (i.e. individuals that descend from white and black people) as afro-descendent. This choice was done to make our results comparable with the rest of the literature on ethnicity and race in Brazil.21
In addition, when we used language to identify ethnicity we treat as indigenous all those individuals who declare to speak at least one indigenous language. The only exception was
Paraguay, where Guaraní is the official language; many people speak this language, regardless of whether or not they are indigenous. This essentially explains the great overestimation of the percentage of indigenous people in the total population (with respect to alternative sources). To partially fix this problem we decided to classify as indigenous those individuals who only speak Guaraní.
Decision 6. (Indigenous/Afro-Descendent Regions). As we mention earlier, in Colombia,
Honduras and Mexico we were able to use counties to identify regions, making our results more precise. In Costa Rica, this was not possible because of data unavailability.
For Colombia, we defined non-whites to be people of afro-descent. In fact, the percentage of indigenous persons in the total population is approximately 2% while the percentage of black individuals is 25%. Afro-descendent populations are mostly concentrated around the coastal areas of the Pacific Ocean (which include the departments of Cauca, Chocó, Nariño y Valle22) and around the coastal areas of the Atlantic regions (which include the departments of Atlántico, Bolívar, Cesar, Córdoba, La Guajira, Magdalena y Sucre). In these last regions, however, white and non-white populations tend to be more mixed. In light of this, we decided to use counties to make our identification more precise.23
For Honduras, we defined non-whites as indigenous people since the percentage of indigenous people represents 15% of the total population while the percentage of black individuals is 5%. According to the 2001 census of data currently available, the indigenous
21 See for instance, World Bank 2003.
22 Although it should be noted that Cauca and Nariño have sizeable indigenous population.
23 We used information produced by Departamento Nacional de Planeación de Colombia that identifies black
counties characterized for having high percentage of afro-descendent persons in their population. For further details refer to the web page:
populations are clustered mainly in the states (departments) of Gracias a Dios, Intibuca, Islas de la Bahía, La Paz, Lempira, Ocotepeque. Within those states we identified “indigenous counties” as those with more than 21% of indigenous population (three times the average of the indigenous population in the country). In practice, this means that we end up considering indigenous all those individuals who live in counties with more than 50% of indigenous populations.
For Mexico, we also defined non-white as the indigenous population (14% of Mexican population is indigenous and 0.4% is afro-Latin). The majority of the indigenous population is located in the south of the country. In particular, we considered to be indigenous all those individuals who live in counties that have, according to data from census, more than 50% of indigenous in their total population. Indigenous counties are located in the departments of Campeche, Chiapas, Chihuahua, Durango, Guerrero, Hidalgo, Nayarit, Oaxaca, Puebla, Quintana Roo, San Luis Potosí, Veracruz, and Yucatán.
For Costa Rica we made two decisions. First, we decided to analyze the afro-descendent population instead of the indigenous population because the first group is larger and is geographically more concentrated. Second, following World Bank (2002) we consider the region (state) Huetar Atlántica (located on the Caribbean Sea coast) to be “predominantly black” and the rest of the country to be “predominantly white”.
5. Socio-Demographic Characterization of Non-White People in LAC
Before starting the analysis of each MDG, this section presents a description of some important socio-economic characteristics of indigenous and afro-descendent people. The goal is to understand three characteristics of these groups: location, types of families and labor market variables (including, unemployment rates, type of jobs and economic sectors in which indigenous and afro-descendent individuals tend to participate more).
In particular, we found that average non-white families in LAC countries live in rural areas and are slightly larger (usually with more children) than white families. Also, we show evidence that a typical indigenous or afro-descendent male has the same participation rate in the labor market and experiences lower rates of unemployment than his white counterpart. He also has a higher probability of working in the primary sector of the economy, is usually self-employed and works in a small firm. The average indigenous or afro-descendent female, on the other hand, tends to have lower participation and employment rates than her white counterpart.
Location. In every LAC country, over 45% of the indigenous or afro-descendent population
underdeveloped than urban areas. Usually, schools or hospitals are difficult to access, and infrastructures like sewage and safe water are not available. These characteristics tend to make poverty among people living in those areas more persistent; children with less access to health and education services will have more obstacles to leave poverty when they are adults.
- Insert Graph 1.3. -
Rural areas, however, are not homogeneous regions across LAC countries. It is estimated that over ninety percent of indigenous people are sedentary subsistence farmers that cultivate small plots (minifundios) and supplement their resources with seasonal wage labor, mining
activities, and artisan production. The other ten percent of indigenous people live in tropical or dry forest areas. Although they usually live in remote environments, they have become increasingly vulnerable because of the pressures on their lands and natural resources caused by mining ventures and the expansion of the agricultural frontier.24
Afro-descendent people, on the other hand, live predominately along the continent coastal areas in the Pacific and the Atlantic oceans or along the Caribbean Sea25, and are not as rural as indigenous people. In Brazil –the country with the largest afro-descendent population in South America- afro-descendent communities living in rural areas is only 19%. Moreover, we found that the difference in location patterns between white and black people in Brazil, and Colombia26 are smaller than the difference between white and indigenous people in other LAC countries.
This difference in location between afro and indigenous people is an important fact to acknowledge when targeting developing plans in black and indigenous communities. In the latter case, location can be used as a targeting factor whereas it seems that in the first case it cannot.
Family Characteristics. Gender structures between white and non-white individuals are, as
expected, very similar (see Table 1.5). The structure of each population, however, differs in terms of age. Excluding Chile, the percentage of individuals who are younger than 14 years old is higher in non-white groups (see Table 1.6). Another way of considering this fact is that non-white families tend to have more children than their white counterparts; this difference, in some cases, is similar to cases in Ecuador, Honduras, Panama and Nicaragua. In the latter country, for instance, the average number of children in a euro-descendent or mestizo family is 1.3 while in its indigenous counterpart the number is 2.6 (see Table 1.7).
- Insert Graph 1.4 -
24 IDB, 1997.
25 World Bank, 2003.
This translates, in many cases, to differences in family size. A typical non-white family has in general a larger number of members than a white family, yet this difference is smaller than expected. One possible explanation is that non-white people get married before or that they leave their parents home at an earlier age than do white people- this explanation is consistent with the result that there exists a higher proportion of married people among the group of 25-45 years old in the non-white group. Finally, we also found a lower proportion of single-headed families among the non-white population (see Tables 1.8 and 1.9).
Labor Market Characteristics.27 The analysis of labor market characteristics by ethnicity
can also help us to later understand some of the causes of differences in poverty and educational outcomes between white and non-white people.
Let us first focus on men who are in their prime age (i.e. who are between 25 and 50 years old).28 Both white and non-white men participate actively in the labor market; this means that a high percentage of individuals in this group are either employed or unemployed (but are not inactive). There is, however, one difference between groups, which concerns the way in which individuals actually participate in the labor market: white individuals present higher rates of unemployment than do non-white individuals (see Graph 1.5).
- Insert Graph 1.5 -
Part of this difference in unemployment rates comes from a fact already mentioned: non-white people are more concentrated in rural areas, where unemployment tends to be much lower than in urban areas. Differences in unemployment rates are also driven by differences in financing capacities during the unemployment period. In countries that lack unemployment insurance (or similar mechanisms that finance job searches), unemployed workers have to finance the unemployment period by themselves.29 If the worker cannot finance the period during which he or she is searching for a job, the worker will end up being forced to accept any job. If markets are integrated, in the sense that both white and non-white individuals have access to the same jobs, a higher unemployment rate in white individuals might suggest that white people have better means to finance job searches than do non-white people (either because white men are wealthier or they used to work in a formal job that provided them with severance payment).
Indeed, descriptive data tend to support this view: the proportion of white men working in informal jobs is much lower than the proportion of non-white men working in informal jobs.
27 For detailed data please refer to Tables 1.10 – 1.13.
28 The reason for focusing on people in their prime age is that it avoids questions related to preferences or
intertemporal decisions. Essentially, younger people have higher chances of being (or considering being) in school and older individuals are more likely to be retired. In other words, they have a lower attachment to the labor market.
As it can be observed from Graph 1.6, a pattern observed almost in every LAC country is that non-white individuals tend to work in the agricultural sector, usually self-employed and in small firms.
- Insert Graph 1.6 -
The case of women is more complex to analyze and actually very little can be said from descriptive statistics. Latin American women have been changing their behavior with respect to labor market participation in the last thirty years. The process began many years ago in some countries (e.g. Brazil) and is a relatively new phenomenon in other countries, such as Ecuador or Paraguay. Graph 1.7 shows that, nowadays, labor market participation and employment rates are higher among non-white women only in Bolivia, Ecuador, and Peru. However, the trend in female participation can change these facts rapidly within the next years.30
- Insert Graph 1.7 -
30 In this sense, note the rapid increment of participation of white female in the cases of Costa Rica and Mexico
References
AbouZahr and Wardlaw (2001). Maternal mortality rate in 2000. World Health Organization.
Mimeo.
Besley, T. and R. Burguess (2003). Halving Global Poverty. Journal of Economic
Perspectives 17 (3): 3-22.
Gasparini, L. (2003). Different Lives: Inequality in Latin America and the Caribbean. Chapter 2 of Inequality in Latin America and the Caribbean: Breaking with history? Edited by
The World Bank LAC Studies. Washington, D.C.
Gonzales, M. L. (1994). How Many Indigenous People? Chapter 3 in Indigenous People and
Poverty in Latin America. Edited by The World Bank. Washington, D.C.
Homberger, N. (1992). Literacy in South America. Annual Review of Applied Linguistics 12:
190-215.
IDB (2003). Los Objetivos de Desarrollo del Milenio en América Latina y el Caribe. Edited
by Inter-American Development Bank. Washington, D.C.
OPS/WHO (2003). Situación de Salud de las Américas 2003: Indicadores Básicos de Salud.
Edited by World Health Organization.
Panagides, A. (1994). México. Chapter 7 in Psacharopoulos, G. and H. Patrinos (eds) (1994).
Indigenous people and poverty in Latin America. Edited by The World Bank.
Washington, D.C.
Psacharopoulos G. and H. Patrinos (eds) (1994). Indigenous People and Poverty in Latin
America. Edited by The World Bank. Washington, D.C.
Sala-i-Martin, X. (2002). The World Distribution of Income (Estimated from Individual Country Distributions. Columbia University. Mimeo.
SIL, (1988). Ethnologue Languages of the World. Summer Institute of Lingustics. Dallas,
USA.
Smith, G. H. (1990). The Politics of Reforming Maori Education. In Towards Successful
Schooling. Edited by The Falmer Press. London.
Székely, M. (2001). The 1990s in Latin America: another decade of persistent inequality, but
somewhat lower poverty. Inter-American Development Bank Working paper 454.
Urban, G. and J. Serzer (1992). Nation-States and Indians in Latin America. University of Texas, Austin. Mimeo.
Wodon, Q. et al. (2000). Poverty and Policy in Latin America and the Caribbean”. World
Bank Technical Paper 467.
Wodon, Q. et al. (2001). Poverty in Latin America: Trends (1986-1998) and Determinants.
Cuadernos de Economía 38 (114): 127-153.
Wood, B. and H. Patrinos (1994). Urban Bolivia. Chapter 5 in Psacharopoulos, G. and H. Patrinos (eds) (1994). Indigenous people and poverty in Latin America. Edited by The
World Bank. Washington, D.C.
World Bank (2003). Geographic Location of Afro-descendant Populations. In
http://wbln0018.worldbank.org/LAC/.
World Bank (2004). Millennium Development Goals. In www.developmentgoals.org.
World Bank (2003). Inequality in Latin America and the Caribbean. Breaking with history?