Winter water mass of the Veracruz Reef System
J. J. SALAS-PÉREZ
Facultad de Ciencias Biológicas y Agropecuarias, Universidad Veracruzana Km. 7.5 Carretera Tuxpan-Tampico, Col. Universitaria, 92780, Tuxpan-Veracruz, México
Corresponding author; e-mails: [email protected]/[email protected]
V. ARENAS-FUENTES
Instituto de Ciencias Marinas y Pesquerías, Universidad Veracruzana Hidalgo 617, Col. Río Jamapa, 94290, Boca del Río-Veracruz, México.
Received January 21, 2010; accepted October 5, 2010
RESUMEN
Por primera ocasión, las características de la masa de agua costera para la estación de invierno, que se ex-tienden sobre el sistema arrecifal veracruzano (SAV) han sido investigadas usando perfiles hidrográficos, medidos durante dos colectas separadas, de dos días de duración en las regiones sur y media-norte del área de estudio. Esas primeras observaciones, muestran dos características notables: la diferencia de 5 ºC entre los valores de temperatura de invierno comparados con los valores de temperatura de verano, además, localmente (a escala del SAV) hubo una notable diferencia entre la primera y segunda colecta de datos en cuanto los los valores de temperatura y salinidad de~ 2 ºC y ~ 2 ups respectivamente, entre la masa de agua costera de la región sur (Sistema Arrecifal de Antón Lizardo) y de aquella que se localiza en la región media (Río Jamapa) y norte de Veracruz (sistema arrecifal norte). Esta diferencia en la hidrografía del área de estudio se asocia al paso de un fuerte y fresco, evento meteorológico conocido como Norte(vientos soplando entre 12.1 a 18 m/s y temperatura atmosférica menor a 20 ºC). Esta variabilidad en la composición de la masa de agua, y sus valores bajos de temperatura (menores a 22 ºC), probablemente tiene efecto sobre el desarrollo de las comunidades de coral del área de estudio.
ABSTRACT
between 12.1 to 18 m/s) to fresh (atmospheric temperature minor of 18 ºC) norther. This variability in the water mass composition (with temperature lower than 22 ºC) probably has effects on the development of the coral communities of the sampled area.
Keywords: Winter season, continental shelf, Gulf of México, T-S diagrams, norther, tropical coral reef, SST images.
1. Introduction
The winter coastal water mass over the inner western continental shelf of the Gulf of México remains uncharacterized, particularly at the tropical Veracruz Reef System (VRS) (Fig. 1). Currently satellites are not capable of sampling important variables in the coastal zone (like temperature, salinity and density), where scales are smaller than those in the open ocean. For this reason temporal and spatial sampling of fine scale oceanographic variability of hydrographic parameters in the coastal zone is needed to better understand how these variables fluctuate season to season, and by ocean-atmospheric interaction phenomenology, which also has effect on biological communities distributed along the coastal zone
(Horta-Puga, 2007; Salas-Pérez and Granados-Barba, 2008; Tunnell, 1992; Tunnell et al., 2007).
The VRS is a protected natural area (Salas-Pérez and Granados-Barba, 2008) where several biological communities (mainly corals and fishes) interact among them, and comprise a stable ecosystem
(Carricart-Ganivet and Horta-Puga, 1993; Arenas-Fuentes and Salas-Pérez, 2005; Granados-Barba et al., 2007;
Withers and Tunnell, 2007; Salas-Pérez and Granados-Barba, 2008). This area is used for national fishing activities and as an international area for practicing ecological tourism (Arenas-Fuentes and Salas-Pérez,
2005; Granados-Barba et al., 2007; Horta-Puga, 2007; Jiménez-Badillo, 2007).
In the particular case of integrative studies of hydrological processes and coastal dynamics of the VRS, few studies have addressed this issue, which is required to understand the survival of
the coral reef system (Carrillo et al., 2007; Salas-Pérez et al., 2007a; Salas-Pérez et al., 2007b;
Salas-Pérez et al., 2008; Salas-Pérez and Granados-Barba, 2008; Salas-Monreal et al., 2009).
At the North of the VRS, the surface layer (~250 m) of the western continental shelf of the Gulf of México is structured by the subtropical subsurface water (StSsW) (36.5 of salinity and 20 ºC), and by the common gulf of México water (CGMW). Characteristic values of salinity and temperature values of this water mass are of 36.5 psu and 22.5 ºC. This water mass features are the result of a process of mixture induced by collisions of eddies, generated in the Loop current,
with the western continental slope (Vidal et al., 1994; Monreal-Gómez et al., 2004).
Each year, the western continental shelf of the Gulf of México is influenced by the passage of
cold fronts northers, pushed into the basin by mid-latitude circulation (DiMego et al., 1976). The
northers result from strong cold-air outbreaks that originate in North America from November to
May. During this period up to 30 of these events may be generated (Pereyra et al., 1992). These
northers are characterized by strong gusts of wind, ranging from 4 to more than 19 m/s. They
keep the Veracruz Reef System under the influence of northerly winds for more than 2 days (Fig. 1; Arenas-Fuentes and Salas-Pérez, 2005) and induce strong mixing between the upper and lower layers of the coastal water mass, and advection of cool and less saline water mass from the north. This promotes an intense variability in the oceanographic conditions in the area, with effects that last over several days. This variability and its resulting effects have not yet been documented.
factor governing the biogeography of the area, but they do not discard that salinity also plays an important role in the subject, among others factors (topography, depth, turbidity and nutrients).
Hence, the objective of this study is to characterize water parameters, such as temperature, salinity and density, during this period of the year, as a first contribution in the VRS, without the land drainage influence.
2. Study area
The study area is situated along of the Veracruz port and Antón Lizardo Village (Fig. 1). The reefs of the north and the south are divided by the Jamapa River discharge (Fig. 1). There is a station named el Tejar (19º4’2” 96º9’30”) situated in the Jamapa River to measure the daily discharge of the river to the sea (personal communication, CONAGUA, 2010). The data set collected, in the Jamapa River at the Tejar station (not presented here) showed discharges of lesser than of 3 m³/s, from January to April (2005-2006 years), in contrast with the mean daily river discharges from May to December which fluctuate from 10 to 185.99 m³/s (communication personal, CONAGUA, 2010). These data clearly demonstrated that the plume of the discharges does not change the hydrographic conditions of the area, as could happen during the summer months when the river discharge increases considerably due to the rain season. Thus, the hydrographic conditions of the water mass of the shelf of the VRS must be influenced by the river discharge. Moreover, the circulation pattern over the inner shelf of this area, described with numerical simulations, suggested that the winter flow under the influence of a norther event runs from north to south (Caballero-Rosas, 1990). Under these circumstances, the plume of the Jamapa River at winter season is probably deflected to the south, spreading its waters (low values of discharge <3 m³/s) toward the Antón Lizardo reefs (Salas-Pérez and Granados-Barba, 2008).
3. Material and methods
As part of the Monitoring of the Sistema Arrecifal Veracruzano project (MONSAV), a hydrographic survey was conducted onboard the R. V. Onjuku in winter of 2005, using a SeaBird 21 conductivity, temperature, depth recorder (CTD).
15´
12´
6´ Rio Jamapa
Veracruz
Anton Lizardo
Anegada de Afuera I. Verde
I. Sacrificios T14
Gulf of México
Study area
T13
T15 T12
T10
T7
T2
T1 T3 T4
T5 T8
T6 T11
T9
Blanca
3´
10´ 5´ 96ºW 55´ 50´
9.0´ 19ºN
The survey for measuring hydrographic profiles was done in two parts over the VRS. The first part was performed between the 28 and 30 of January by sampling the southern area of the study, locally named the Antón Lizardo reefs, situated on the south of the reefs Blanca and Anegada de Afuera (Fig. 1). The second part was performed from the 6 to the 8 of February, at this time the sampling areas were the Northern Veracruz Reef System and the frontal area of the Jamapa river’s mouth (Fig. 1). Between the first and second part of the survey, about six days,
a weather event, particularly a winter cold front,associated to anorther, passed over the Gulf
of México (Salas-Pérez et al., 2007b), perturbing the water mass features of the VRS during
the second survey.
Eight hydrographic transects (T1-T9, except transect 7, Fig. 1) were carried out in the first survey and seven transects (T10-T15, plus transect 7, Fig. 1) in the second survey (Fig. 1). Transect 9 was measured in the first survey during the night in a deep zone, and transect 7 was measured in the second survey during the day to avoid shallow zones of the reefs.
Thus, it avoids making the assumption that the features of coastal water mass of the VRS are perturbed by local scale variability, such as river discharges associated to rain and marine breeze events which, will generate a local scale marine circulation. In total, 115 stations were surveyed in the VRS, however, eight stations produced anomalous results due to technical problems with the CTD; thus they were not included in the analysis. Therefore, data from 107 stations were used to describe the hydrographic features of the coastal water mass throughout the VRS.
At each station, seawater temperature and salinity (T-S) profiles (salinity was measured on the practical salinity scale) were measured, 1 data every 0.5 seconds, at a variable depth (the maximum depth of the area was 48 m). Hydrographic profiles were interpolated using a slipine cubic interpolation algorithm because it was the best fit to the original profiles (minimal errors, 95% of confidence) and smooth the original data (Gilat, 2006) at 1 m between layers. Density profiles were computed employing the international equation of state (Fofonoff and Miller, 1983). T-S diagrams were generated from the interpolated hydrographic profiles to compare the composition of the water mass in the area.
In addition, vertical sections were generated with hydrographic transects 9 and 7 to show the structure of the water column, before and after the passage of the meteorological event over the
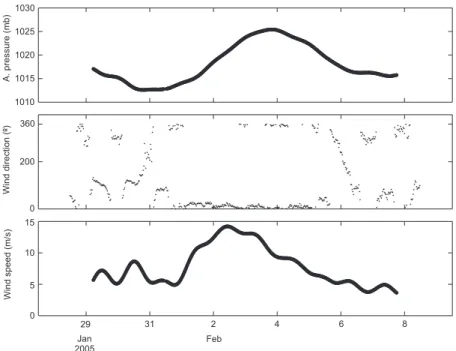
study area.Additionally,meteorological time series of atmospheric pressure, wind direction and
wind speed, measured from a fixed meteorological station situated on the Antón Lizardo headland (Fig. 1), were used to demonstrate the presence of the norther event.
4. Results
4.1 General features of the norther event
Between February 2 and 4, 2005, the norther passed over the study area (Fig. 2). This event increased the atmospheric pressure (Fig. 2a) and caused winds to blow from north to south (Fig. 2b), with fluctuating wind speed ranging from 0-19 m/s (Fig. 2c) and averaging 12 m/s. According to Pereyra’s
4.2 Hydrological analysis during the first and second survey
In general, the T-S diagrams of the first and second surveys showed differences in the temperature and salinity values within the area, indicating a distinctive water mass separation (Fig. 3). The water from the Antón Lizardo Reef System region (sampling area of the first survey) had somewhat higher T-S values in comparison to the waters in front of the Jamapa River and the Northern Veracruz Reef System regions (sampling areas of the second survey), which showed fresher and colder waters (Fig. 3). Quantitatively, the T-S values by region were as follows: The Antón Lizardo Reef System region (area of the first survey) was characterized by a water mass confined in the T-S interval from 21.46 to 23.40 ºC and from 35.06 to 36.46 psu. The water mass in front of the Jamapa River and Northern Veracruz Reef System (area of the second survey) had different T-S values between 19.47-21.64 ºC and 33.26-35.28 psu.
4.3 Intermix measurements and sampling sites
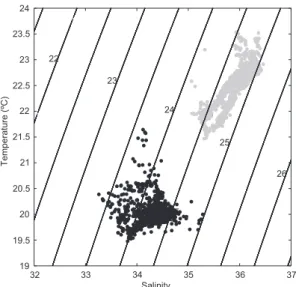
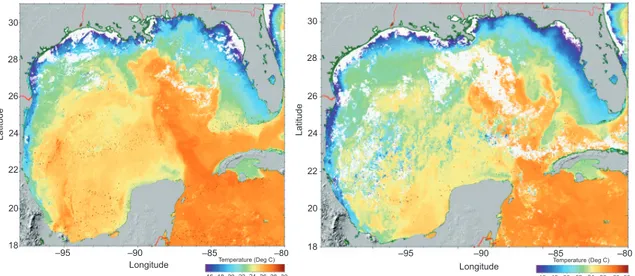
Transect 9, located in the middle region (Fig. 1), was performed in the first survey (before the norther event) and showed T-S characteristics (Fig. 4, grey points) similar to those found in the Antón Lizardo Reef System region (Fig. 3). On the contrary, transect 7 (performed after the norther event passed over the area; Fig. 1) showed T-S features (Fig. 4; black points) almost identical to those found in front of the Jamapa River and Northern Veracruz Reef System locations (Fig. 3; black points). In fact SST images (Fig. 6) showed two different patterns: The first one (before the norther), showed cooler water (<22 ºC) in the northern region of the VRS and in the frontal area of the Jamapa River, while in the southern region the water was warmer (~24 ºC)
1030
1025
1020
1015
1010
360
200
0 15
10
5
0
29 Jan
Wind speed (m/s)
A. pressure (mb
)
Feb 2005
31 2 4 6 8
Wind direction (º
)
(Fig. 6a). The other one, represented in Figure 6b (after the norther), showed all the VRS water spread with colder water (<22 ºC).
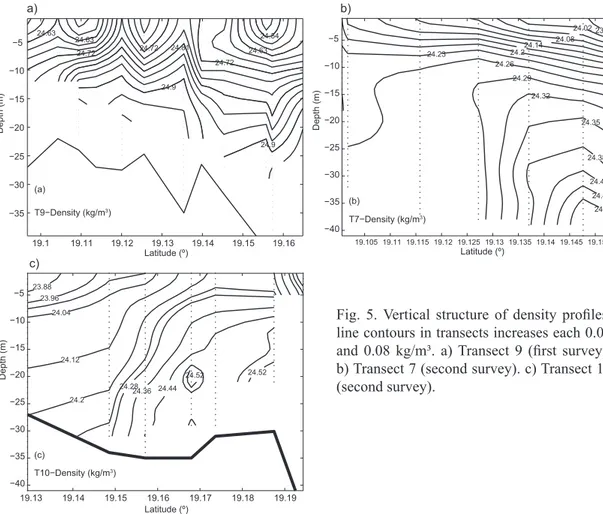
4.4 Vertical structure
Vertical sections of density show that the water column in transect 9 (first survey) is denser than the one in transect 7 (second survey). This indicate that a mixing mechanism, or water replacement, might have occurred in the column during the norther (Fig. 5). Another notable difference is that the water column in transect 9 is weakly stratified, whereas the one in transect 7 appears well stratified in its first 10 m. From 10 m to depth layers the spatial density structure, from the open ocean to coast, sinks. The same pattern is observed on the density structure of transect 10, with less dense water going to depth waters (Fig. 5c). This behavior could be associated with a downwelling event (see figures 5b and c).
5. Discussion
This is the first time that in-situ measurements of the composition of the Veracruz Reef System
water mass in winter have been performed. In situ measurements were collected in two separated
surveys, by the pass of a strong and fresh norther over the Gulf of México.
The predominant water mass within the western Gulf continental shelf is the CGMW,
characterized by T-S values of 22.5 ºC and 36.3-36.5 (Vidal et al., 1994; Monreal-Gómez et
al., 2004). The CGMW originates from the mixing of caribbean subtropical underwater with
water from the uppermost layer of the main thermocline (36.1-36.3), produced by the collision of anticyclonic eddies against the continental shelf of Tamaulipas and Veracruz states (Vidal
Fig. 3. T-S diagram over the Veracruz reef system. Water features of the southern region are drawn in grey points (first survey), water features of the middle and northern regions in black points (second survey).
32 33 34 35 36 37
19 19.5 20 20.5 21 21.5 22 22.5 23 23.5 24
Salinity
Temperature (ºC)
24
26 24
23
24 24.5
24.5
25 22
24242424 24.524.5
24 24.5
Fig. 4. T-S diagram of the intermix transects. Water features in transect 9 (located in the middle region), are drawn in grey points (first survey) and water features in transect 7 (located in the southern region) in black points (second survey).
32 33 34 35 36 37
19 19.5 20 20.5 21 21.5 22 22.5 23 23.5 24
Salinity
Temperature (ºC) 25
22
23
24
et al., 1994; Monreal-Gómez et al., 2004). In their study, Vidal et al. (1994) found that during winter, the coastal water masses of the northwestern continental shelf of the Gulf of México, out of the VRS, were affected by dilution of the river discharges.
However, as it was established previously, the discharge of the river is minimal in this period and, therefore, its effect to change the hydrographic conditions of the southern area is not evident in the data-set presented in this study. Moreover, the T-S diagrams over the Antón Lizardo reef system clearly showed a coastal water mass, with hydrographic values approaching those of the CGMW, with hydrographic values of 21.46-23.40 ºC and 35.06-36.46 psu (waters with relative high density), corroborating the low impact of the Jamapa River discharge in the coastal water mass of this area.
In this sense our results reinforce the idea that the hydrographic conditions of the coastal water mass, measured in front of the Jamapa River and northern Veracruz reefs system six days later (6-8 February) was affected by another natural phenomenon, in this case, the passage of a norther, which mixed the entire water column during its propagation over the area, resulting in hydrographic values of 19.47-21.64 ºC and 33.26-35.28 psu. This represents cooler and less saline coastal water in the inner shelf, with hydrographic values remarkably lower than the values of the CGMW.
19.1 19.11 19.12 19.13 19.14 19.15 19.16
−35 −30 −25 −20 −15 −10 −5 a) c) b) Latitude (º) Depth (m) 24.54 24.63 24.63 24.63 24.72 24.72 24.72 24.81 24.9 24.9
T9−Density (kg/m3)
(a)
19.105 19.11 19.115 19.12 19.125 19.13 19.135 19.14 19.145 19.15
−40 −35 −30 −25 −20 −15 −10 −5 Latitude (º) Depth (m) Depth (m) 23.99 24.02 24.08 24.14 24.2 24.23 24.26 24.29 24.32 24.35 24.38 24.41 24.44 24.47
T7−Density (kg/m3)
(b) 23.88 23.96 24.04 24.12 24.2
24.2824.36 24.44
24.52 24.52
Latitude (º) T10−Density (kg/m3)
(c)
19.13 19.14 19.15 19.16 19.17 19.18 19.19
−40 −35 −30 −25 −20 −15 −10 −5
Particularly from January 1995 to February 1996, a hydrographic sampling with six thermographs deployed along the littoral zone of the VRS was done (Hernández-Téllez and Salgado-Rivero, 1996). These results showed two different water masses: one coastal water mass (with salinity of 34-36.5 and temperature interval of 21-29 ºC) resulting from the mixing of the CGMW and the coastal water, and a water mass diluted (salinity interval of 29-34 and temperature of 27-33.5 ºC), as a result of the mixing of the river discharges in the area and the coastal water (Hernández-Téllez and Salgado-Rivero, 1996; Salas-Pérez and Granados-Barba, 2008).
The T-S diagrams, presented in this study, for the Antón Lizardo reef system and Jamapa River and Northern Veracruz Reef System (first survey and second survey, together) clearly showed a coastal water mass with hydrographic values approaching those of the coastal water mass, detected by Hernández-Téllez and Salgado-Rivero (1996), however we found differences of temperature and salinity, on their minimum and maximum values of 1.53 and 5.3 ºC and 0.74 and 0.04 psu. These differences are statistically significant to temperature but not to salinity, according to the null hypothesis explained by Emery and Thomson (1998). The differences found between both studies are due to the sites where the data-set collected with thermographs (littoral zone, Hernández-Téllez and Salgado-Rivero) and transects (inner shelf, of this study).
It is important to highlight that Hernández-Téllez and Salgado-Rivero (1996), demonstrated that temperature and salinity measurements along the year, are strongly modulated by the seasonal influence, with low temperatures in winter (21 ºC) and high temperatures in summer (29 ºC), opposite salinity values are high in winter (~36 psu) and low in summer (~31.5 psu). It is clear with those results that temperature and salinity parameters of the coastal water mass of the VRS, are strongly influenced by seasonal signal. However, during winter season the temperature and salinity of the water mass of the VRS could be affected by another natural phenomenon, in this case, the passage of
anorther which could mix the entire water column during its propagation over the area, by advection
of water from the northern Gulf of México, or generation of the downwelling phenomenon. Any of those phenomena induced the fluctuation of the water mass of the VRS, with hydrographic values
of 19.47-21.64 ºC and 33.26-35.28 psu (Salas-Pérez et al., 2007b).
Fig. 6. Sea surface temperature images (ORSG, Johns Hopkins University). a) January 31 of 2005. b) Composite image of February 5-7 of 2005.
30
26 28
22 24
20
18
–95 –90
Latitude
30
26 28
22 24
20
18
Latitude
–85 –80
Temperature (Deg C) –95 –90 –85Temperature (Deg C) –80
16 18 20 22 24 26 28 30 16 18 20 22 24 26 28 30
However the mixing hypothesis is that the level of stratification before and after the event passed is roughly comparable between transects 7 and 9 (the top to bottom density difference is of order 0.5). For transect 10 the top to bottom density difference is on the order of 0.64. On the other hand we compute the Ekman depth and the resulting value was of about 100 m with a mean wind of 12.1 m/s. It is a value larger than the depth of the study area which is no more than 50 m deep. Thus the mixing hypothesis could be plausible. However we cannot confirm it because the data set collected in the second survey was not recorded while the norther was affecting the area of study.
Another hypothesis on the variation of the hydrographic features of the coastal water mass of the VRS, is that the data in the second survey can be associated with a downwelling event. It seems probable because the wind was blowing parallel to the coast, along the western boundary of the Gulf of México, as it is seen in Figure 2b, where the winds direction are oriented from north to south. Hence, the Coriolis effect could create an Ekman transport to the coast, bringing waters
with less temperature and relative high salinity from open ocean (Zavala-Hidalgo et al., 2003).
Additionally the density transects in Figures 5b and 5c, showed a sink of waters from surface to depth layers, so meteorological data and hydrographic sections support this hypothesis. However, this hypothesis could not explain the decrement of salinity reported in the T-S diagrams during the second survey, because the Ekman transport bring water from open ocean to the coast with slightly
high values of salinity (Zavala-Hidalgo et al., 2003).
Another hypothesis to explain the differences of temperature and salinity values, of our sampling and the values found in the study of Hernández-Téllez and Salgado-Rivero (1996), could be the result of dilution of a water mass which is cooler and less saline, advected from the north. The advection must be intensified, during the pass of a winter cold front associated with a norther (Caballero-Rosas, 1990; Zavala-Hidalgo, 2003). Besides, it is in agreement with the study of Zavala-Hidalgo
et al. (2003), which mentioned that during non-summer months, the seasonal current, flowing to the south, transports low-salinity water from the Mississippi-Atchafalaya River to the southern Bay of Campeche, just passing over the VRS, but also there is the influence of Mexican rivers at the northern region of the VRS, like Pánuco, Tuxpan and La Antigua, which in conjunction with the Mississippi-Atchafalaya River, discharge cooler, less saline and less dense water over the inner shelf, which change the hydrographic values of the coastal water mass of the VRS remarkably, with values lower than the ones of CGMW. This hypothesis is supported with sea surface temperature maps presented in Figure 6, where the SST values showed warm waters for the southern region of the VRS and cool waters for the northern region located in front of the port of Veracruz, in the period comprised for the first survey (Fig. 6a). This temperature distribution of the water mass, indicates that the presence of reefs form a natural barrier that precludes the free flow of water to the south. This produces a water accumulation region that generates a pressure gradient which should be balanced by a speed component going north (Salas-Pérez and Granados-Barba, 2008).
The results of this investigation showed clearly the time variability of the conservative properties (temperature, salinity and density) on the water mass of the VRS. They are influenced by the peak of winter season and specifically by one norther which can cause water temperature to drop several degrees centigrades in a matter of hours-days (Arenas-Fuentes and Salas-Pérez, 2005).
In conclusion, it is possible that a combination of effects induced the variability of the coastal water mass on winter, being those, advection and mixing of the coastal water mass.
Hence, more work must be done in order to understand the effects of such rapid (few hours-days) environmental variability, and their effects on the coral reef communities in the area.
Acknowledgments
This study was made possible through the academic agreement between the Secretaría de Marina and the Universidad Veracruzana. We thank the crew of R. V. Onjuku, and the staff of the Instituto Oceanográfico del Golfo y Mar Caribe for helping us to collect the hydrographic profiles. We thank the economic support of SEP-CONACyT, through the project of Ciencia Básica 59882. Also, the comments of reviewers, improved strongly the presentation of the manuscript.
References
Arenas-Fuentes V. and J. J. Salas-Pérez, 2005. El Golfo de México, una aproximación a los
determinantes de su biodiversidad. In: Camarones,langostas y cangrejos de la costa este de
México (J. L. Hernández Aguilera, J. A. Ruiz Nuño, R. E. Toral Almazán and V. Arenas-Fuentes, Eds.) Econatura and CONABIO, México, 7-21.
Caballero-Rosas A., 1990. Modelación hidrodinámica numérica de la circulación por viento en la zona costera del Puerto de Veracruz y sus proximidades. Ms. Sc. Thesis on Oceanic Engineering, Instituto de Ingeniería, Universidad Veracruzana, México, 70 pp.
Carricart-Ganivet J. P. and G. Horta-Puga, 1993. Arrecifes de coral en México. In: Biodiversidad
marina y costera de México (S. I. Salazar-Vallejo and N. E. González, Eds.) CONABIO andCIQRO, México, 81-92.
Carrillo L., G. Horta-Puga and J. P. Carricart-Ganivet, 2007. Climate and oceanography. In: Coral
reefs of the southern Gulf of México (J. W. Tunnell Jr., E. A. Chávez and K. Withers, Eds.). Texas A&M University Press, College Station, USA, 34-41.
DiMego G. J., L. F. Bosart and W. G. Endersen, 1976. An examination of frequency and mean
conditions surrounding frontal incursions into the Gulf of México and Caribbean Sea. Mon.
Weather Rev. 104, 710-718.
Emery W. J. and R. E. Thomson, 1998. Data analysis methods in physical oceanography. Pergamon.
Great Britain, 634 pp.
Fofonoff N. P. and R. C. Millard Jr., 1983. Algorithms for computation of fundamental properties of seawater. UNESCO, Technical Papers in Marine Science, Paris, 44-53.
Granados-Barba A., L. Abarca-Arenas, J. M. Vargas-Hernández, 2007. Investigaciones científicas en el sistema arrecifal veracruzano. EPOMEX-UAC. México, 304 pp.
Gilat A., 2006. Matlab: Una introducción con ejemplos prácticos. Reverté, México, 331 pp.
Horta-Puga, G., 2007. Environmental impacts. In: Coral reefs of the southern Gulf of México
(J. W. Tunnell Jr., E.A. Chávez and K. Withers, Eds.) Texas A&M University Press, College Station, USA, 126-142.
Jiménez-Badillo L., 2007. Management challenges of small-scale fishing communities in a
protected reef system of Veracruz, Gulf of México. Fisheries Manag. Ecol. DOI:
10.1111/j.1365-2400.2007.00565.x.
Monreal-Gómez A., D. A. Salas-de-León, H. Velasco-Mendoza, 2004. La hidrodinámica del Golfo
de México. In: Diagnóstico Ambiental del Golfo de México (M. Caso, I. Pisanty and E. Ezcurra,
Eds.) INE-SEMARNAT, México 1, 47-69.
Pereyra D., B. Palma and I. Zitacuro, 1992. Correlation between northers of Gulf of México and
frost at Las Vigas, Veracruz, México. Atmósfera5,109-118.
Salas-Pérez J. J., J. M. Vargas-Hernández, V. Arenas-Fuentes and P. Balderas-Cruz, 2007a. Trayectoria de masas de agua en el Parque Nacional Sistema Arrecifal Veracruzano y modelos
numéricos: Circulación de verano. In: Investigaciones científicas en el sistema arrecifal
Veracruzano (A. Granados-Barba, L.G. Abarca-Arenas and J. M. Vargas-Hernández, Eds.) UV-Promep-Epomex. México. 17-26.
Salas-Pérez J. J., V. Arenas-Fuentes, 2007b. Hydrographic conditions in the Veracruz Reef
System (Western Gulf of México). EOS Trans. AGU, 88 (23). Joint Assem. Suppl. Abstract
OS23B-13.
Salas-Pérez J. J., D.Salas-Monreal, V.Arenas-Fuentes, D. Salas de León and M.Riverón-Enzástiga,
2008.Tidal characteristics at the Veracruz Reef System (Western Gulf of México). Cienc. Mar.
34, 467-478.
Salas-Pérez J. J. and A. Granados-Barba, 2008. Oceanographic characterization of the Veracruz
reef system. Atmósfera21, 281-301.
Salas-Monreal D., D. A. Salas-de-León, M. A. Monreal-Gómez, M. L. Riverón-Enzastiga, 2009.
Current rectification in a tropical coral reef system. Coral Reefs. DOI:
10.1007/s00338-009-0521-9.
Tunnell J. W. Jr., 1992. Natural versus human impacts to southern Gulf of México coral reef
resources. Proceedings 7th International Coral Reef Symposium Guam. 1, 300-306.
Tunnell J. W. Jr., E. A. Chávez, K. Withers, 2007. Coral reefs of the Southern Gulf of México. Texas A&M University Press. USA, 216 pp.
Vázquez de la Cerda A., 1983. Corrientes marinas en las cercanías al Puerto de Veracruz. Reporte técnico, DGOM, Secretaría de Marina, México, 20 pp.
Vidal V. M., F. V. Vidal, A. Fernández, E. Meza and L. Zambrano, 1994. Winter water mass
distributions in the Western Gulf of México affected by a colliding anticyclonic ring. J. Oceanogr.
Res. 50, 559-588.
Withers K. and J. W. Jr. Tunnell, 2007. Reef biodiversity. In: Coral reefs of the southern Gulf of
Mexico (J.W. Tunnell Jr., E.A. Chávez and K. Withers, Eds.) Texas A&M University Press, College Station, USA, 68-87.
Zavala-Hidalgo J., S. L. Morey and J. J. O’Brien, 2003. Seasonal circulation on the western shelf