1
Degree of roasting of carob flour affecting the properties of
gluten-free cakes and cookies
Laura Román, Ana González, Teresa Espina, Manuel Gómez
*Food Technology Area. College of Agricultural Engineering. University of Valladolid, 34004 Palencia, Spain.
Tel: +34 979108495; fax +34 979-108302
*
Corresponding author e-mail: pallares@iaf.uva.es
Abstract
Carob flour is a product rich in fibre obtained from by-products of the locust bean gum extraction processing. The flour is commercialised with different degrees of roasting in order to improve its organoleptic characteristics. In this study, carob flour with three different roasting degrees was used to replace rice flour (15%) in gluten-free cakes and cookies. The influence of this replacement was studied on the psychochemical characteristics and acceptability of the final products. The incorporation of carob flour increased the viscosity of cake batters and increased the solid elastic-like behaviour of the cookie doughs, indicating a stronger interaction among the formula ingredients. The inclusion of carob flour, with a low time of roasting, did not lead to any significant differences in the specific volume and hardness of the cakes, but reduced cake staling and the thickness and width of the cookies. Darker colours were obtained when carob flour was incorporated into the product. The acceptability of cakes was only reduced with the addition of highly roasted carob flour, while in the case of cookies there was a decline in the acceptability of all carob flour cookies, which was mostly perceived with the highest roasting degree, something mainly attributed to the bitter taste of the products.
2
1. Introduction
The carob tree (Ceratonia siliqua L.) is a leguminous tree widely grown in some zones of Mediterranean region, whose seeds, and more specifically whose endosperm, is used to extract locust bean gum or carob gum. In the process in which such gum is produced, several by-products are also obtained. The germ recovered as a by-product of the seed processing is mainly used, in form of flour, as a supplement in dietetic food or in cereal based products (Dakia et al. 2007). Flours are also obtained from the seedless pod, referred to as carob flours, which have traditionally been used as substitutes for chocolate or cocoa (Fadel et al. 2006).
From a nutritional perspective, carob flour presents a low content of lipid (0.65%) and protein (4.62%) and a high content of carbohydrates (88.88%), among which sugars (49.08%) and fibres (39.80%) stand out (USDA 2015). With regard to sugars, it contains mostly sucrose and glucose with lesser amounts of fructose, while the minerals especially abundant are potassium and calcium as well as significant amounts of iron, manganese and zinc (Ayaz et al. 2009). This flour also presents high quantities of phenolic compounds, highlighting its level of proanthocyanidins and catechins, which give rise to a great antioxidant capacity (Kumazawa et al. 2002). In fact, the carob fibre can be used to minimize the lipid oxidation in cookies; in a similar way that tocopherol does (Haber 2002). Several studies have also reported a cholesterol attenuation activity of this carob fibre (Ruiz-Roso et al. 2010; Zunft et al. 2003), an anti-atherosclerotic effect of carob pod insoluble fibre in rabbits (Valero-Muñoz et al. 2014) and even a carob pod treatment for acute-onset diarrhea has been proposed (Loeb et al. 1989). Added to that, carob is also rich in D-pinitol, a compound that can lower blood glucose and has anti-inflammatory effects (Tetik et al. 2011).
For carob pod processing it is common to roast the kibbled carob before being milled. For this purpose carob kibbles are treated at temperatures between 120 and 180 ºC, typically 150 ºC for times ranging from 10 to 60 minutes, in order to obtain several degrees of roasting (low, medium and high roasted). During roasting, certain reactions such as sugar caramelisation and Maillard reaction take place, affecting the quality of the flour (Yousif and Alghzawi 2000). Thus, as the roasting time of the carob flour is increased, a rise in the level of total polyphenols, the antioxidant capacity and the browning index as well as a slightly decrease in the pH value are produced (Sahin et al. 2009). However, the presence of some compounds of the Maillard reaction well known for their toxic effects, such as furfural or hydroxymethyl-furaldehyde (5-hydroxymethyl-2-furaldehyde; HMF) is increased in the flours subjected to longer roasting times (Cepo et al. 2014). Roasting also modifies the volatile fraction of the carob flour, reducing the percentage of acids, alcohols and aldehydes and increasing the level of furans, pyrroles and esters. This leads to an enhancement of the aroma of the flour making it more similar to chocolate or cocoa (Cantalejo 1997).
3 inclusion modified the rheology of the dough being advisable to increase the water content of the dough as carob flour was incorporated (Tsatsaragkou et al. 2014). It has also been proposed to include carob flour to reduce the glycemic index of cookies (Vujic et al. 2014). However there are no studies on the influence of the addition of carob flour on the organoleptic quality of cakes or cookies, or on how the degree of roasting affects the properties of these baked products. Cakes and cookies are suitable foods for the inclusion of by-products as some of their ingredients, such as fats, sugars, eggs and dairy products can help mask odd flavors. In fact there are numerous studies on the integration of various by-products from the food industry in cakes (Rupasinghe et al. 2008; Sudha et al. 2007) and cookies (Mildner-Szkudlarz et al. 2013; Sangeetha et al., 2011).
Thus, the aim of this study was (a) to analyse how the inclusion of carob flour with different roasting degrees influences the physicochemical quality and acceptability of cakes and cookies, and also (b) to study the rheological and textural properties of the cake batter and cookie dough in relation to the final product sensory attributes.
2. Materials and methods
2.1 Materials
Commercial rice flour (8.98% protein, 75.32% starch, 22.43% amylose, 12.13% moisture and 0.59% ashes) was supplied by Harinera Castellana (Medina del Campo, Spain). Rice flour was obtained from japonica type varieties milled in roll mills and sieved to obtain a particle size less than 132 µm. Carob flours were supplied by G.A. Torres (Valencia, Spain), S.L. Carochoc 3 (short time, ST), carochoc 4.5 (medium time, MT) and carochoc 6 (long time, LT) were used. All the flours were roasted at 100ºC during 60, 75 and 90 min, respectively. Simple sugar (glucose, fructose and sucrose) and fibre and protein content of the carob flours were; ST, 38.14%, 18.90%, 4.87%; MT, 25.54%, 44.51%, 5.2%; LT, 14.59%, 52,96%, 5.04% respectively (data supplied by the manufacturer). The colour (L*; chroma; hue) of the rice and carob flours was: rice flours (75.13; 5.79; 270.05), ST (56.98; 13.79; 57.83), MT (50.54; 9.57; 50.50), LT (49.82; 8.04; 51.54). Hydration and pasting properties of rice flour and rice/carob flours (85/15) mixtures are shown in table 1.
White sugar, UHT medium skimmed liquid milk, refined sunflower oil, liquid pasteurized egg, and sodium bicarbonate were purchased from the local market. Baking powder “25 × 1” and margarine “Argenta crema” (Puratos, Girona, Spain) and sodium bicarbonate (Manuel Riesgo S.A., Madrid, Spain) were also used.
2.2 Methods
2.2.1 Flour characteristics
4 retained by the sample after it has been centrifuged, was measured as described in AACC method 56-30.01 (AACC International 2012). Hydration properties were analysed in duplicate. The Rapid ViscoTM Analyser (RVA) (Newport Scientific Pty Ltd, Australia) was used to determine the pasting properties of the rice flours and mixtures of rice and carob flours. Pasting properties were determined following the pasting method 61.02.01 (AACC International 2012). The heating cycle was 50 ºC to 95 ºC in 282 s, holding at 95 ºC for 150 s and then cooling to 50 ºC. Each cycle was initiated by a 10-second mixing at 960 rpm paddle speed, and a 160 rpm paddle speed was used for the rest of the test. The RVA studies were carried out using 3.0 g of sample and 25 ml water in an aluminium canister. Flour samples were run in duplicate.
2.2.2 Cake and cookie making 2.2.2.1 Cake making
The layer cake had the following formulation: flour (30 g/100 g), sugar (27 g/100 g), UHT medium skimmed liquid milk (18 g/100 g), liquid pasteurized egg (15 g/100 g), sunflower oil (9 g/100 g), and baking powder (0.9 g/100 g). When used, carob flours substituted rice flour in 15%.Layer cakes were made with a single-bowl mixing procedure. All ingredients were mixed for 1 min at speed 4, and 9 min at speed 6 using a Kitchen-Aid Professional mixer; KPM5 (KitchenAid, St. Joseph, Michigan, USA). Then, 180 grams of cake batter were placed into baking aluminium pans (109×159×38 mm) and baked at 190°C for 25 min in a preheated electric oven (Salva, Lezo, Spain). After baking, cakes were left to cool for 60 min at room temperature. Then, they were removed from the pans and were packaged in polyethylene bags and finally stored at 20°C until further analyses.
2.2.2.2 Cookie making
All cookies were prepared using the same amount of ingredients except for water, which was added to adjust dough moisture content to 15.0%. The following ingredients (as g/100 g on dough basis) were used: flour (43.3 g/100 g), sugar (31.2 g/100g), margarine (19.4 g/100g), water (5.2 g/100g) and sodium bicarbonate (0.9 g/100 g). When used, carob flours substituted rice flour in 15%. The margarine was heated in the microwave for 1 minute at 1000 watts of power. The margarine and sugar were then creamed at speed 4 for 180 s in a Kitchen Aid 5KPM50 mixer (Kitchen Aid, Michigan, USA) with a flat beater, scraping down every 60 s. The water was then added and mixing was continued at speed 4 for 120 s with intermediate scraping. At the end of the mixing process, the cream was scraped down. Finally, flour and sodium bicarbonate were added, followed by mixing at speed 2 for 120 s, scraping down every 30 s. After mixing, the dough was allowed to stand for a predefined period of 30 minutes. The dough pieces were then laminated with a salva L-500-J sheeter (Salva, Lezo, Spain) (gap width 6.00 mm). Cookie dough was cut with a circular cookie cutter (internal diameter, 40 mm) and weighed. Batches of at least 15 dough pieces were baked in an electric modular oven for 14 minutes at 185ºC. All the cookie elaborations were performed twice. The cookies were packaged in polyethylene bags and finally stored at 20°C until further analyses.
5 Cake batter density was determined in duplicate as the ratio of the weight of a standard container (100 mL) filled with batter to that of the same container filled with water (density, 1 g/cm3). Batter viscosity was measured with a Rapid Visco® Analyser (Newport Scientific Pty Ltd., Warriewood, Australia). A batter sample (25g) was used for viscosity analysis for 5 minutes at a constant speed of 160 rpm at a temperature of 30ºC.
A drop of batter approximately 2 g in mass was placed on a microscope slide. The sample was covered with another microscope slide, taking care to make sure air bubbles were not captured. Two paperclips were used to press the slides together, thus creating a layer of batter of constant thickness between the slides. Batter samples were imaged using a Leica DM750 microscope (Leica Microsystems, Heerbrugg, Switzerland) with 40 × magnification. A Leica EC3 camera was mounted on the microscope, providing digitised images using LAS EZ V1.7.0 for Windows (Leica Application Suite) software (Leica Microsystems, Heerbrugg, Switzerland).
2.2.3.2 Dough rheology
The rheological behaviour of doughs was studied using a Thermo Scientific Haake RheoStress1 controlled strain rheometer (Thermo Fisher Scientific, Schwerte, Germany) and a Phoenix II P1-C25P water bath (Thermo Fisher Scientific, Schwerte, Germany), which controlled the analysis temperature (set at 25 ºC). The rheometer was equipped with parallel-plate geometry (60 mm diameter titanium serrated plate-PP60 Ti) with 1 mm gap. The batter was rested for 300 s before measuring. The samples were analysed in duplicate. First, a strain sweep test was performed at 25 ºC with a strain range of 0.1 to 20 Pa and a constant frequency of 1 Hz to identify the linear viscoelastic region. On the basis of the results obtained, a strain value included in the linear viscoelastic region was used in a frequency sweep test at 25 ºC with a frequency range of 0.1 to 10 Hz. Values of the complex modulus (G*[Pa]), elastic modulus (G′[Pa]), viscous modulus (G″[Pa]), and loss factor (tan δ) were obtained for different frequency values (ω [Hz]).
2.2.4 Cake and cookie characteristics 2.2.4.1 Cake characteristics
The cake volume was determined using a laser sensor with a BVM-L 370 volume analyser (TexVol Instruments, Viken, Sweden). Cake-specific volume was calculated as the ratio between the cake volume and weight. Baking loss (%) was calculated as the difference between the weight of the cake before and after the baking process. Measurements were made in duplicate.
6 determine cake staling, hardness was also determined after 7 days of storage in plastic bags at 20 °C, and the difference in hardness (ΔHardness) was determined between days 1 and 7.
2.2.4.2 Cookie characteristics
Sixty minutes after baking, four cookies were weighed and their widths (diameter) and thicknesses (height) were measured to calculate the spread factor. The diameter of each cookie was measured twice, perpendicularly, in order to calculate an average diameter. The spread factor of the cookies was calculated by dividing the average width (W) by the thickness (T) of the cookies.
The texture of the cookies was measured sixty minutes after baking eight cookies from each elaboration, using a TA-XT2 texture analyser (Stable Microsystems, Surrey, UK) fitted with the “Texture Expert” software. The cookies were broken up using the three point bending rig probe (HDP/3PB). The experimental conditions were: supports 30 mm apart, a 20 mm probe travel distance, a trigger force of 5 g and a test speed of 2.0 mm/s. The maximum force (N) and the displacement at rupture (mm) were measured.
2.2.4.3 Cake and cookie colour
Colour was measured using a Minolta CN-508i spectrophotometer (Minolta Co., Ltd, Japan) with the D65 standard illuminant and the 2º standard observer; the results were expressed in the CIE L*a*b* colour space. Cake colour measurements were made of crust and two slices of crumb. Crust cake colour was checked at two different points on each cake and crumb cake colour was checked at two points on each slice. Each point was measured five times and the measurements were made on two cakes from each batch. Cookie colour measurements were made at the centre of the upper surface (crust) of four sugar-snap cookies from each elaboration. 2.2.5. Consumer test
Hedonic sensory evaluation of the cookies and cakes was conducted with 100 volunteers, between the ages of 16–66 and of various socioeconomic backgrounds, who were habitual cookie and cake consumers. Samples were analysed one day after baking. For sensory evaluation, samples were presented on white plastic dishes coded with four-digit random numbers and served in random order. The cookies and cakes were evaluated on the basis of the acceptability of their appearance, odour, texture, taste and overall acceptability on a nine-point hedonic scale. The scale of values ranged from “extremely like” to “extremely dislike”, corresponding to the highest and lowest scores of “9” and “1” respectively. Cookies were presented as whole pieces. For cakes sensory evaluation, one cake was presented as half-pieces for appearance evaluation and the rest were divided into 2 cm width portions.
2.2.6 Statistical analyses
7
3. Results and Discussion
3.1 Cake properties
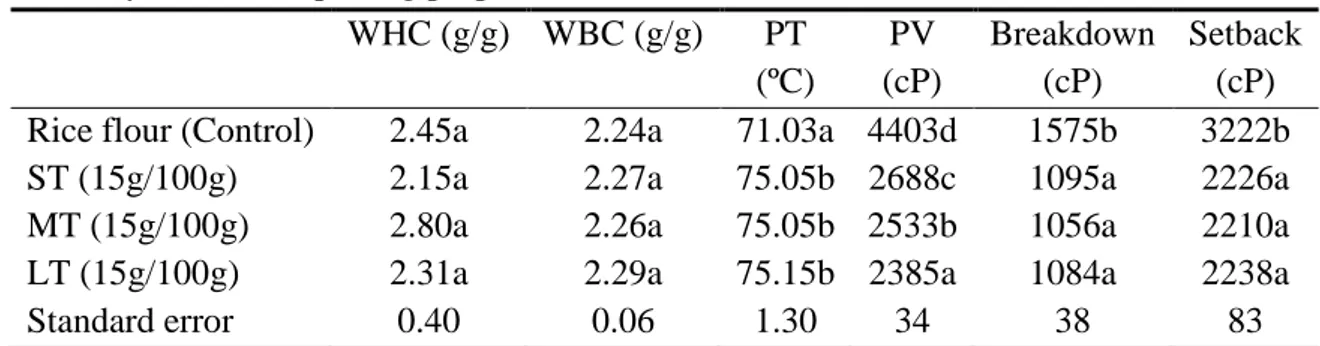
As shown in table 3, the inclusion of carob flour hardly influenced the specific volume of gluten-free cakes, since only the cake which included carob flour with a higher roasting time showed significant differences compared with the control sample, with a slightly lower volume. The inclusion of carob flour increased the pasting temperature (Table 1) with no differences in the roasting time. This increase could enhance the expansion during baking. However, this increase did not foster an increase in the volume of the cakes made with carob flour. Carob flour also decreased the peak viscosity as the roasting time was increased, which could be related to the less amount of starch present in the mixtures with carob flour.
Batter viscosity is an important parameter because a certain viscosity is needed to stabilize the bubbles presented within the batter, but neither an excessive viscosity is good owing to the fact that it would prevent the bubbles expansion (Stauffer 1990). As shown in Table 2, the viscosity of batters increased with the addition of carob flour, and this increase was greater as the time of roasting was reduced. This trend could be related to the higher sugar content found in carob flour, especially in those flours less roasted (see sugar content in section 2.1), since it is known that sucrose enhances the viscosity of the starch pastes (Martínez et al. 2015). However these differences do not explain the differences in the specific volume of the cakes, and all batters can be considered within an appropriate range of viscosities. There is also a clear difference in the density values of batters shown in Table 2, where the cake enriched with the long time roasted carob flour was significantly denser. The higher the density is, the less amount of air that is incorporated into the batter, and this worse batter aeration may explain the differences in the specific volume of cakes. The less air incorporation in LT batters could lead to a minor expansion of the air bubbles during baking, decreasing the specific volume.
Another factor that may influence the expansion of the cakes is the distribution of air bubbles in the batter, with smaller and more uniform bubbles being preferred because they limit the coalescence phenomena and are better retained within the batter during baking (Román et al. 2015; Stauffer 1990). Figure 1 shows that the batters obtained with LT flour also presented bigger bubbles, which are less stable during baking, and can give rise to a less specific volume in this type of cakes.
8 material), a crumb with a finer and more closed grain was noticed as the roasting degree of the carob flour was increased, something that could also be synonymous with the harder texture of those cakes.
Regarding staling, no great differences were visible in the increase of hardness with the time of storage between the different roasting degrees. However, control samples significantly presented the highest value for this parameter which can be related to the greater starch content in rice flour compared with carob flour, which would foster an increase in retrogradation of starch components during storage. Actually, control flour presented the highest setback, and then, retrogradation tendency in RVA results (Table 1). For the rest of the textural parameters, no significant differences were found for the cohesiveness of the different crumbs. Meanwhile, a decrease in springiness was shown with the inclusion of carob flour, but this was only significant in the carob cakes with a higher roasting time (MT and LT), which can also be down to a more compact structure (Román et al. 2015).
3.2 Cookie properties
9 medium time roasted were visible. It is also observed that the width of the cookies was greater as the time of roasting was increased, with no differences in thickness or in the spread ratio. These differences may be related to the reduction of the sugar content and the increase in fibre levels that occurs during roasting due to Maillard reactions and caramelisation of sugars (Sahin et al. 2009). Actually, these statements are in agreement with the results reported in section 2.1, where a rise in fibre content and a decrease in sugar content was noted as time of roasting was increased. It is also observed that although in all cases the weight of cookies is higher, in the case of those samples made with carob flour, only significant differences between control and cookies with LT carob flour were observed. This lower weight loss during baking may be due to the lower exchange surface with the outside of the cookies with carob flour, due to its lower thickness and width. It could also be related to the high sugar and especially higher fibre content of these cookies, as both ingredients contribute to water retention in cookies (Pareyt and Delcour 2008), but no differences were found between the water holding and binding capacity of the rice flour and the mixtures of rice and carob flour (Table 1). Nevertheless, it is noteworthy considering that those analyses were carried out without heating the mixtures of flour and water. Regarding the hardness, control cookie made with rice flour was found to be less hard than those made with carob flour, reflecting a more compact structure of the cookies made with carob flour.
3.3 Cake and cookie colour
The major differences between products made with carob flour and the control were regarding their colour, as results in Table 4 as well as the images in supplementary material highlighted. In all cases (cookies and crust and crumb of cakes), the products made with carob flour showed a lower luminosity than control, and therefore darker colours, with no significant differences between them. Chroma values, which indicate that the colour intensity of carob flour products, are also lower than the control in all samples, and therefore they tend to more greyish colours. However, while in the cake crusts no differences were found between the roasting degrees of the flour, in the crumb of the cakes and in the cookies a decrease in the values of chroma was noticed as the roasting degree was increased, without significant differences between the products made with the less roasted carob flour (ST and MT) being observed. As regards to the hue values, values close to 90 correspond to yellowish colours, while values close to 45 indicate reddish tones, when these values are reduced (to 0, and then between 360 and 315), more violet tones are perceived. The crumb of the control cake displayed hue values very close to the yellow tones, while the crust of the control cake and control cookie mainly presented slightly more orange tones. The products with carob flour had hues between red and violet, which are closer to red when the roasting degree is lower.
10 Meanwhile, in the outer part of the cakes and cookies temperatures above 150°C are reached and therefore Maillard reactions and caramelisation of sugars are produced, contributing to the final colour (Purlis 2010), and aroma (Pico et al. 2015) of the products, together with the effect of the colour of the flour used.
3.4 Cake and cookie acceptability
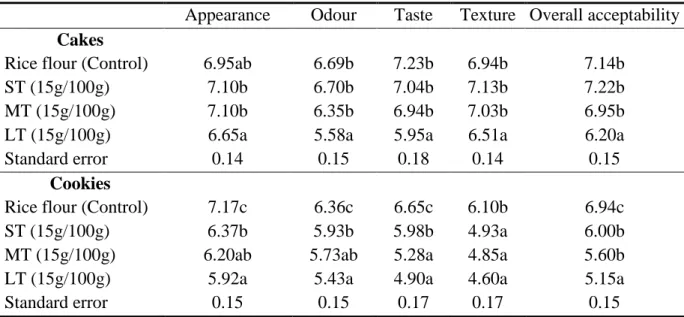
In Table 5 the results for the sensory analysis of biscuits and cookies are displayed. For the cakes, there were no great differences in any of the parameters studied between the control cake and the cakes which incorporated ST or MT carob flour, despite the clear differences in aspects such as colour or flavour. Meanwhile, the cake made with highly roasted carob flour reached lower scores. Taking into account consumer observations, LT cake was considered overly dark and with a bitter taste. It is known that as the degree of roasting is increased the content in phenolic compounds and particularly in furans and pyrrols is increased, partly down to Maillard reactions (Cantalejo 1997; Cepo et al. 2014; Sahin et al. 2009). Even though those compounds can look alike, to a certain extent, the flavour of other roasted products such as chocolate or cacao, and excess of these compounds can give rise to bitter tastes in those products. Added to that, the caramelisation of sugars, which occurs at high temperatures, also tends to generate bitter and even astringent compounds (Pico et al. 2015). The worse score in texture for LT cake could be motivated by the increased hardness of the cake as it expanded less during baking. Regarding cookies, the best assessed one was the control sample. The biggest differences between control and carob flour cookies were obtained for texture, with no differences between the roasting degree of the flour. These differences can be explained by the greater hardness observed in the cookies with carob flour, whereas no differences between carob flour mixtures were observed.
11
4. Conclusion
It is possible to incorporate carob flour at levels of 15% in the formulation of gluten-free cookies and cakes with minimal changes in the rheological properties of their doughs and batters and in their physical characteristics such as specific volume or shape and texture. However, this addition strongly affected the colour and flavour of these products being low degree roasted carob flour preferable compared to the carob flours highly roasted in order to minimize those differences. In this way, further studies would focus on the nutritional improvement of these gluten-free products, but only bearing in mind STand MT carob flours as the acceptability was greatly reduced when using LT flours.
Acknowledgements
The authors acknowledge the financial support of the Spanish Ministry of Economy and Competitiveness (Project AGL2014-52928-C2) and the European Regional Development Fund (FEDER). The authors are also grateful to Harinera Castellana and G.A. Torres for supplying the raw materials. They also would like to thank Montserrat Prieto for her assistance whilst carrying out product analyses.
References
AACC International. (2012) Approved methods of the American Association of Cereal Chemists International. American Association of Cereal Chemists, St Paul, MN.
Ayaz FA, Torun H, Glew RH, Bak ZD, Chuang LT, Presley JM, Andrews R (2009) Nutrient content of carob pod (Ceratonia siliqua L.) flour prepared commercially and domestically. Plant Foods Hum Nutr 64:286-292.
Barak S, Mudgil D, Khatkar BS (2014) Effect of flour particle size and damaged starch on the quality of cookies. J Food Sci Technol 5:1342-1348.
Barrera GN, Perez GT, Ribotta PD, Leon AE (2007) Influence of damaged starch on cookie and bread-making quality. Eur Food Res Technol 225:1-7.
Cantalejo MJ (1997) Effects of roasting temperature on the aroma components of carob (Ceratonia siliqua L.). J Agr Food Chem 45:1345-1350.
Cepo DV, Mornar A, Nigovic B, Kremer D, Radanovic D, Dragojevic IV (2014) Optimization of roasting conditions as an useful approach for increasing antioxidant activity of carob powder. LWT-Food Sci Technol 58:578-586.
Dakia PA, Wathelet B, Paquot M (2007) Isolation and chemical evaluation of carob (Ceratonia siliqua L.) seed germ. Food Chem 102:1368-1374.
Durazzo A, Turfani V, Narducci V, Azzini E, Maiani G, Carcea M (2014) Nutritional characterisation and bioactive components of commercial carobs flours. Food Chem 153:109-113.
Fadel HHM, Mageed MAA, Samad AKMEA, Lotfy SN (2006) Cocoa substitute: Evaluation of sensory qualities and flavour stability. Eur Food Res Technol 223:125-131.
Gómez M, Ruiz-Paris E, Oliete B, Pando V (2010) Modelling of texture evolution of cakes during storage. J Texture Stud 41:17-33.
12 Kumazawa S, Taniguchi M, Suzuki Y, Shimura M, Kwon MS, Nakayama TJ (2002) Antioxidant activity of polyphenols in carob pods. J Agr Food Chem 50:373-377.
Laguna L, Sanz T, Sahi S, Fiszman SM (2014) Role of fibre morphology in some quality features of fibre-enriched biscuits. Int J Food Prop 17:163-178.
Loeb H, Vandenplas Y, Wursch P, Guesry P (1989) Tannin-rich carob pod for the treatment of acute-onset diarrhea. J Pediatr Gastroenterol Nutr 8:480-485.
Martínez MM, Pico J, Gómez M (2015) Effect of different polyols on wheat and maize starches paste and gel properties. Food Hydrocoll 44:81-85.
Mildner-Szkudlarz S, Bajerska J, Zawirska-Wojtasiak R, Gorecka D (2013) White grape pomace as a source of dietary fibre and polyphenols and its effect on physical and nutraceutical characteristics of wheat biscuits. J Sci Food Agr 93:389-395.
Miller RA, Hoseney RC (1997) Factors in hard wheat flour responsible for reduced cookie spread. Cereal Chem 74:330-336.
Pareyt B, Decour JA (2008) The role of wheat flour constituents, sugar, and fat in low moisture cereal based products: a review on sugar-snap cookies. Crit Rev Food Sci Nutr 48:824-839. Pico J, Bernal J, Gómez M (2015) Wheat bread aroma compounds in crumb and crust: A review. Food Res Int 75:200-215.
Purlis E (2010) Browning development in bakery products - a review. J Food Eng 99:239-249. Román L, Santos I, Martínez MM, Gómez M (2015) Effect of extruded wheat flour as a fat replacer on batter characteristics and cake quality. J Food Sci Technol 52:8188-8195.
Ruiz-Roso B, Quintela JC, de la Fuente E, Haya J, Perez-Olleros L (2010) Insoluble carob fiber rich in polyphenols lowers total and LDL cholesterol in hypercholesterolemic sujects. Plant Foods Hum Nutr 65:50-56.
Rupasinghe HPV, Wang L, Huber GM, Pitts NL (2008) Effect of baking on dietary fibre and phenolics of muffins incorporated with apple skin powder. Food Chem 107:1217-1224.
Sahin H, Topuz A, Pischetsrieder M, Ozdemir F (2009) Effect of roasting process on phenolic, antioxidant and browning properties of carob flour. Eur Food Res Technol 230:155-161.
Sangeetha AV, Mahadevamma S, Begum K, Sudha ML (2011) Influence of processed sugarcane bagasse on the microbial, nutritional, rheological and quality characteristics of biscuits. Int J Food Sci Nutr 62:457-464.
Seczyk L, Swieca M, Gawlik-Dziki U (2016) Effect of carob (Ceratonia siliqua L.) flour on the antioxidant potential, nutritional quality, and sensory characteristics of fortified durum wheat pasta. Food Chem 194:637-642.
Stauffer CE (1990) Functional additives for bakery foods. Van Nostrand Reinhold, New York. Sudha, M.L., Baskaran, V. and Leelavathi, K. (2007) Apple pomace as a source of dietary fiber and polyphenols and its effect on the rheological characteristics and cake making. Food Chem 104:686-692.
13 Tetik N, Turhan I, Oziyci HR, Karhan M (2011) Determination of D-pinitol in carob syrup. Int J Food Sci Nutr 62:572-576.
USDA (2015) USDA National Nutrient Database for Standard Reference, Release 28. Version Current: September 2015. Internet: http://www.ars.usda.gov/ba/bhnrc/ndl. Accessed 26 March 2016.
Valero-Muñoz M, Martin-Fernandez B, Ballesteros S, Lahera V, de las Heras N (2014) Carob pod insoluble fiber exerts anti-atherosclerotic effects in rabbits through sirtuin-1 and peroxisome proliferator-activated receptor-gamma coactivator-1 alpha. J Nutr 144:1378-1384.
Vujic L, Cepo DV, Sebecic B, Dragojevic IV (2014) Effects of pseudocereals, legumes and inulin addition on selected nutritional properties and glycemic index of whole grain wheat-based biscuits. J Food Nutr Res 53:152-161.
Yousif AK, Alghzawi HM (2000) Processing and characterization of carob powder. Food Chem 69:283-287.
Zhou W, Therdthai N (2008) Heat and mass transfer during baking of sweet goods. In Sumnu SG, Sahin S (ed) Food engineering aspects of baking sweet goods. CRC, Boca Raton, pp 173-190.
14
Tables
Table 1. Hydration and pasting properties of rice flour and mixtures of rice /carob flours
WHC (g/g) WBC (g/g) PT (ºC)
PV (cP)
Breakdown (cP)
Setback (cP) Rice flour (Control) 2.45a 2.24a 71.03a 4403d 1575b 3222b
ST (15g/100g) 2.15a 2.27a 75.05b 2688c 1095a 2226a
MT (15g/100g) 2.80a 2.26a 75.05b 2533b 1056a 2210a
LT (15g/100g) 2.31a 2.29a 75.15b 2385a 1084a 2238a
Standard error 0.40 0.06 1.30 34 38 83
15
Table 2. Effect of carob flour addition on the characteristics of batters and cakes
Batter measurements Cake characteristics
Viscosity (cP)
Density (g/cm3)
Specific volume (ml/g)
Weight loss (g/100g)
Hardness
(N) Springiness Cohesiviness ∆ Hardness
Rice flour (Control) 2409a 0.28a 2.25b 10.43ab 4.62ab 0.81c 0.50a 0.72b
ST (15g/100g) 3049d 0.27a 2.22b 11.36b 3.98a 0.78bc 0.44a 0.58a
MT (15g/100g) 2926c 0.27a 2.23b 10.76ab 4.43ab 0.72a 0.46a 0.48a
LT (15g/100g) 2616b 0.30b 2.05a 9.81a 6.20b 0.75ab 0.51a 0.38a
Standard error 21.91 0.01 0.54 0.29 0.54 0.01 0.02 0.08
Different letters in the same column mean significantly different (p≤0.05). ST= short time roasted, MT= medium time roasted, LT= long time roasted
Table 3. Effect of carob flour addition on the characteristics of doughs and cookies
Dough measurements Cookie characteristics
G´(Pa)* G´´(Pa) G*(Pa)* tan Thickness (mm)
Width (mm)
Spread Weight (g)
Hardness (N)
Distance (mm) Rice flour
(Control)
1.50a 35750a 1.54a 0.244b 10.1b 45.51c 4.51a 7.86a 34.78a 0.50a ST (15g/100g) 1.48a 33100a 1.51a 0.225a 8.88a 43.26a 4.88ab 8.17ab 54.82b 0.45a MT (15g/100g) 1.46a 33200a 1.51a 0.228a 8.78a 43.77ab 4.99b 8.21ab 48.98b 0.44a LT (15g/100g) 1.49a 33500a 1.53a 0.225a 9.15a 44.38b 4.86ab 8.71b 61.25b 0.55a
Standard error 0.10 1944 0.10 0.005 0.16 0.25 0.10 0.17 8.28 0.08
Different letters in the same column mean significantly different (p≤0.05). Spread (width/thickness). Distance: displacement at rupture (mm). ST= short time roasted, MT= medium time roasted, LT= long time roasted
16
Table 4: Effect of carob flour addition on the colour of cakes and cookies
Cake crust Cake crumb Cookie
L* Hue Chroma L* Hue Chroma L* Hue Chroma
Rice flour (Control) 61.71b 69.72b 29.64b 71.75b 85.39c 15.84d 67.17b 79.23b 16.79c ST (15g/100g) 37.22a 7.40a 9.74a 41.00a 26.64b 12.03c 42.11a 11.65a 8.67b MT (15g/100g) 35.81a 357.54c 7.89a 38.00a 10.51a 9.03b 39.41a 349.21d 7.10a LT (15g/100g) 32.23a 326.26d 7.61a 35.37a 351.59d 7.09a 38.96a 339.62c 6.67a
Standard error 2.06 2.27 0.73 1.73 1.50 0.26 1.05 1.92 0.23
Different letters in the same column mean significantly different each other (p≤0.05). ST= short time roasted, MT= medium time roasted, LT= long time roasted
Table 5: Effect of carob flour addition on the organoleptic acceptability of cakes and cookies
Appearance Odour Taste Texture Overall acceptability
Cakes
Rice flour (Control) 6.95ab 6.69b 7.23b 6.94b 7.14b
ST (15g/100g) 7.10b 6.70b 7.04b 7.13b 7.22b
MT (15g/100g) 7.10b 6.35b 6.94b 7.03b 6.95b
LT (15g/100g) 6.65a 5.58a 5.95a 6.51a 6.20a
Standard error 0.14 0.15 0.18 0.14 0.15
Cookies
Rice flour (Control) 7.17c 6.36c 6.65c 6.10b 6.94c
ST (15g/100g) 6.37b 5.93b 5.98b 4.93a 6.00b
MT (15g/100g) 6.20ab 5.73ab 5.28a 4.85a 5.60b
LT (15g/100g) 5.92a 5.43a 4.90a 4.60a 5.15a
Standard error 0.15 0.15 0.17 0.17 0.15
17
Figure caption
18 Supplementary material 1. Cake photographs. A) Rice flour; B) 15g/100g of short time roasted carob flour; C) 15g/100g of medium time roasted carob flour; D) 15g/100g of long time roasted carob flour