Design and Evaluation of a Renewable Water Pumping System
Imene Yahyaoui Dept. Systems Eng and
Automatic Industrial Eng School Univ. Valladolid, Spain
imene@autom.uva.es
Giuseppe Tina Dept. Electric, Electronic and Computer
Univ. Catania, Italy Giuseppe.tina@dieei.uni
ct.it
Maher Chaabene Dept. Electric Eng National Eng School
Univ. Sfax, Tunisia maherchaabane@yahoo.
com
Fernando Tadeo Dept. Systems Eng and
Automatic Industrial Eng School Univ. Valladolid, Spain fernando@autom.uva.es
Abstract: The design and evaluation of a stand-alone photovoltaic system for well pumping in agricultural application is presented. Given environmental (irradiance and ambient temperature), system (PV and battery technology, array geometry) and load (monthly daily demand) data, the optimal size of main components of PV systems are obtained by a sizing algorithm; specifically the output are: the surface of PV array and the battery pack capacity. The decision is made based on the estimated power generation, the required power for the load, the water needed by the crops and the battery requirements. The proposed design is then evaluated using yearly simulations, on hourly base, performed by a specialized commercial software, named PVSyst, to show that the proposed optimal size ensures also a high reliability evaluated by two indices: number of autonomous days (NAD) and Loss of Load Probability (LOLP).
Keywords: photovoltaic panels; algorithm; sizing; pumping; PVSyst.
INTRODUCTION
The main components of a stand-alone photovoltaic (PV) system, that supplies a given load are: a PV array, a battery pack, an MPPT/ charge regulator. The MPPT/charge regulator must be used to operate correctly with both PV modules and batteries. This appliance performs not only the charge and discharge of the batteries in order to avoid damage or poor energy performance but also the maximum power point tracking (MPPT) in such a way to have an efficient PV conversion.
Sizing the components of these PV installations affect their autonomy and cost [1, 2]. Hence, it is necessary to fix during the design adequate values for the components sizes, such as the photovoltaic panel surface and the battery capacity [3, 4]. In fact, for agricultural applications, during the crops vegetative cycle, the photovoltaic installation size selected must guarantee the water volume needed for the crops irrigation, the system autonomy and the battery bank safe operating [3]. Indeed, knowing the water volume needed for irrigating the crops, the site characteristics, the solar radiation and the photovoltaic panel type, sizing aims to provide the adequate values of the panel surface, battery capacity and (in some instances) the reservoir volume. In this sense, researchers have established various methods to optimize photovoltaic installations components [5]. For instance, some works have focused on developing analytic methods based on a simple calculation of the panels surface and battery bank capacity using the energetic balance [6-8]. Other works have concentrated on the cost versus reliability question [9]. Moreover, some researchers have proposed sizing algorithms based on the minimization of cost functions, using the Loss of Load Probability (LLP) concept [10-14]. This LLP approach
has also been combined with artificial neuronal networks and genetic algorithms [9, 10].
However, these methods may result in an oversized system for one location and an undersized one for another location [15]. The oversized case results in high installation costs. Whereas, an undersized case, the installation is unable to supply the load with the energy needed [16, 17]. Moreover, the installation lifetime is shorter, due to the excessive use of the batteries. For these reasons, the sizes must be carefully selected for each specific application and location [15].
In [18], the deterministic method and the probabilistic approach are used to analyze the impact on design the PV system and the battery storage for three geographic sites in Italy, characterized by different values of sun radiation and ambient temperature. To find the best comprise between two conflicting obiecjetives (reliability and costs) a fuzzy logic based multi-objective optimization approach was used in [19].
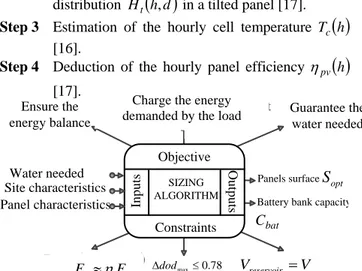
This paper presents a continuation of previous published works by some the authors [16, 17], where an a sizing algorithm has been presented. Here, the algorithm is detailed and validated by means of hourly probabilistic simulations, that spans one year, using a widely used general software for the study of PV systems (Grid-connected, stand-alone or hybrid), named PVSyst [20] (Figure 1).
I.SIZING ALGORITHM PRINCIPLE
• the water volume needed, • the site characteristics, • the panel characteristics.
The algorithm aims to find the panels surface Sopt and the battery capacity Cbatopt that guarantee the installation
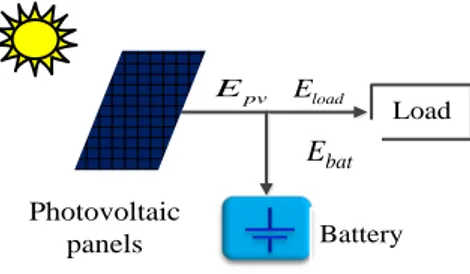
autonomy when supplying the pump. Hence, the idea consists in searching the optimal components sizes that ensure the balance between the charged and the extracted energies Ec and Ee, respectively. In fact, the battery bank supply the load by Ebat when the panel does not generate the sufficient
energy Eload, and is charged with a part of the PV energy
produced Epv (Figure 2). The balance between the
accumulated and the extracted energies does not guarantee the autonomy, due to the fluctuation in the solar radiation and the energy losses. Thus, to ensure the autonomy and provide the energy demanded by the load, the algorithm is performed by adopting an efficiency coefficient
η
(slightly greater than 1). Hence, the energy balance can be expressed as follows:c e
E
≈
η
E
(1)The sizing algorithm is performed using two sub algorithms during the vegetative cycle: the Algorithm 1 determines the sizes of the panel surface SM and the battery capacity
M
bat
C for each month M. Then, Algorithm 2 is performed to deduce the final sizes based on the sizes determined for each month and the available components, providing the numbers of panels and batteries needed. Algorithm 1 is detailed now following Figure 4.
a) Algorithm 1: Determination at each month of the minimum panel surface and battery bank capacity Step 1 Estimation of the diffused and direct radiation. Step 2 Deduction of the hourly daily solar radiation
distribution Ht
( )
h,d in a tilted panel [17]. Step 3 Estimation of the hourly cell temperature Tc( )
h[16].
Step 4 Deduction of the hourly panel efficiency ηpv
( )
h [17].Panel characteristics Inputs
Outputs
Constraints Objective
Panels surface
Water needed
SIZING ALGORITHM
Battery bank capacity
Protect the batteries against deep discharge Ensure the
energy balance
Guarantee the water needed
( AM PM) Ecη E +E
max 0.78 dod
∆ ≤ Vreservoir =V
opt
S
opt bat
n
Site characteristics
Fig. 1 Planning of the proposed sizing algorithm
Step 5 Calculation of the water needed V [16, 17]:
(
)
1(
(
1)
)
1 1
i R
c To m
i R
f L
V k E r
f L
− −
= − + −
(2)
where: c
k : crop growth coefficient for month M, To
E : reference evapotranspiration average for month M, m
r : average rain volume for month M, i
f : leaching efficiency, R
L : leaching fraction given in the soil.
Step 6 Calculation of the pumping duration [17]: V
t Q
∆ = (3)
where Q is the water flow (m²/h).
Step 7Calculation of the minimum panel surface Si and the initial battery capacity Cbati using equations (4) and
(5) respectively:
2 1
pump aut
i
rech
pv bat l pv reg inv opt ther matching
P t d
S
d
W
η
η η η η η
η
∆
= +
(4)
max
dod V
d E C
bat aut d
bati = ∆ (5)
with: pump
P : pump power (W),
aut
d : requested days of autonomy,
rech
d : days needed to recharge the battery,
pv
W : average daily radiation (Wh/m2/ day),
bat
η : electrical efficiency of the battery bank,
l
η : electrical efficiency of the rest of the installation (includes ohmic wiring and mismatching wiring losses),
pv
η : efficiency of each photovoltaic panel,
reg
η : regulator performance,
inv
η : inverter performance,
optther
η : panel performance - optical and thermal effects (%),
matching
η : panel matching performance (%),
d
E : daily energy consumption (Wh),
bat
V : battery voltage (V),
max
dod
∆ : maximum permitted variation of the depth of discharge dod .
Step 8 Calculation of Ppvi corresponding to the minimum panel surface
S
i, using (6) [17]:pv i pv i t
P =η S H (6)
c e
E ≈ηE
Photovoltaic panels
Load
pv
E Eload
load
E
Battery
Fig. 2 Energy balance principle
Step 9 Calculation of the energies expected to be daily stored and extracted from the battery Ecand Ee.
Step 10 If the extracted energy is higher than the stored energy, the algorithm increases the panel surface by the minimum increment of the PVP size commercially available: the algorithm looks for the best configuration to guarantee the balance between the demanded and the produced energies, by equalizing the energies stored Ec and extracted energies Eein the battery bank (1).
Step 11 Battery capacity CbatM deduction for month M
[17]:
bat c bat
V E
C M = (7)
b) Algorithm 2: Calculation of the minimum panel surface and battery bank capacity for the whole vegetative cycle
Using Algorithm 2 (Figure 3), the final values of the panel surface Sopt and the battery bank capacity
opt
bat
C , are
deduced. Sopt corresponds to the maximum value of the panel surface obtained during the months. The final battery capacity is the corresponding value forSopt, since it is the most critical.
II.APPLICATION TO A CASE STUDY
The proposed algorithm is applied now to evaluate the components sizes of a case study: the proposed algorithm is tested during the months that correspond to the vegetative cycle of tomatoes (March to July), using data of the target area (Northern of Tunisia: latitude: 36.39°, longitude: 9.6°).
Following Algorithm 2, the Algorithm 1 was first evaluated for all the months in the vegetative cycle: the solar radiation accumulated on a tilted panel is evaluated; then, the panel yield is calculated for each month; in parallel, the water needed V is evaluated depending on the vegetative cycle and the site [17]. Then, if the stored energy is higher than the extracted energy, the surface is increased by the minimum surface in the market (in our case, the increment is 0.5m2).
Algorithm 1 results are summarized in Table 1, which shows that the proposed strategy always ensures the water needs, respects the limits on the battery-bank’ depth of discharge and the energy balance (1). This has been tested during the months of tomatoes vegetative cycle: the efficiency coefficient η is around the fixed values throughout all the considered months. For this value, ∆dodmax is guaranteed to be equal to 0.78.
For instance, in July, the minimum η is 1.46, and the value obtained with Algorithm 1 η1 is equal to 1.47. On the
other hand, in March, the generated photovoltaic power during the morning supplies the pump together with the battery bank during the pumping duration. After that, the photovoltaic power generated charges the battery bank. The quotient between the cumulated and extracted energies is 1.66, which is near to target value 1.7. We must point out that for the energy balance, an error coefficient is used to consider the clouds. Hence, in our study, we take into account the possibility of having cloudy days. For example, in April the loss of energy each day is 23.23 %. The obtained results (Table 1) prove that the panels surface and battery bank capacity obtained using the proposed Algorithm 1 satisfy the energy balance. This is possible thanks to the calculation of the battery capacity, which is done by considering the same
max dod
∆ value that can be reached. Since July is the most critical month for irrigation, the system components sizing of July is selected. The obtained size allows the load to be supplied during the requested pumping duration ∆t, and also provides the energy Ec needed to charge the battery bank.
III.VALIDATION USING PVSYST
The installation size has been also tested using PVSyst, since the solar radiation, the ambient temperature and the load requirements of the target cite can be manually choosed. This tool allows determine and validate installations components sizes. In addition, it takes into account varios losses related with components or climatic parameters. Hence, PVSyst evaluate the size efficicency using the solar fraction (SF), which determines whether the panel surface is able to supply the load with the needed energy. Moreover, it performs a more detailed evaluation of the installation size: the system losses (Ls), the unused energy (Lu) and the energy supplied to the user (Yf). The PVSyst simulation shows that the adopted size (S= 101.5 m2
and Cbat=1680 A.h) gives good
results. In fact, Figures 5 and 6 show that during the crops vegetative cycle, the solar fraction (SF), which determine whether the solar installation provides the load with the sufficient energy, is pratically equal to one, except in June and July, in which it is equal to 0.962 and 0.934, respectively (Table 2). This leak of energy can be covered by considering an additional water volume in the reservoir.
Fig. 3 Sizing Algorithm 2
For M=1: Mmax, evaluate SM and CbatM
using Algorithm 1.
{
}
M opt bat
bat opt
S S when C
C
S S S S
M
opt = =
=max 1, 2,.., max
M
bat
M C
S ,
bat
Moreover, the obtained size is tested during the year (Figure 7), by taking into account all the possible losses related to the components or climatic parameters.
The results show that the choosen size allows supplying the load and having no more than 3.4 % of load losses, which represents a good result.
Fig. 4 Sizing Algorithm 1 for each month M
Fig. 5 Normalized production using PVSyst Fig. 6 Performance Ration and solar fraction using PVSyst
PR: Performance Ratio (Yf/Yr):0.211 1.2
1.0
Per
fo
rm
an
ce R
atio
PR
Jan Feb Mar Apr May Jun Jul Aug Sep Oct Nov Dec 0.8
0.6
0.4
0.2
0
SF: Solar Fraction (ESol/ELoad):0.966
Jan Feb Mar Apr May Jun Jul Aug Sep Oct Nov Dec Lu: Unused energy (full battery)
Lc: Collection loss (PV-array losses) Ls: system losses and battery charging Yf: Energy supplied to the user
1.91 kWh/kWp/day 1.07 kWh/kWp/day 1.34 kWh/kWp/day 1.15 kWh/kWp/day 10
8
6
4
2
0
N
o
rm
aliz
ed
e
ne
rg
y [
kW
h/
kW
p/
da
y]
Site characteristics
Step 1: Estimation of the diffused and the direct radiations Hdand Hb[17]. Step 2: Deduction of the solar radiation in a
tilted panel Ht [16, 17].
Step 3: Estimation of the temperature Tc
[17].
Step 4: Deduction of the panel’ efficieny ηpv
Step 5: Calculation of the needed water volume V
[16, 17].
Step 6: Calculation of the pumping duration ∆t
[16, 17].
pv
η
t
H
Step 7: Calculation of the initial panel’ surface and the initial battery bank capacity
i
bat C
and initialize .
Step 8: Calculation of the photovoltaic power Ppv i corresponding to the initial surface [17]. i
S
i
S=S
V ∆t
pv i
P
Step 9: Calculation of the energies charged and extracted from the battery bank andEc Ee.
c
E Ee
Step 10:
Yes
M
S =S
Step 11 : Deduction of
M
bat C
(7)
No
Decrement S
Yes
Increment S
No and
e
c E
E ≈η
e
c E
Fig. 7 Loss diagram over the whole year IV.CONCLUSION
A sizing algorithm to decide on the sizing of the installation elements was presented and validated using PVSyst tool. The algorithm is tested for a 10 ha land surface in the northern of Tunisia. The sizing results ensures supplying the pump during the pumping period, the energy needed by the load and the needed water volume for crops irrigation.
ACKNOWLEDGEMENTS
This work was funded by Ministerio de Ciencia e Innovación (Spain) under grant DPI2014-54530-R and FEDER funds.Miss Yahyaoui is funded by a grant MICInn BES-2011-047807.
V.REFRENCES
[1] Kaldellis, J. K; Zafirakis, D; & Kondili, E. (2010). “Optimum sizing of photovoltaic-energy storage systems for autonomous small islands”. International Journal of Electrical Power & Energy Systems, 32(1), 24-36.
[2] Sidrach-de-Cardona, M; & Mora López, Llanos. (1998). “A simple model for sizing stand-alone photovoltaic systems”.Solar Energy Materials and Solar Cells,55(3), 199-214.
[3] Khatib, Tamer; Mohamed, Zah.A; & Sopian, K. (2013). “A review of photovoltaic systems size optimization techniques”. Renewable and Sustainable Energy Reviews, 22, 454-465.
[4] Jakhrani, Abdul Qayoom; Othman, Al-Khalid; Rigit, Andrew; Ragai. Henry; Samo, Saleem. Raza; & Kamboh, Shakeel. Ahmed. (2012). “A novel analytical model for optimal sizing of standalone photovoltaic systems”. Energy, 46(1), 675-682.
[5] Acakpovi, Amevi; Xavier, Fifatin. Francois; & Awuah-Baffour, Robert. (2012). “Analytical method of sizing photovoltaic water pumping system”. In the proceedings of the 4th IEEE International Conference on Adaptive Science & Technology, 65-69.
[6] Shrestha, G. B; & Goel, L. (1998). “A study on optimal sizing of stand-alone photovoltaic stations”. IEEE Transactions on Energy Conversion, 13(4), 373-378.
[7] Barra, Luciano; Catalanotti, Sergio; Fontana, F; & Lavorante, F. (1984). “An analytical method to determine the optimal size of a photovoltaic plant”. Solar Energy, 33(6), 509-514.
[8] Groumpos, P. P; & Papageorgiou, G. (1987). “An optimal sizing method for stand-alone photovoltaic power systems”. Solar Energy, 38(5), 341-351.
[9] Mellit, A; Benghanem, M; Hadj Arab, A; & Guessoum, A. (2003). “Modelling of sizing the photovoltaic system parameters using artificial neural network”. In the proceedings of the IEEE Conference on Control Applications, 353-357.
[10] Yang, Hongxing; Zhou, Wei; Lu, Lin; & Fang, Zhaohong. (2008). “Optimal sizing method for stand-alone hybrid solar–wind system with LPSP technology by using genetic algorithm”. Solar Energy, 82(4), 354-367.
[11] Khatib, Tamer; Mohamed, Azah; Sopian, K; & Mahmoud, M. (2012). “A new approach for optimal sizing of standalone photovoltaic systems”. International Journal of Photo Energy.
[12] Klein, S. A; & Beckman, W. A. (1987). “Loss-of-load probabilities for stand-alone photovoltaic systems”. Solar Energy, 39(6), 499-512. Horizontal global irradiation
Global incident in coll. plane
IAM factor on global Effective irradiancy on cells
PV conversion
Array nominal energy (at STC effic)
PV loss due to irradiance level
PV loss due to temperature
Module quality loss
Module array mismatch loss
Ohmic wiring loss
Loss by respect to the MPP running
Unused energy at the output of the array Effective energy at the output of the array
Converter loss during operation (efficiency)
Converter loss due to power threshold
Converter loss over nominal conv. voltage Converter loss due to voltage threshold Battery stored energy balance
Battery efficiency loss
Battery efficiency loss
Battery self-discharge current
Energy need of the user Energy supplied to the user 1808 kWh/m²
1939 kWh/m² * 81 m² Cells
-2.9 % +10.5 %
Efficiency at STC= 15.80 %
-3.5 %
-10.9 %
-1.2 %
-1.1 %
-0.6 %
0.0 %
-42.7 % 11.52 MWh
-5.5 %
0.0 %
0.0 % 0.0 %
+0.2 %
-35.7 %
-23.8 %
0.0 %
5.51 MWh 10.89 MWh
Stored 70.6%
D
ir
ec
t us
e 29.4%
Missing energy 3.4 % 0.2 MWh
24.68 MWh
5.33 MWh
[13] Abouzahr, I; & Ramakumar, R. (1991). “Loss of power supply probability of stand-alone photovoltaic systems: a closed form solution approach”. IEEE Transactions on Energy Conversion, 6(1), 1-11. [14] Maghraby, H. A. M; Shwehdi, M. H; & Al-Bassam, G. K. (2002).
“Probabilistic assessment of photovoltaic (PV) generation systems”. IEEE Transactions on Power Systems, 17(1), 205-208.
[15] Mellit, A; Benghanem, M; & Kalogirou, S. A. (2007). “Modeling and simulation of a stand-alone photovoltaic system using an adaptive artificial neural network: Proposition for a new sizing procedure”. Renewable Energy, 32(2), 285-313.
[16] Yahyaoui, Imene; Chaabene, Maher;& Tadeo, Fernando.(2013). “An algorithm for sizing photovoltaic pumping systems for tomatoes irrigation”. In the proceedings of the IEEE International Conference
on Renewable Energy Research and Applications (ICRERA), 1089-1095.
[17] Yahyaoui, Imene; Ammous, Mahmoud; & Tadeo, Fernando. (2015). “Algorithm for optimum sizing of a photovoltaic water pumping system”.Int. Journal of Computer Applications (IJCA), 11(6), 21-28. [18] Capizzi, Giacomo.; Bonanno, Francesco; & Tina, Giuseppe. Marco.
“Experiences on the Design of Stand-Alone Photovoltaic System by Deterministic and Probabilistic Methods”. Proceedings of the International Conference on Clean Electrical Power (ICCEP), 328– 335.
[19] Giuseppe. Tina; Conti, Stefania; & Ragusa, Carlo (2002). “Optimal sizing procedure for stand-alone photovoltaic systems by Fuzzy Logic” Journal of Solar Energy Engineering, 124, 77-82.
[20] PVsyst software. CUEPE, University of Geneva. www.pvsyst.com.
Table 1 Panel surface and battery capacity for each month M
Table 2 Energy balance and main PVSyst results
Results
Months
GlobHor
(kWh/m2)
GlobEff
(kWh/m2)
E Avail (MWh)
E Unused (MWh)
E Miss (MWh)
E User (MWh)
E Load
(MWh) Sol Frac
January 78.0 117.8 1.221 0.630 0.000 0.000 0.000 1.000
February 89.1 116.0 1.185 0.608 0.000 0.000 0.000 1.000
March 140.0 161.3 1.587 0.959 0.000 0.419 0.419 1.000
April 164.1 161.8 1.708 1.089 0.000 0.540 0.540 1.000
May 208.1 183.6 2.055 0.855 0.000 1.116 1.116 1.000
June 225.0 187.0 1.966 0.466 0.056 1.429 1.485 0.962
July 237.0 201.8 1.973 0.099 0.129 1.824 1.953 0.934
August 208.0 196.7 1.891 0.968 0.000 0.000 0.000 1.000
September 166.0 184.2 1.767 0.905 0.000 0.000 0.000 1.000
October 128.0 166.7 1.661 0.851 0.000 0.000 0.000 1.000
November 89.9 138.6 1.412 0.724 0.000 0.000 0.000 1.000
December 75.1 123.8 1.266 0.649 0.000 0.000 0.000 1.000
Year 1808.3 1939.5 19.692 8.801 0.185 5.328 5.513 0.966
March April May June July
Cloud coverage
A
c (%) 30.15 23.23 28.38 13.03 14.11error
η 1.30 1.23 1.28 1.13 1.14
( )
2M
S m 37.5 41.5 54.5 61.5 101.5
M
bat
C (Ah) 840 1050 840 1050 1680
1
c
e AM e PM E
E E
η =