INSTITUTO DE OFTALMOBIOLOGÍA APLICADA
TESIS DOCTORAL:
ANTERIOR SEGMENT
TOPOGRAPHY AND ABERRATIONS
FOR CLINICAL APPLICATIONS
Presentada por
PABLO PÉREZ MERINO
para optar al grado de doctor por la
Universidad de Valladolid
Dirigida por:
iii
Impreso 2T
AUTORIZACIÓN DEL DIRECTOR DE TESIS
(Art. 2.1. c de la Normativa para la presentación y defensa de la
Tesis Doctoral en la Uva)
Dña. SUSANA MARCOS CELESTINO con D.N.I. nº 07954600G, Profesora
de Investigación en el Instituto de Óptica “Daza de Valdés” del Consejo
Superior de Investigaciones Científicas (CSIC),
[email protected]
,
como Directora de la Tesis Doctoral titulada “Anterior segment topography
and aberrations for clinical applications”, presentada por D. PABLO PEREZ
MERINO, alumno del programa de CIENCIAS DE LA VISIÓN impartido por el
departamento INSTITUTO UNIVERSITARIO DE OFTALMOBIOLOGÍA
APLICADA, FACULTAD DE MEDICINA, autoriza la presentación de la misma,
considerando que la tesis presenta resultados originales y novedosos
para la comprensión de las aplicaciones clínicas de las patologías del
segmento anterior más frecuentes del ojo, utilizando tecnologías
estado-del-arte (Trazado de Rayos Laser y Tomografía de Coherencia Óptica), con
impacto en la comunidad científica, clínica e industrial, a través de
publicaciones en revistas internacionales de alto impacto y
comunicaciones en congresos nacionales e internacionales.
Valladolid, 16 de septiembre de 2015
El Director de la Tesis,
Fdo.: Susana Marcos Celestino
v
a mis padres, Pablo y Ramoni
a Ana
vii
Table of Contents
ANTERIOR SEGMENT TOPOGRAPHY and
ABERRATIONS for CLINICAL APPLICATIONS
Key words
xiList of commonly used abbreviations and variables
xiiiMotivation
xvChapter I. INTRODUCTION
1.1. The optics of the human eye 1
1.1.1. Historical introduction 1
1.1.2. Cornea 2
1.1.3. Crystalline lens 4
1.1.4. Pupil 6
1.1.5. Axes of the eye 6
1.2. Refractive errors 7
1.3. Optical aberrations 8
1.4. State-of-the art of aberrometers 11 1.5. State-of-the art of quantitative anterior segment imaging techniques 12
1.5.1. Elevation-based corneal topography 12
1.5.2. Optical Coherence Tomography (OCT) 14
1.6. Customized eye modeling: linking geometry and aberrations 18 1.7. Anterior segment conditions and clinical applications studied in this
thesis 20
1.7.1. Cornea (Keratoconus & Intracorneal Ring Segment (ICRS) treatment) 20
1.7.1.1. Keratoconus: topography and pachymetry 21
1.7.1.2. Keratoconus: aberrations 22
1.7.1.3. Keratoconus treatment: Intracorneal Ring Segments (ICRS) 22
1.7.2. Crystalline lens (Accommodation,Presbyopia, Cataract) 25
1.7.2.1. Accommodation 25
1.7.2.2. Presbyopia 27
1.7.2.2.1. Presbyopia solutions 27
1.7.2.3. Cataract (Intraocular lens) 30
1.8. Open questions addressed in this thesis 32
1.9. Goals of this thesis 33
1.10. Hypothesis 34
1.11. Structure of this thesis 34
Chapter II. MATERIAL AND METHODS
372.1. Laser Ray Tracing (LRT): ocular aberrations 38
2.1.1. LRT: basic concepts 38
viii
2.1.3. LRT: control and analysis software 41
2.1.4. LRT: calibration 42
2.2. Spectral Domain Optical Coherence Tomography 43
2.2.2. SD-OCT: custom-setup 43
2.2.3. SD-OCT: distortion correction 46
2.2.4. SD-OCT: image processing 48
2.2.5. OCT-based corneal aberrometry 54
2.3. Optical quality metrics 56
2.4. Subjects and protocol in measurements (LRT and OCT) 58
Chapter III. KERATOCONUS AND ICRS (
OCT-based Topography
and Aberrometry in keratoconus with Intracorneal Ring Segments
)
61Introduction 63
3.1. Material and methods 64
3.1.1. Patients 64
3.1.1.1. OCT-based Corneal Topography in keratoconus and ICRS 64
3.1.1.2. OCT-based Corneal Aberrometry in keratoconus and ICRS 65
3.1.2. Custom SD-OCT system 66
3.1.3. OCT image processing: corneal surface analysis & ICRS segmentation 67
3.1.4. OCT image processing: corneal aberration analysis 68
3.1.5. LRT: total aberration analysis 68
3.1.6. Optical quality metrics 69
3.1.7. Visual acuity measurements 69
3.1.8. Statistical analysis 69
3.2. Results 70
3.2.1. OCT-based corneal topography and geometry in keratoconus and ICRS 70
3.2.1.1. Longitudinal changes of anterior corneal geometry and topography 70
3.2.1.2. Longitudinal changes of poserior corneal geometry and topography 73
3.2.1.3. Longitudinal variation of corneal power 75
3.2.1.4. Corneal thickness: pre- and post-ICRS implantation 75
3.2.1.5. 3-D ICRS location 76
3.2.1.6. Correlation between surgical parameters and corneal geometry 78
3.2.2. OCT-based corneal aberrometry in keratoconus and ICRS 78
3.2.2.1. LRT vs OCT aberrometry 78
3.2.2.2. Pre- and post-ICRS aberrations 82
3.2.2.3. Visual acuity vs optical quality 84
3.2.2.4. Posterior corneal surface contribution 84
3.2.3. OCT-based aberrometry vs OCT-based geometry 85
3.3. Discussion 86
Chapter IV. ACCOMMODATION (
OCT-based Crystalline Lens
Topography in Accommodating Eyes
)
91Introduction 93
4.1. Material and methods 93
4.1.1. Subjects 93
ix
4.1.3. OCT: Experimental Procedure 94
4.1.4. OCT: Image Processing 95
4.1.5. OCT: Spatial resolution and Accuracy Considerations 96
4.1.6. Biometric, geometric and surface changes with accommodation 97
4.1.7. Accommodative response 98
4.1.8. Corneal and lens surface astigmatism axis 98
4.1.9. Statistics 98
4.2. Results 99
4.2.1. Anterior and posterior lens surface elevation (relaxed state) 99
4.2.2. Comparison of Zernike coefficients of ocular surfaces 100
4.2.3. Phenylephrine vs natural anterior lens surface topography 102
4.2.4. Changes in anterior segment biometry with accommodation 102
4.2.5. Changes in lens surface elevation with accommodation 103
4.2.6. Corneal and lens surface astigmatism with accommodation 105
4.3. Discussion 107
Chapter V. PRESBYOPIA-CATARACT AND IOL (Aberrometry and OCT-based Geometrical Evaluation of Patients Implanted with
Accommodative IOLs) 111
Introduction 113
5.1. Material and methods 114
5.1.1. Patients, surgery and A-IOLs 114
5.1.2. Control groups: young and monofocal IOL 114
5.1.3. OCT: measurements 115
5.1.4. OCT: data analysis 116
5.1.5. LRT: measurements 117
5.1.6. LRT: data analysis 117
5.1.7. Statistical analysis 118
5.2. Results 119
5.2.1. Anterior chamber depth (ACD) 119
5.2.2. Changes in ACD with accommodative effort 120
5.2.3. Lens thickness 121
5.2.4. IOL tilt 122
5.2.5. Capsulorhexis and haptic axis 123
5.2.6. Individual aberrations: unaccommodative state 124
5.2.7. Individual aberrations: changes with accommodative stimulus 125
5.2.8. Wave aberrations with phenylephrine and natural viewing conditions 128
5.2.9. Change in accommodative response with accommodative demand 129
5.2.10. Depth-of-focus 130
5.3. Discussion 132
Chapter VI. CATARACT AND IOL (
Chromatic aberration with
IOLs
)
137Introduction 139
6.1. Material and methods 140
x
6.1.2. LRT: total aberration analysis 141
6.1.3. Data analysis 141
6.2. Results 142
6.2.1. Monochromatic aberrations 142
6.2.2. Chromatic difference of focus 144
6.2.3. Effect of chromatic difference of focus on retinal image quality 145
6.3. Discussion 147
Epilogue: CONCLUSIONS AND FUTURE WORK
149Achievements 149
Conclusions 150
Clinical impact 151
Future work 151
RESÚMENES EN ESPAÑOL
153List of PUBLICATIONS
165Publications included in this thesis 165
Other publications 165
International congress contributions 166
Invited talks 169
Other information that might be relevant 170
Honors 170
BIBLIOGRAPHY
173xiii
List of commonly used abbreviations and variables
Abbreviatons
Imaging Techniques
OCT = Optical Coherence Tomography TD-OCT = Time-Domain OCT SD-OCT = Spectral-Domain OCT SS-OCT = Swept-Source OCT LRT = Laser Ray Tracing H-S = Hartmann-Shack
UBM = Ultrasound biomicroscopy MRI = Magnetic Resonance Imaging PCI = Partial Coherence Interferometry
Optical Terms
IR = Infrared
CCD = Charge Couple Device LED = Light Emitting Diode SLD = Superluminiscent Diode DLP = Digital-Light-Processing NA = Numerical Aperture BS = Beam Splitter FC = Fiber Coupler OI = Optical Isolator PC = Polarization Controller M = Mirror
L = Lens
NDF = Neutral Density Filter SNR = Signal-to-Noise Ratio HOAs = High-Order Aberrations
LCA = Longitudinal Chromatic Aberration
TCA = Transverse Chromatic Aberration GRIN = Gradient Index
DoF = Depth-of-Focus
General
2-D = Two-dimensions 3-D = Three-dimensions i.e. = id est, this is
e.g. = exempli gratia, for example vs = versus, compared to
VA = Visual Acuity
BCVA = Best-Corrected VA
D = Diopters N = Nasal T = Temporal S = Superior I = Inferior H = Horizontal V = Vertical
OFZ = Organelle-Free Zone (crystalline lens)
AL = Axial Length
ACD = Anterior Chamber Depth LT = Lens Thickness
Clinical treatments
IOL = Intraocular Lens A-IOL = Accommodating-IOL ICRS = Intracorneal ring segment CL = Contact Lens
PPMA = Polymethyl-methacrilate
Wavefront Analysis
FFT = Fast Fourier Transform FWHM = full-width-half-minimum RMS = Root Mean Square
PSF = Point Spread Function SR = Strehl Ratio
xiv
Variables
Coefficients and indices
n, m, j, … = index names
N, M = maximum index/number
General Optical Variables
λ = Wavelength
κ = Wavenumber (propagation constant) ω = angular frequency
υ = frequency R, r = Radius C = Curvature (=1/R) K = Conic constant p = p-value, asphericity Q = Q-value, asphericity
W(x,y) = Wave aberration in Cartesian coordinates
𝑍𝑛𝑚 = Zernike polynomial in Cartesian
coordinates
𝑐𝑛𝑚 = Zernike coefficient (order, n;
frequency, m).
φ = phase (wavefront aberration) A = Amplitude
I = Intensity E = Electric field
d = Thickness of optical medium f = Focal length
n = refractive index DoF = Depth-of-focus
Units
s = seconds mm = milimeters µm = microns nm = nanometers deg = degrees
Coordinates
o = origin
xv
Motivation
The eye is one of the most elegantly built organs of the human body playing a triple role in gathering information of the external world, coding it and relying to the brain. It has a relatively simple optical design with incredible functionality; only two lenses (cornea and crystalline lens) set the physical rules for image-forming onto the retina. However, the eye is far from a perfect optical system since imperfections in the cornea and in the crystalline lens shape induce focusing errors and image degradation, known as optical aberrations.
State-of-the-art aberrometry provided a detailed analysis of the optical aberrations of the whole eye in normal subjects and in certain ocular conditions such as accommodation, aging, corneal degeneration and cataract surgery. Whereas different aberrometers allow measuring the optics of the eye, the relative contribution of the corneal and crystalline lens surfaces themselves to the optical quality of the eye is still poorly understood.
The aberrations of the cornea can be estimated from three-dimensional (3-D) measurements of the corneal shape. However, due to limitations of the commercial available anterior segment techniques (i.e., low resolution, high acquisition time, limited depth range and inherent distortion of the imaging systems), knowledge of in vivo geometrical parameters of the crystalline lens is only limited to 2-D measurements or axial distances. Hence, optical coherence tomography (OCT) presents several advantages over other imaging techniques (higher speed, resolution and depth range) for a 3-D accurate measurement of the anterior segment geometry.
Understanding the link between optical aberrations and anterior segment geometry is key for comprehending how the eye works and for modeling the optics of an individual eye. The eye has many innate adaptations that minimize optical aberrations. In most normal young eyes, the magnitude of aberrations of the cornea is larger than for the whole eye, indicating a significant role of the crystalline lens in compensating corneal aberrations. But, due to geometrical and structural changes this ocular compensation gets disturbed in different anterior segment conditions, such as keratoconus, presbyopia and cataract. While keratoconus degrades the corneal shape progressively and consequently vision in the adolescence; presbyopia and cataract are conditions related to aging that affect the crystalline lens and degrade vision.
xvi
Chapter I. INTRODUCTION
1
Chapter I.
INTRODUCTION
In this introductory chapter we present a description of the optics of the eye, with special focus on the cornea and the crystalline lens. The refractive errors and ocular aberrations will be pointed out; and an overview of quantitative anterior segment imaging systems and the ocular aberrometry techniques will be described. We introduce some common pathologies and conditions in the anterior segment of the eye and their treatment. We also present the open questions, the goals and the hypothesis addressed in this thesis.
1.1.
The optics of the human eye
“to be sought in the structure and functioning of the eye itself…” J. Kepler. “Ad Vitellionem paralipomena”, 1604[Kepler, 1604]
Human vision is a complex process that involves numerous components of the eye and the human brain. Briefly, in the eye, light from the visible spectrum is directed and refracted by two optical and transparent elements, the cornea and the crystalline lens, which project the images of the outside world on the retina. In the retina, cones and rods samples the light distribution, and then the light is absorbed and converted into chemical and electrical signals (visual signals) by the retinal layers. These visual signals are transmitted by the optic nerve into the visual cortex for further processing and final perception of the visual information.
1.1.1.
Historical introduction
INTRODUCTION
2
Figure 1.1. Left: The eye in Opticae thesaurus Alhazeni Arabis (1572); Wellcome Library, London. Right: Schema of the human eye adapted from an image of the National Eye Institute Catalog (number NEA09).
1.1.2.
Cornea
The majority of the refracting power of the eye is provided by the cornea, the transparent and curved “window” at the front of the eye [Beems & Van Best, 1990; Benedek, 1971; Hart & Farrell, 1968; Jakus, 1962; Jester, 2008; Maurice, 1957]. It fulfills a dual role, acting as both the primary refractive element and as a physical barrier to maintain ocular integrity; the cornea is a viscoelastic tissue that responds to the presence of external and internal forces [Dupps Jr & Wilson, 2006; Elsheikh et al., 2008; Kling et al., 2009; Meek & Knupp, 2015; Meek & Newton, 1999; Roberts, 2000].
Histologically, the cornea is an inhomogeneus cellular and fibrillar structure composed of five layers: epithelium, Bowman´s layer, stroma, Descemet´s membrane and endothelium. The cornea mainly contains water (78%), regularly arranged collagen fibrils, proteoglycans and keratocytes. Each corneal layer has its own refractive index, but since the stroma is by far the thickest layer, its refractive index dominates (1.376).
Chapter I. INTRODUCTION
3
order to maintain the stroma hydration (at about 78%) and thus retain transparency [Atchison & Smith, 2000; Knupp et al., 2009; Maurice, 1957; Meek & Knupp, 2015; Morishige et al., 2007].
Stromal collagen assembles to form long fibrils that in the human cornea show a uniform diameter of approximately 31-34 nm, and are separated by 20-50 nm. Collagen fibers are approximately 1-2 µm thick, 10-200 µm wide and are thought to traverse the entire cornea from limbus to limbus [Polack, 1961]. The fibrils within a layer run parallel to each other, they are inclined at large angles to fibrils in adjacent lamellae and are uniform in size and spacing. Collagen fibrils are generally organized into independent bundles or fibers, lamellae. The regular arrangement of collagen fibrils in each stromal lamellae is the main responsible for the transparency of the cornea and the alternating orientation provides its shape and mechanical stability [Boote et al., 2005; Jester, 2008; Knupp et al., 2009; Meek & Knupp, 2015; Morishige et al., 2011].
Due to the corneal shape and the difference of refractive index between the cornea (1.37) and the air (1.0), the cornea contributes about two-thirds of the refractive power for the relaxed eye, approximately 42 D, with anterior and posterior paraxial powers of about +48 D and -6 D, respectively. The adult human cornea is smaller in the vertical diameter (9-11 mm) than in the horizontal diameter (11-12 mm). Both anterior and posterior corneal surfaces have a regular and stable shape in normal population, presenting convex and aspheric surfaces (flattening away from the corneal apex) [Atchison & Smith, 2000]. Corneal shape varies with age and across individuals [Allison & Brennan, 1997; Dubbelman & Heijde, 2001; Guirao & Artal, 1999a; Navarro et al., 2013].
Because of its accessibility, the anterior corneal surface has been widely studied. In a normal population, the central radius (3-mm optical zone) is around 7.5 and 8.0 mm. Although the posterior corneal surface is less accessible and represents a lower contribution to the ocular optics (due to a smaller difference between corneal and aqueous humor), its contribution is not negligible, as has been shown to compensate part of the irregularities of the anterior cornea, in particular astigmatism (31% [Dubbelman et al., 2006b]), spherical aberration (from 10% compensation to 26% addition [Sicam et al., 2006]) and vertical coma (from 3% [Dubbelman et al., 2007b] to 20% [Barbero et al., 2002b] compensation). The posterior corneal surface overall has a shorter radius of curvature, with a central radius between 5.9 and 6.7 mm. Neither the anterior nor the posterior surfaces are perfectly spherical due to the presence of asphericity and toricity (since the corneal surfaces usually presents different radius at vertical and horizontal meridians which produces astigmatism). Generally, in young eyes, the vertical meridian is steeper than the horizontal meridian, although this tendency reverses with age [Allison & Brennan, 1997; Baldwin & Mills, 1981; Dubbelman & Heijde, 2001; Lyle, 1971; Navarro et al., 2013].
INTRODUCTION
4
Equation 1.1: 𝜌 − 2𝑧𝑅 + (1 + 𝑄)𝑧2 = 0
The average anterior corneal radius R and asphericity Q are 7.7 mm and -0.25 in a normal population, respectively, this shape corresponds to a prolate ellipsoid, i.e., the cornea flattens towards the periphery. The average posterior corneal radius R and asphericity Q are 6.4 mm and 0.3 in a normal population, respectively.
Corneal thickness has been widely studied, in the central cornea thickness is on average 523±39 µm, and it thickens towards the periphery (660±76 µm) [Atchison & Smith, 2000].
1.1.3.
Crystalline lens
The crystalline lens is the responsible for the remaining refraction of the eye, i.e. approximately one-third of the refractive power (on average, 14 D), and it has the capability in young subjects of focusing objects at different distances, a mechanism known as accommodation [Charman, 2009; Glasser & Campbell, 1998b].
Histologically, the crystalline lens is composed by the lens capsule, the lens epithelium and the lens fibers. The lens consists largely of lens fiber cells forming the nucleus and cortex. The crystalline lens is covered by an external capsule, located between the iris and the vitreous humor and attached to the cilliary processes by thin filamentous zonules. The crystalline lens is transparent due to its avascularity, lack of organelles, regular organization of the cells, fibers and proteins and its narrow inter-fiber spaces [Atchison & Smith, 2000; Bassnett et al., 2011; Beebe, 2003; Benedek, 1971; Mathias et al., 1997; Trokel, 1962].
The lens capsule is a multicellular organ surrounded by a basal lamina with an anterior layer of cuboidal epithelium covering concentric layers of fibers. The lens capsule consists mostly of a well-organized matrix of collagen IV, enactin and laminin. The capsule is produced continuously during life by the lens epithelium, which growths in a lamellar fashion along the lens. The anterior lens capsule is thicker than the posterior one. It is elastic in nature and prevents high molecular-weight substances from entering the lens [Beebe, 2003].
The lens epithelium is a single layer of cuboidal cells located between the lens fibers and the lens capsule on the anterior half of the lens. The epithelial cells contain different organelles for both aerobic and anaerobic metabolic activity. At the cellular level, there is limited light-scattering because of the organized distribution of the cellular organelles, which are relatively sparse in the central epithelium.
At the equator, away from the light path, epithelial cells undergo mitotic division and differentiate into lens fibers [Beebe, 2003]. Newly laid fibers crowd and compact previous fibers, thus the oldest are the most central (nucleus) and are the outermost fibers the most recently formed fibers (constituting the lens cortex) [Beebe, 2003; Wride, 2011]. High concentrations of crystallin proteins in the lens fibres contribute to lens transparency [Michael & Bron, 2011].
Chapter I. INTRODUCTION
5
shows a gradient-index (GRIN) distribution. The nucleus of the lens shows the highest refractive index, whereas the more peripheral fibers from the cortex present the smallest refractive index in the lens [Atchison & Smith, 1995; de Castro et al., 2011; Goncharov & Dainty, 2007; Siedlecki et al., 2012; Von Helmholtz, 1909]. Furthermore, the distinctive concentration of different proteins produces changes in the refractive index across layers [Beebe, 2003]. Recently, de Castro et al. [de Castro et al., 2010] reported index variation in the nucleus with values ranging from 1.434 to 1.413 and in the lens cortex with values ranging from 1.386 to 1.376, showing a monotonic decrease in young crystalline lens and a plateau-like functioning in older crystalline lens. To date, most GRIN measurements (and all through optical measurements) have been performed ex vivo [Birkenfeld et al., 2013; de Castro et al., 2011; Jones et al., 2007], so for in vivo crystalline lens studies an equivalent refractive index (Uhlhorn´s formulae) is commonly used [Uhlhorn et al., 2008].
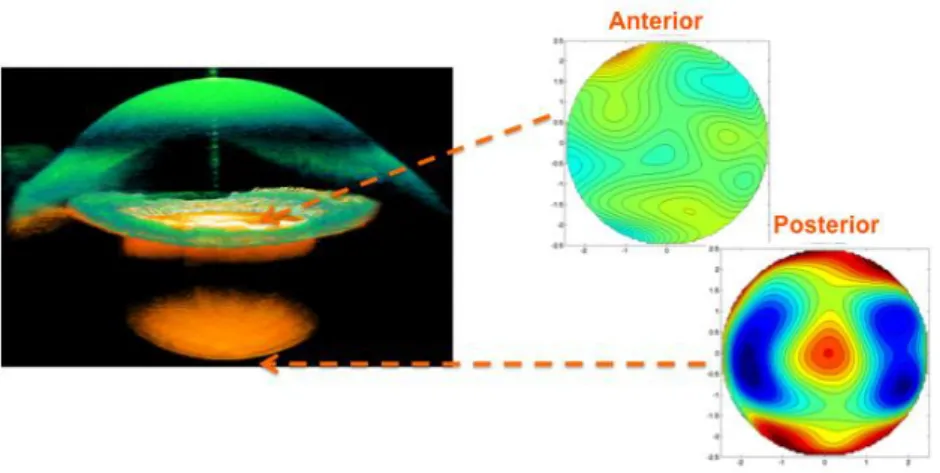
Due to its inaccessibility, the in vivo geometrical parameters of the crystalline lens are limited in the literature. Rosales et al. [Rosales et al., 2006; Rosales & Marcos, 2009] using distortion-corrected Scheimpflug camera reported averaged values of the crystalline lens radius for the anterior surface (11.1±1.1 mm) and for the posterior surface (6.1±0.5 mm). Dubbelman et al. (Dubbelman & Heijde, 2001) described age-related expressions for the anterior and posterior crystalline lens surfaces respectively (R=12.9-0.057*age, anterior; R=6.2-0.012*age, posterior), and reported an average conic constant value of -4 and -3 for the anterior and posterior lens, respectively. Average lens thickness values range between 3.06 mm to 4.19 mm at 30 years old of age with a mean increase of 24 µm/year [Dubbelman & Heijde, 2001]. Recently, Ortiz et al. [Ortiz et al., 2012b] quantified the crystalline lens geometrical properties with distortion-corrected Optical Coherence Tomography (OCT) and reported the first in vivo report of 3-D surface elevation maps of the anterior and posterior lens surfaces. Ortiz et al. [Ortiz et al., 2012b] described a perpendicular orientation of the astigmatism vs the posterior lens surface in young subjects.
INTRODUCTION
6
Internal astigmatism may be produced by the toricity of the crystalline lens surfaces [Dunne et al., 1996; Keller et al., 1996] or by a tilt of the lens [Rosales & Marcos, 2006]. Aberration analysis between different ocular elements has shown compensation in corneal astigmatism and high-order aberrations by the crystalline lens and a disruption in this balance as we age [Artal & Guirao, 1998; Artal et al., 2001b; Kelly et al., 2004a; Marcos et al., 2008; Mclellan et al., 2001; Tabernero et al., 2007]. Javal postulated a relationship between corneal and refractive astigmatism and proposed a compensation of -0.5 D of against-the-rule astigmatism by the internal optics. Elawad, in his PhD thesis [Elawad, 1995], and Dunne et al. [Dunne et al., 1996] measured the contribution of the different ocular components to residual astigmatism in human eyes, and found that whilst the astigmatic contributions of the posterior corneal and posterior lens surfaces were found to be predominantly inverse (with the steeper meridian in the horizontal axis), direct astigmatism came from the anterior lens surface, although they recognized that the techniques used in their studies were subject to cumulative errors. Artal et al. [Artal et al., 2001a] and Kelly et al. [Kelly et al., 2004a] found significant negative correlation for corneal horizontal/vertical astigmatism, lateral coma and spherical aberration and the internal optics, indicating a fine-tuned compensation process between the cornea and the lens in the young unaccommodated state. The GRIN has been shown experimentally to play a major role in the negative sign of the spherical aberration of the young crystalline lens [Birkenfeld et al., 2014; de Castro et al., 2013; Smith & Atchison, 2001].
Accommodation, presbyopia and cataract will be treated in section 1.8.
1.1.4.
Pupil
The diameter of the incoming beam of light into the eye is controlled by the iris, which contracts and dilates according to the surrounding light and it acts as the pupil. From geometrical considerations, the quantity of light from any object reaching the retina is proportional to the area of the pupil [Atchison & Smith, 2000].
1.1.5.
Axes of the eye
Chapter I. INTRODUCTION
7
Figure 1.3. Illustration of the axis of the eye.
1.2.
Refractive errors
“Los grados de los antojos, son vnas porciones o partes de esferas, q se van disminuyendo, desde vna esfera de dos varas de diámetro, hasta otra tan pequeña, como el diámetro que tiene la redódez del ojo; y los grados van creciendo según se va disminuyendo, ó achicando estas esferas y sus diámetros: cuyas por porciones cóncavas o convexas, se van pasando a las formas donde se labran los antojos, de tal manera que la diferencia de diámetro que tiene la mayor esfera á la menor, se divide en treynta partes, a las quales llamamos grados, començando su numero desde la porción de la mayor esfera, y feneciendo el numero treinta, en la porción de la menor que es la del ojo: Y estos treinta grados, son bastantes para medir y ajustar qualquiera cortedad de vista por mucha q sea porque todas las vistas que comiençan a usar antojos…” B. Daza de Valdés. “Uso de los antojos”, 1623 [Daza de Valdés, 1623]
Refractive errors are the most common cause of reduced vision and normally are easily corrected by adding lenses in front of the eye. Refractive errors can be defined from an optical point of view as the refractive condition in which best focus for distant objects is not located on the retina of the relaxed eye and refractive errors are generally divided into defocus and astigmatism:
There are two types of defocus: myopia and hyperopia. Myopia, or nearsightedness, is present when the focus of the eye falls in front of the retina causing a spherically defocused image. By contrast, hyperopic eyes have difficulties to resolve close objects, because the image falls behind the retina causing also a spherically defocused image and distant objects can only be focused with accommodation. Defocus is sometimes accompanied by astigmatism.
INTRODUCTION
8
Astigmatism is a symptom of asymmetry in the optics of the eye, where the refractive power in one meridian is different in the power in the perpendicular meridian (this will result in two lines of foci, and therefore an orientation dependent blur of the image).
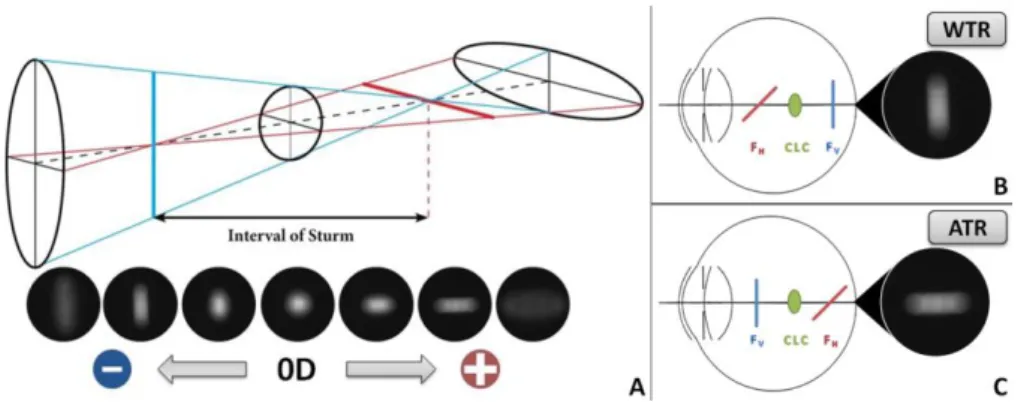
Figure 1.5. (A) Series of “retinal” images of a circular spot captured in the CCD camera at the focal plane of a lens acting as an artificial eye (Z22 = 0.92 µm, 6-mm
pupil diameter). (B) Illustration of the astigmatic foci in a myopic with the rule astigmatism. (C) Illustration of the astigmatic foci in a myopic against the rule astigmatism [Marcos et al., 2015].
1.3.
Optical aberrations
“My eye, in a state of relaxation, collects to a focus on the retina, those rays diverge vertically from an object at the distance of ten inches from the cornea, and the rays which diverge horizontally from an object at seven inches distance…” “When I look at a minute lucid point, such as the image of a candle in a small concave speculum, it appears as a radiated star, as a cross, or as an unequal line, and never as a perfect point…”
T. Young. “On the mechanism of the eye”, 1801 [Young, 1801]
Chapter I. INTRODUCTION
9
Figure 1.6. (A) Illustration of wavefront aberrations. (B) Schematic representation of a non-aberrated eye. (C) Schematic representation of an aberrated eye.
Chromatic aberrations are a consequence of the dispersion (variation of refractive index with wavelength) of the refractive media of an optical system. The average index of refraction in the eye varies from 1.3404 for blue (450 nm) to 1.3302 for red (700 nm). This means that the eye is about 1.5 D more myopic in blue light than in red.
There are two types of chromatic aberrations: longitudinal and transversal. Longitudinal chromatic aberration (LCA) is produced because the different wavelengths are focused at different image planes, and can be quantified as the variation in power with wavelength. Whereas transverse chromatic aberration (TCA) is produced when obliquely incident rays are focused at different transverse positions within the image plane (being critical the object location in the visual field and the pupil position within the eye). LCA affects image contrast through the mechanism of defocus and TCA affects image phase through the mechanism of displacement [Bedford & Wyszecki, 1957; Bradley, 1992; Howarth, 1984; Howarth & Bradley, 1986; Marcos et al., 1999; Marcos et al., 2001; Simonet & Campbell, 1990].
LCA has been measured by using psychophysical techniques (e.g., Badal optometer [Bobier & Sivak, 1978a; Morrell et al., 1991], Spatially Resolved Refractometry [Marcos et al., 1999]) and objective reflectometric techniques (e.g. Hartmann-Shack [Vinas et al., 2015] and Laser Ray Tracing [Llorente et al., 2003]).
Monochromatic aberrations are those present when only one wavelength is considered, and arise from the geometry, irregularities, tilts and decentrations of the components of the optical system (cornea and crystalline lens). The magnitude of the monochromatic aberrations in the eye depends on a variety of factors such as accommodation, pupil size, aging, refractive state and retinal eccentricity [Applegate et al., 2000; Guirao & Artal, 1999b; Howland & Howland, 1977; Marcos et al., 2001; Mclellan et al., 2001; Navarro et al., 1998; Plainis & Pallikaris, 2006; Porter et al., 2001; Thibos & Hong, 1999].
INTRODUCTION
10
horizontal/vertical astigmatism, spherical aberration and lateral coma [Artal et al., 2001b; Kelly et al., 2004a].
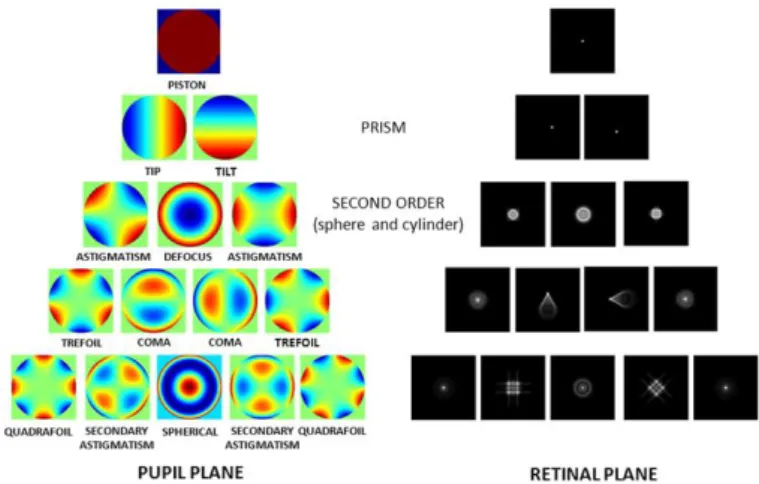
The wave aberration of a general optical system can be described mathematically by a polynomial series. Zernike polynomial expansion has become the standard for representing wave aberration data because they form an orthogonal set over a circle of unit radius, and aberrations are usually referred to circular pupils [Mahajan, 1994; Malacara et al., 1990].
The Zernike polynomials (Znm, corresponding to the radial order n and the meridional frequency m) were described by Frits Zernike in 1934 [Zernike, 1934]. An interesting feature of the Zernike polynomials is that some terms are directly related to commonly known ocular aberrations [Thibos et al., 2004a]. For example, structural abnormalities of the eye, such as myopia, hyperopia and astigmatism, appear in the 2nd order of this expansion. Further, Zernike terms represent higher-order aberrations such as spherical aberration (arising from the asphericity of the optical surfaces) and coma (mainly associated to local irregularities, tilt and decentration of the surfaces of the optical system).
A wave aberration, W(x,y), can be described as a summation of Zernike polynomial functions weighted by the Zernike coefficients, which indicate the magnitude of each particular aberration present:
Equation 1.2: 𝑊(𝑥, 𝑦) = ∑𝑛,𝑚𝑐𝑛𝑚𝑍𝑛𝑚(𝑥, 𝑦)
The deviation from a monochromatic perfect spherical wavefront can be denoted by W(x,y), where W(x,y) is the wave aberration expressed in Cartesian coordinates, Zn
m
(x,y) the Zernike polynomial expressed in Cartesian coordinates, and cn
m
are the corresponding Zernike coefficients for radial order “n” and meridional frequency “m”.
Chapter I. INTRODUCTION
11
From the wave aberration coefficients, different optical quality descriptors can be directly derived after mathematical operations. The two classic descriptors are the Modulation Transfer Function (MTF) and the Point Spread Function (PSF). The MTF quantifies the loss in contrast associated to each spatial frequency, the higher the MTF the better the image provided by the system. The PSF is the impulse response of the system, i.e., the degraded image of an ideal point as imaged by the system. The Root Mean Square (RMS) is also a common descriptor, it is defined as the root square of the variance of the wave aberration and is typically used as the global metric for the optical quality [Applegate et al., 2003a; Applegate et al., 2003b]. Furthermore, the retinal image associated with any observed image can be simulated by convolving the ideal image with the PSF of the system [Cheng et al., 2003b; Guirao & Williams, 2003].
In the Chapter II we will describe the optical quality metrics descriptors analyzed in this thesis.
1.4.
State-of-the art of aberrometers
Ocular aberrations are currently measured by using different techniques. Although aberrometers measure ray aberrations as a function of pupil position, differences across instruments arise from their psychophysical (requiring the participation of the subject) or objective (based on the light reflected off the retina) nature of the technique, and the “ingoing” (aberrations measured as the test beam goes into the eye) or “outgoing” (as the wavefront emerges from the eye) direction of the measurement [Arnulf & Dupuy, 1956; Burns & Marcos, 2001; Howland, 2000; Liang et al., 1994; Liang & Williams, 1997a; Losada & Navarro, 1998; Marcos et al., 2002; Moreno-Barriuso & Navarro, 2000; Smirnov, 1961; Thibos et al., 1999]. The most relevant aberrometers are Hartmann-Shack (H-S) and Laser Ray Tracing(LRT).
The H-S is an objective “outgoing” aberrometry technique [Hartmann, 1900, 1904; Shack, 1971]. It is based on the measurement of ray deviations at different pupil positions of a wave reflected by the retina from a light point source. A microlens array, placed on a pupil conjugate plane, focused multiple spots (one per lenslet) onto a CCD camera. Each lenslet samples a small part of the wavefront corresponding to a certain pupil location. A regular pattern of spots would be obtained for an ideal non-aberrated eye, while the presence of aberrations produce an irregular pattern of spots. The deviations of each spot from the ideal position are linearly proportional to the derivative of the wave aberration. An array of the image shifts across the entire pupil is collected and a reconstruction algorithm is applied to obtain the wavefront. H-S has two main advantages over sequential techniques such as LRT: (1) it samples the pupil with a high fill factor, (2) high-speed (miliseconds).
INTRODUCTION
12
the ocular wavefront can be reconstructed. Because the light source is projected sequentially, LRT allows a very large dynamic range and the entire pupil can be used; however, the sequential nature makes it slow (1.5 s vs 45 ms) in comparison with H-S.
Figure 1.8. (A) Scheme of H-S. (B) Scheme of LRT
A custom-developed LRT is the technique of choice to quantify the ocular aberrations in this thesis, and the actual laboratory implementation will be described in Chapter II.
1.5.
State-of-the art of quantitative anterior segment imaging
techniques
1.5.1.
Elevation-based corneal topography
There are several techniques to measure the corneal topography: specular reflection, scattered light and Scheimpflug imaging [Mejia-Barbosa & Malacara-Hernandez, 2001].
Chapter I. INTRODUCTION
13
produces crossing points, ambiguity and inaccuracy in corneal surface analysis [Klein, 1997; Massig et al., 2005; Sicam & Van der Heijde, 2006]. In addition, Placido-disk topography does not directly picture actual corneal shape or true elevation topography.
Figure 1.9. Geometry of the optical system for corneal topography in Placido-disk. A light ray that emerges from a ring at P reflects off the cornea at Q and reaches the image plane at S following the path QNS. The meridional plane is the plane that contains the optical axis, so here the reflected ray QS is a meridional ray, whereas the incident ray PQ is a skew ray (Taken from Mejía-Barbosa and Malacara-Hernández).[Mejia-Barbosa & Malacara-Hernandez, 2001]
The scattered light technique uses the scattering phenomenon of the light when it is transmitted in an optical medium. Part of this light emerged through ocular surfaces and it is captured by an optical method. This technique is used in the slit-lamp systems (Orbscan, Bausch and Lomb, Rochester, NY, USA). The Orbscan uses two slit-lamp projectors that are calibrated at 45 deg to the right or left of the optical axis of the camera-eye system. Each slit projects 20 slit beams across the whole width of the cornea, taking about 5000 points and obtaining anterior and posterior corneal topography. However, the Orbscan is a time-consuming technique (~2 seconds) and it is sensitive to motion artifacts.
INTRODUCTION
14
Assuming that the corneal surface is given by z=f(x,y) in a Cartesian system with first and second derivaties continuous at any point, there are three ways for representing corneal topography [Sicam & Van der Heijde, 2006]:
By the surface elevationf(x,y) with respect to a reference surface (plane, sphere). A typical reference sphere is one with the minimum standard deviation with respect to the corneal surface and with the same optical axis. The best-fit sphere for calculating the topography of the cornea is calculated using a least-squares method.
By the local slopes with respect to the reference sphere since at any point on the surface the slope is a function of the direction.
By the local curvature, for a given point there is a maximum value in a certain direction and a minimum value in the perpendicular direction.
Figure 1.10. Cartesian coordinates (a point of the surface is described by three linear coordinates: x, y, z), corneal surface points and its corresponding elevation map (normal cornea).
1.5.2.
Optical Coherence Tomography (OCT)
The working principle of the Optical Coherence Tomography (OCT) is based on low coherence interferometry and is commonly performed by using a Michelson interferometer.
Chapter I. INTRODUCTION
15
Figure 1.11. Scheme of the Michelson intereferometer and the corresponding electric field in the light wave.
The functional form of the electric field in a light wave is:
Equation 1.3: 𝐸𝑖𝑛 = 𝐸0 𝑒𝑖(𝜔𝑡−𝑘𝑧0)
𝐸1= |𝐸1 |𝑒𝑖(𝜔𝑡−𝑘𝑧1) 𝑡𝑟𝑎𝑣𝑒𝑙𝑙𝑖𝑛𝑔 𝐵𝑆 − 𝑀1− 𝐵𝑆− . .. 𝐸2= |𝐸2 |𝑒𝑖(𝜔𝑡−𝑘𝑧2) 𝑡𝑟𝑎𝑣𝑒𝑙𝑙𝑖𝑛𝑔 𝐵𝑆 − 𝑀2− 𝐵𝑆− . ..
where, ω=2πυ is the angular frequency (υ, frequency of the light wave), and κ=2π/λ is the propagation constant (κ, it contains information regarding the wavelength).
Both reference and signal beams are combined at the beam splitter (BS). The output of the interferometer is the sum of the electromagnetic fields from the reference beam and the signal beam reflected from the tissue:
Equation 1.4: 𝐼 = |𝐸1+ 𝐸2|2= 𝐼1+ 𝐼2+ √𝐼1𝐼2𝑒𝑖(−𝑘𝑧1+𝑘𝑧2)+ √𝐼1𝐼2𝑒𝑖(𝑘𝑧1−𝑘𝑧2)=
𝐼1+ 𝐼2+ 2√𝐼1𝐼2cos 𝑘𝑧
A detector (S) measures the field of the optical beam. The superimposed waves produce interference fringes on the detector. These distinctive fringes enable the determination of the location at which light is reflected back and the measurement of the depth profile of the scattering amplitude. When several wavelengths are present, the output signal contains a range of frequencies with amplitudes corresponding to the intensities of the various spectral components. Fourier analysis of the signal can thus recover the spectrum of the source and accurate measurements became possible with computing functions (e.g., Fast Fourier Transform, FFT).
INTRODUCTION
16
OCT is an important biomedical imaging technique being extensively developed since the early 90s. The optical sectioning ability of the OCT was soon recognized and exploited to image in vivo microscopic structures in tissue at depths beyond conventional confocal microscopes. Compared with other imaging techniques, OCT has the following important advantages: (1) the laser source is usually infrared, so, with controlled power, it is not harmful to human tissue and comfortable for the patient; (2) the system is based on low-coherence interferometer and the resolution is limited by the low-coherence length of the laser, thus high resolution (1-10 µm) can be achieved; (3) the system can be fiber based, therefore it could be easily made compact and low cost OCT; (4) real-time imaging can be achieved; and (5) higher speed over other imaging technologies. Because of these advantages, OCT has been established as an important tool in biomedical imaging area, especially in the ophthalmology field (being now very common in the clinic).
OCT technology can be divided into two distinct groups: time-domain (TD) and spectral-domain (SD) OCT. In TD-OCT, the autocorrelation of the light field is measured directly by a mechanical axial movement of the reference mirror, which corresponds to the depth-scanning signal of the sample [Fercher et al., 1993; Huang et al., 1991; Izatt et al., 1994; Swanson et al., 1993]
.
Figure 1.12. Time-Domain OCT (adapted from T.E. Drew thesis)
Chapter I. INTRODUCTION
17
laser [Chinn et al., 1997; Choma et al., 2003; Yun et al., 2003]. Due to its higher speed (up to 1.68 MHZ) and depth range (up to 50 mm) SS-OCT is the latest milestone in ocular imaging [Grulkowski et al., 2012].
INTRODUCTION
18
OCT has been extensively used to study the retina, and less extent, in the last decade, to image the anterior segment. However, as in all optical techniques aiming at direct imaging of the posterior corneal surface and crystalline lens, images are distorted by the refraction of the rays at the cornea and lens. Also, the scanning system induces distortion, fan distortion (resulting in a combination of geometric aberrations, including field distortion, astigmatism, and spherical aberration). Correction algorithms have been recently applied to extract accurate information of the cornea [Ortiz et al., 2012a; Ortiz et al., 2010; Ortiz et al., 2009a, 2009b; Zhao et al., 2010] and the whole anterior segment [Ortiz et al., 2013; Ortiz et al., 2012b].
A custom-developed SD-OCT is the technique of choice to quantify the geometry and biometry of the anterior segment of the eye in this thesis, and the actual laboratory implementation will be described in Chapter II. Pentacam and Placido disk-based corneal topography were used in this thesis for validating OCT-based in vivo corneal topography.
1.6.
Customized eye modeling: linking geometry and aberrations
Eye models based on anatomic data have become essential to understand the link between geometrical and optical properties of the human eye. The first paraxial eye models were developed by Moser (1844), Listing (1851), Gullstrand [Gullstrand, 1909] and Le Grand [Le Grand, 1956]. Early paraxial models used spherical surfaces and focused on paraxial computations such as focal length and image locations (focal points, principal points and nodal points). However, although paraxial models serve as an approximation of the real dioptric system of the eye, those are idealized models unable to predict individual optical responses.
Geometric optics assumes that the wavelength of the light is sufficiently small, so light propagation can be described in terms of rays. The path of the rays is determined by reflection and refraction. A ray obeying Snell´s law is called real ray. Analyzing optical systems by tracing many real rays is therefore known as real ray tracing, and in terms of geometrical optics every deviation from a perfect optical system can be quantified as optical aberrations.
Chapter I. INTRODUCTION
19
Table 1.1. Summary of the features eye-models based on average population data (adapted from Sheehan thesis).
Surfaces
Lens Accomm
Domain
Model (Year) Sph Asph
On-axis Off-axis
Dispe_ rsion Age
Amet_ ropic
Gullstrand (1909) 6 - shell Yes Yes - - - -
Le Grand 4 - - Yes Yes - - - -
Emsley (1952) 1 - - - Yes - - - -
Lotmar (1971) 3 1 - - Yes Yes - - -
Drasdo & Fowler
(1974) - 4 - - Yes Yes - - -
Kooijman (1983) - 4 GRIN - Yes Yes - - -
Pomerantzeff
(1984) - 2 shell - Yes Yes - - -
Navarro (1985) 1 3 - Yes Yes Yes Yes - -
Blaker (1991) - GRIN Yes Yes - - Yes -
Smith (1992) 2 2 GRIN - Yes - - Yes -
Thibos - Indiana
(1992) - 1 - - Yes Yes Yes - -
Liou & Brennan
(1997) - 2 GRIN - Yes Yes Yes - -
Masajada &
Kasprzak (2002) 4 GRIN Yes Yes - - - -
Siedlecki (2004) - 4 GRIN - Yes - - - -
Norrby (2005) - 4 - Yes Yes Yes - Yes -
Atchison (2006) - 5 GRIN - Yes Yes Yes - Yes
Goncharov &
Dainty (2007) - 4 GRIN - Yes Yes - - -
Navarro (2007) - 4 GRIN Yes Yes Yes - Yes -
Campbell (2010) - 4 Shell Yes Yes Yes - Yes -
Rozema (2011) - 4 - - Yes - - - -
Chen (2012) 4 Shell Yes Yes - - - KC
Polans (2015) - 4 GRIN Yes Yes Yes Yes Yes -
Most of current generic eye modeling requires the assistance of ray tracing computational programs (such as ASAP (Breault Research Organization, Inc., Tucson, AZ), ZEMAX (Radiant ZEMAX; Focus software, Tucson, AZ), Code V (Optical Research Associates, Pasadena, CA) or OSLO (Lambda Research Corporation, Littleton, MA)) and optical optimization by integrating a merit function in order to approach the specific targets (e.g. best focal position and optical quality metrics).
INTRODUCTION
20
Table 1.2. Pseudophakic eye models based on ray-tracing IOL power calculation. sph=spherical; asph=aspherical.
Model (Year) Cornea IOL
Rosales et al. (2007) Barbero & Marcos (2007) Einighammer et al. (2009) Canovas et al. (2011) Zhu et al. (2011) Ribeiro et al. (2012) Fernández et al. (2013)
Placido-disk (ant) Theoretical (ant and post)
Placido-disk (ant) Placido-disk (ant)
OCT
ORBSCAN (ant and post); post-LASIK Theoretical (ant and post)
2 models (sph, asph) 2 models (sph, custom) 4 models (sph, asph, toric)
1 model Theoretical
1 model 1 model (multifocal)
Zhang et al. (2015) Theoretical (Hwey-Lan Liou) 2 models (sphr, toric)
1.7.
Anterior segment conditions and clinical applications studied in
this thesis
The measurement of the anterior segment geometry and aberrations in normal eyes is important in understanding the contribution of every optical component to retinal image quality. Still, the acquisition of accurate measurements in pathological eyes or in eyes treated with different ocular procedures is critical for the evaluation of the geometry of the optical components (cornea and implant, and crystalline lens and implant), the 3-D positioning of the implant in the eye, and finally, the contribution of the clinical solution to ocular aberrations.
1.7.1.
Cornea
(Keratoconus & Intracorneal Ring Segment (ICRS) treatment)
“I therefore held a candle at the distance of fifteen inches from the cornea, and keeping my eye in the direction of the reflected rays, I observed the variations in the size and form of the image of the candle. The reflected image regularly decreased when it passed over the most convex parts of the cornea; but when it came to the part nearest the nose, it alternately expanded and contracted, and suffered such derangements, as to indicate the presence of a number of spherical eminences and depressions, which sufficiently accounted for the broken and multiplied images of luminous objects…” J. Wardrop. “Essays on the Morbid Anatomy of the Human Eye”, 1808 [Wardrop, 1808]
Keratoconus derives from the Greek words Kerato (cornea) and Konos (cone) and it is a corneal condition affecting primarily young patients with a prevalence about 1 per 2000 in the general population, being this prevalence 6 times greater in India [Gokhale, 2013]. It is caused by the progressive and asymmetric weakening of corneal tissue, in which gradual thinning lead to a cone-like appearance of the cornea, manifesting irregular astigmatism, myopia and high levels of high-order aberrations.
Chapter I. INTRODUCTION
21
deformed corneas cannot be assessed precisely because of inherent limitations of the imaging techniques (e.g., resolution or acquisition time) or aberrometers (e.g., dynamic range).
1.7.1.1.
Keratoconus: topography and pachymetry
The characteristic changes in both anterior and posterior corneal surfaces leads to changes in corneal thickness, which can be assessed by means of corneal topography and pachymetry. In most keratoconic patients, the anterior corneal topographic map is characterized by focal steepening with a dioptric power greater than 46 D, corneal thinning and astigmatism. The cone vertex is typically displaced toward the lower mid-peripheral region in either the nasal and temporal quadrant. There is usually a vertical asymmetry with a certain diagonal angle. All of these topographic and pachymetric alterations in keratoconus appear as a consequence of the biomechanical changes that occur in the corneal structure [Meek et al., 2005]. The topographical pattern is usually similar in both eyes, although one of them may show a more advanced state [Nordan, 1997; Rabinowitz, 1998].
For early keratoconus diagnosis, different descriptors based on anterior corneal topography were developed during the 90s with the first videokeratographers: central corneal power (central K: descriptive of central steepening), Inferior-Superior values (I-S dioptric asymmetry), surface asymmetry index (SAI), specific index quantifying irregular astigmatism (SRAX, skewed radial axis) and KISA% index [Li et al., 2009; Maeda et al., 1994; Rabinowitz, 1995].
The development of new commercial imaging techniques (Orbscan II and Pentacam Scheimpflug camera) and the advance in new surface detection algorithms has made possible the topographic analysis of the posterior cornea. Tomidokoro et al. [Tomidokoro et al., 2000] reported that irregular astigmatism of the posterior corneal surface is one of the first sign of keratoconus; Chen and Yoon [Chen & Yoon, 2008] showed that the posterior corneal surface was significantly more irregular than the anterior corneal surface in keratoconus. Regarding corneal pachymetry, significant differences have been reported between normal subjects and keratoconus, showing also differences across different keratoconus stages [Rabinowitz et al., 1998]; and Saad and Gatinel [Saad & Gatinel, 2010] showed that corneal thickness and curvature measurements over the entire cornea centered on the thinnest point are valid metrics for diagnosing earlier keratoconus stages.
However, some studies reported poor repeatability and variability in the analysis of keratoconus using Orbscan and Pentacam (especially in the posterior corneal surface), being this variability possibly associated to interpolation errors attributable to meridional sampling approaches, relatively long acquisition times, and errors in optical distortion correction, particularly challenging with highly deformed corneas [Read et al., 2009; Shankar et al., 2008].
INTRODUCTION
22
mapped the corneal epithelial thickness [Li et al., 2012]. Karnowski et al. [Karnowski et al., 2011] showed 3-D quantitative corneal analysis in a keratoconic subject based on SS-OCT. Nakagawa et al. [Nakagawa et al., 2011] measured forty keratoconic eyes and showed good agreement between OCT and Pentacam. And, Szalai et al. [Szalai et al., 2012] compared anterior segment measurements (anterior and posterior corneal radius, corneal thickness and anterior chamber depth) between SS-OCT and Scheimpflug in normal and keratoconus and found statistically significant differences between instruments in all parameters. As we described in section 1.5.2., OCT images are generally subject to distortions. Because of these distortions, OCT images need to be corrected for an accurate quantification. To date, the only study showing 3-D quantitative keratoconus properties using OCT after full distortion correction was performed in our group by Ortiz et al. [Ortiz et al., 2012a], on a single patient.
1.7.1.2.
Keratoconus: aberrations
The progressive distortion of the cornea leads to abnormal corneal topography and results in irregular astigmatism, progressive myopia and increased high-order aberrations, with consequent loss of vision. Previous studies based on H-S [Maeda et al., 2002] and LRT [Barbero et al., 2002a] ocular aberrometry showed differences between normal and keratoconic eyes, being approximately 5.5 times higher in keratoconus. Both studies found significant high values in astigmatism and coma (particularly, vertical coma). Maeda et al. [Maeda et al., 2002] reported that coma-like aberrations were 2.32 times larger than spherical-like aberrations in keratoconic eyes. Trefoil, tetrafoil and secondary astigmatism terms were also higher and variable in keratoconus [Alio et al., 2011; Alio & Shabayek, 2006; Barbero et al., 2002a; Maeda et al., 2002].
Although the anterior corneal surface supposes the dominant factor to corneal aberrations, posterior corneal aberrations have a remarkable implication in ocular aberrations, especially in keratoconus. However, few studies measured the contribution of the anterior and posterior corneal surfaces to total aberrations. Chen and Yoon [Chen & Yoon, 2008] (using Orbscan) demonstrated stronger compensation effects of the posterior corneal surface in keratoconus than in a normal population (around 20% of anterior corneal astigmatism and coma). Nakagawa et al. (using Pentacam) showed that the axes for coma in the anterior (63.6 deg) and posterior (241.9 deg) surfaces were in opposite directions. Piñero et al. [Pinero et al., 2009a] (using Pentacam) showed higher levels of aberrations (particularly for coma-like aberrations) in the posterior corneal surface when compared with the anterior corneal surface in normal and keratoconus eyes.
1.7.1.3.
Keratoconus treatment: Intracorneal Ring Segments (ICRS)
Chapter I. INTRODUCTION
23
thesis we make use of our custom-developed LRT and OCT methodology to evaluate the ICRS treatment (Chapter III).
ICRS are PMMA segments with variable form (triangular, hexagonal and oval), arc length and width, and are inserted to the cornea through a manually [Colin et al., 2000] or femtosecond laser [Shabayek & Alio, 2007] made channel in the corneal stroma according to empirical nomograms, in one or two sides of the pupil.
ICRS act as spacer elements between the bundles of corneal lamellae, inducing shortening of the central corneal arc length and, as consequence, producing a flattening of the anterior cornea. Furthermore, ICRS are expected to increase the biomechanical stability and to improve the optical quality of the cornea by increasing corneal symmetry [Colin et al., 2000; Pinero et al., 2009b; Vega-Estrada et al., 2013].
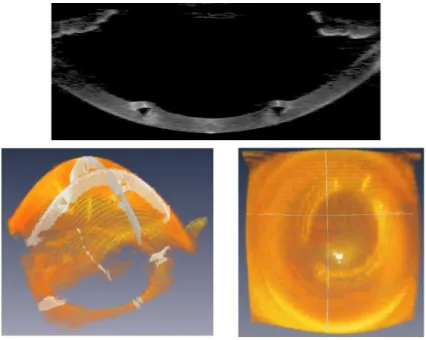
Figure 1.14. (Top) OCT cross sectional image showing the ICRS inside the cornea. (Bottom) 3-D illustration of ICRS inside the cornea (obtained with OCT and illustrated with AMIRA software).
Assessment of ICRS implantation has been performed using different imaging techniques including slit scanning corneal topography [Dauwe et al., 2009], Scheimpflug imaging [Torquetti & Ferrara, 2010], ultrasound biomicroscopy [Reinstein et al., 2010; Reinstein et al., 2001] and OCT [Gorgun et al., 2012; Ortiz et al., 2012a]. Additionally, few studies in the literature have examined aberrations in keratoconic patients implanted with ICRS.
INTRODUCTION
24
increase of 2.5% to a decrease of 18% in the topographic K-values after 90 days ICRS implantation [Shabayek & Alio, 2007]). The only previous study investigating the posterior corneal surface in corneas implanted with ICRS reported a significant flattening of approximately 0.25 mm using Scheimpflug imaging [Sogutlu et al., 2007].
Dauwe et al. [Dauwe et al., 2009] suggested that thickness redistribution after ICRS implantation might be a delay factor in keratoconus progression, since as the cornea thickens in the weakened areas, the stress may be redistributed and the decompensatory keratoconus cycle might be delayed. However, this hypothesis has not been yet demonstrated. In fact, there is controversy on the long-term effects with some studies showing stabilization [Torquetti et al., 2014; Vega-Estrada et al., 2013] and others regression [Alio et al., 2014; Vega-Estrada et al., 2015] after ICRS surgery.
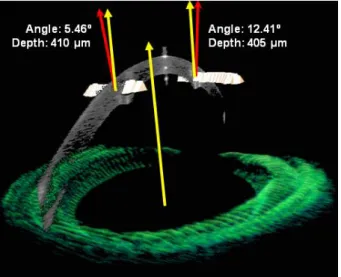
Potential changes in the expected ICRS depth have been associated to post-surgical complications. Rotation or migration of the ICRS post-surgery has been described as consequence of the physiological stress and the wound healing response [Perez-Merino et al., 2010]. Naftali and Jabaly-Habib [Naftali & Jabaly-Habib, 2013] using commercial OCT reported significant differences between the planned and measured ICRS depth (~120 µm), although part of this discrepancy might be due to the inherent distortion associated to OCT. Recently, Ortiz et al. [Ortiz et al., 2012a] measured accurately the location of ICRS in 3-D using distortion-corrected OCT.
Figure 1.15. OCT 3-D in vivo positioning of the ICRS inside the cornea (orientation and depth). [Ortiz et al., 2012a]
Chapter I. INTRODUCTION
25
ICRS) and of anterior corneal HOAs (3.73±1.97 µm preoperative, 3.24±1.44 µm post ICRS) 3-months post ICRS implantation, for 6-mm pupils. In contrast, Chalita and Krueger [Chalita & Krueger, 2004] reported an increase in ocular HOA in the ICRS-implanted eye, when compared to the non-treated fellow eye.
Quantitative image-based and aberrometry techniques are helpful to evaluate objectively the performance of ICRS, but different studies also proposed analytical or numerical methods to model the response of the cornea to the ICRS and improve the implantation nomograms [Dauwe et al., 2009; Kling & Marcos, 2013; Pinsky et al., 2005]. These studies suggested a linear relationship between refractive change and ICRS height (the higher, the more effective) and optical zone (the smaller, the more effective).
1.7.2.
Crystalline lens
(Accommodation, Presbyopia, Cataract)
With age, two crucial features of the crystalline lens decline due to biochemical and biophysical changes. A progressive loss of transparency is accompanied by a fall in the rate and amplitude of accommodation. The latter is the basis of presbyopia, which reaches its top by the age of 50. The biochemical and cellular changes that result in the loss of transparency are known as cataract.
1.7.2.1.
Accommodation
Accommodation is the dioptric change in power of the eye to provide clear and sharp retinal image for all distances, accommodation is also often described as being linked with convergence and pupil constriction. The primary stimulus for accommodation is blur vision, with lesser roles played by apparent perceived distance, chromatic aberration, non-symmetric aberrations and spherical aberration [Atchison, 1995; Charman, 2008].
When the young eye is relaxed and focused for distance, the ciliary muscle is relaxed, resting tension on the zonular fibers spanning the circumlental space and inserting around the lens equator apply an outward directed tension around the lens equator through the lens capsule to hold the lens in a relatively flattened and relaxed state. During accommodation, the ciliary muscle contracts, the inner apex of the ciliary muscle moves forward and towards the axis of the eye. This inward movement of the apex of the ciliary muscle stretches the posterior attachment of the ciliary muscle relaxing the tension on the zonular fibers and changing the crystalline lens geometrical properties (by increasing the convexity of its surfaces). The lens capsule provides the force to cause the lens to become accommodated. During accommodation, lens diameter decreases, lens thickness increases, anterior and posterior lens radii become steeper and anterior chamber depth decreases. In addition to the dioptric changes due to curvature and axial variations, a modification in the refractive index gradient was also found [Garner & Smith, 1997]. These changes overall contribute to 10-15 D of accommodative amplitude in the young adult eye, diminishing to <2 D by middle age [Ostrin & Glasser, 2004].