SERIE DOCUMENTOS DE TRABAJO
No. 105DOCTORS’ REMUNERATION SCHEMES AND HOSPITAL COMPETITION
IN TWO-SIDED MARKETS WITH COMMON NETWORK EXTERNALITIES
David Bardey
Helmuth Cremer
Doctors’ remuneration schemes and hospital competition
in two-sided markets with common network externalities
1David Bardey2, Helmuth Cremer3
and Jean-Marie Lozachmeur4
February 2011, revised July 2011
1We thank Bruno Jullien, Pauline Chauvin, Damien Echevin, Bas Jacobs, Izabela Jelovac, Albert Ma and Sander Renes for their comments and suggestions. We gratefully acknowledge the …nancial support of the Fondation du Risque (Chaire Santé, Risque et Assurance, Allianz). The …ndings, recommendations, interpretations and conclusions expressed in this paper are those of the authors and not necessarily re‡ect the view of the Department of Economics of the Universidad del Rosario.
2University of Rosario (Bogota, Colombia) and Toulouse School of Economics (France). 3Toulouse School of Economics (IDEI and GREMAQ-CNRS). Corresponding author: Hel-muth Cremer, Manufacture des Tabacs, 21 Allée de Brienne, 31000 Toulouse (France). Email: helmuth@cict.fr, tel: +33 (0)5 61 12 86 06, fax: +33 (0)5 61 12 86 37.
Abstract
This paper uses a two-sided market model of hospital competition to study the im-plications of di¤erent remunerations schemes on the physicians’ side. The two-sided market approach is characterized by the concept ofcommon network externality (CNE) introduced by Bardeyet al. (2010). This type of externality occurs when occurs when both sides value, possibly with di¤erent intensities, the same network externality. We explicitly introduce e¤ort exerted by doctors. By increasing the number of medical acts (which involves a costly e¤ort) the doctor can increase the quality of service o¤ered to patients (over and above the level implied by the CNE). We …rst consider pure salary, capitation or fee-for-service schemes. Then, we study schemes that mix fee-for-service with either salary or capitation payments. We show that salary schemes (either pure or in combination with fee-for-service) are more patient friendly than (pure or mixed) capitations schemes. This comparison is exactly reversed on the providers’ side. Quite surprisingly, patients always loose when a fee-for-service scheme is introduced (pure of mixed). This is true even though the fee-for-service is the only way to induce the providers to exert e¤ort and it holds whatever the patients’ valuation of this e¤ort. In other words, the increase in quality brought about by the fee-for-service is more than compensated by the increase in fees faced by patients.
Jel codes: D42, L11, L12.
1
Introduction
Health care system in developed countries face a number of challenges. First, there is
the achievement or consolidation of universal access. Second, there is a strong concern
about the level of health care quality delivered to patients. Third, the increasing health
care costs observed in most countries defy the sustainability of health care systems.
Consequently, cost control has become a prominent issue. In this paper we deal with
the last two issues which, as eloquently pointed out in Newhouse (1996), are often in
con‡ict.
This potential trade-o¤ between quality and cost control has been widely examined
in the literature. On one hand, many papers compare the incentives generated by
di¤er-ent remuneration schemes for providers. More precisely, it is studied how remuneration
schemes a¤ect providers’ output, typically measured by health care quality and by the
number of patient consultations (Devlin and Sarma, 2010). It is usually recognized that
providers are encouraged to provide more services under a fee-for-service scheme, than
under other remuneration schemes, such as capitation payment or salary1. On the other
hand, in order to lower the health care costs and to encourage health care quality,
dif-ferent countries have experimented ongoing reforms that stimulate competition (Brekke
et al., 2009). Several authors have tried to assess the impact of competition on health
care quality. While theoretical studies usually predict a positive impact of competition
on health care quality, the empirical literature leads to more mitigated results.2
From a methodological perspective, the …rst strand of literature analyzes
remu-neration schemes within a principal-agent framework, while the second uses imperfect
competition models to examine the relationship between of competition and health care
quality.3 Right now, there exists a gap between these two approaches and the interplay
1See for instance Carlsen and Grytten (2010).
2See for instance Ma and Burgess (1993), Gravelle (1999) and Brekke, Nuscheler and Straume (2007).
The empirical literature is surveyed by Gaynor (2006).
between competition on the one hand, and the incentive properties of remuneration
schemes on the other hand does not appear to be well understood. In this paper, we
use a two-sided market approach in order to bridge this gap, at least in part4. More
precisely, we consider a duopoly situation between two for-pro…t hospitals where the
competition is twofold. On one side, hospitals compete to attract patients; on the other
side, to a¢liate doctors. Patients are sensitive to price, to the number of consultations
and to the health care quality delivered by hospitals. Doctors are also sensitive to the
quality delivered to patients, in a general way, to the …nancial transfer paid by
hospi-tals and more speci…cally to the number of consultation when hospihospi-tals use, at least
partially, a fee-for-service scheme.5
Our two-sided approach is based on the concept of common network externality
(CNE) introduced by Bardey et al. (2010). It is used to represent the health care
quality delivered by a hospital and a¤ect utility of both patients and doctors. It is
a well established fact that the quality of health care delivered in hospitals depends
on the doctors’ “workload”. This is documented, for instance, by Tarnow-Mordi et
al. (2000) who use UK data to show that variations in mortality can be explained
in part by excess workload in the intensive care unit. Accordingly, health care quality
is frequently related to the doctor/provider ratio; see Mc Gillis Hall (2004). In other
words, it increases when the number of health care professionals increases (for a given
number of patients), but decreases when the number of patients increases (for a given
number of providers). In this paper, we adopt a quite general expression for the quality
provided by hospitals. We continue to assume that quality always increases in the
number of doctors. However, no assumption about the patients’ impact on the CNE
particular, they study how providers select the health care organization they work for according to the remuneration schemes they adopt.
4In fact, Ma and Riordan (2003) consider a competitive environment and analyze providers’
remu-neration schemes. The di¤erence with our paper is that they do not have network externalities that reinforce the interplay between competition and incentives.
5In reality many hospitals are not for pro…t. It would be interesting to extend our analysis to mixed
is needed. We do not rule out the possibility that it can also increases in the number
of patients for low values because of a “learning-by-doing e¤ect”. For larger patients’
numbers, on the other hand, the congestion e¤ect can be expected to dominate (and
we return to the negative relationship between number of patients and quality). In all
cases, both sides bene…t from a higher quality albeit for di¤erent reasons and possibly
with di¤erent intensity. This is quite obvious on the patients’ side, where one can expect
a higher quality to translate into a improvement in patients’ health state (or at the very
least into a reduction in waiting lines for appointments,etc...). Physicians bene…t from
a higher quality through a reduction in their workload,6 or indirectly, through their
altruism (or simply job satisfaction).7 This quality index can also be interpreted as a
proxy that indicates how binding is the time constraint of the providers who work for an
hospital. Consequently, it can be viewed as a determinant of the consultation duration
received by patients.
We depart from the setting of Bardeyet al. (2010) by introducing e¤ort exerted by
doctors. Speci…cally, this e¤ort is measured by the number of additional consultations.
The idea is that by increasing the number of medical acts (which involves a costly e¤ort)
the doctor can increase the quality of service o¤ered to patients (over and above the
level implied by the CNE). More precisely, as doctors must receive a given number of
patients in a certain time interval, they can increase the time devoted to each patient
by increasing the number of consultation in their extra-time.8
The general remuneration scheme we de…ne includes a salary, a capitation payment
and a fee-for-service component. On the patients’ side, we concentrate on the case with
a …xed fee. In a …rst step, we consider pure payment schemes. Not surprisingly, we
…nd that the number of consultation is higher under a fee-for-service scheme than under
6See for instance Fergusson-Paré (2004) for the nursing workload. Gri¢n and Swan (2006) also …nd
a strong relationship between nurses’ workload and quality of health care.
7See, Liu and Ma (2010).
other schemes. As a matter of fact, when providers are remunerated solelyvia a salary
or a capitation payment, they provide the minimum level of e¤ort. Under salary and
capitation schemes, hospitals obtain the same pro…t at equilibrium. Patients pay a lower
price and providers are less remunerated when providers receive capitation payments
rather than salary schemes. In other words, a capitation payment scheme favor patients
while providers are better o¤ under a salary scheme. Next, in spite of the fact that
patients value positively the number of consultations, our results suggest that patients
are worse o¤ when providers are paid via a fee-for-service rather than under a salary
scheme. We show this analytically for the case when the number of acts provides only
small bene…ts to patients. For larger levels of bene…ts, numerical simulations appear to
corroborate this result. Surprisingly, we …nd that hospitals’ pro…t may be higher when
providers are remunerated via a fee-for-service scheme rather than under a capitation
payment or salary.
Second, we consider payment schemes mixing fee-for-service with either salary or
capitation payments. We show that in both cases, hospitals set the fee-for-service rate
just equal to the patients’ valuation of doctors’ e¤ort. Consequently, an e¢cient level
of e¤ort is achieved and total welfare is maximum. Nevertheless, the introduction of a
fee-for-service along with either a wage or a capitation scheme always reduces patients’
welfare, while doctors’ welfare is enhanced. Exactly like in the pure remuneration case,
the presence of a capitation element favors patients, while a salary term favors doctors.
The paper is organized as follows. Section 2 presents the set-up. Section 3 provides
equilibrium conditions under general payment schemes. Pure salary and capitation
schemes are considered in Section 4, while a pure fee-for-service system on the providers’
2
The model
Consider two hospitalsj =f1;2glocated at both endpoints of the Hotelling’s line. They compete for patients (group P of mass 1) on one side and for physicians or doctors
(group Dof massm) on the other side.9 Both groups are uniformly distributed over an
interval of length 1. The utilities of both groups exhibit quadratic transportation costs with parameterstP and tD respectively.10
Letni
j denote theshare of typei=P; Dindividuals a¢liated with hospitalj= 1;2,
while Ni
j denotes thenumber of a¢liates. With our normalizations, we have NjP =nPj
andND
j =mnDj . The two-sided market representation we adopt is based on the concept
of “common network externality” with the following de…nition:
De…nition 1 (Bardey et al., 2010) A common network externality, described by the
function qj ='(NjP; NjD); occurs when both sides value, possibly with di¤erent
intensi-ties, the same network externality.
This network externality is one of the determinants of the quality o¤ered by a
hos-pital. An important feature of this de…nition is that the functional form 'is the same
on both sides (for instance qj can represent simply the patient/doctor ratio). In other
words, patients and doctors agree on theranking of quality levels but they may di¤er in
the intensity of preferences. We assume@'=@ND
i >0so that quality increases with the
number of doctors. Even though doctor/patient ratio illustration is useful for the sake
of interpretation, we consider a more general assumption concerning how the number of
patients a¤ect the quality. Indeed, we assume @'=@NiP <0 for su¢ciently large levels of and NiP, but @'=@NiP > 0 is not ruled out for small patient numbers. These as-sumptions onqj allow us to capture that for su¢ciently large patient numbers quality is
9We shall refer to members of group D indistinctively as (health care) providers, physicians or
doctors.
negatively related to the doctors’ workload, while for small it may be positively related
to patient numbers because of a learning-by-doing e¤ect.11
The utility of a patient, located atz, who patronizes hospitaljand faces a total bill
ofKj (a …xed fee) is given by
V =V +Qj Kj tP(z xj)2; (1)
where V is a constant, while Qj is a quality index.12 This quality index consists of two
elements. The …rst one is the common network externality which, as explained above,
depends on the relative number of patients and providers a¢liated to this hospital. We
can think about this term as representing the intrinsic quality o¤ered by hospital j.
The second element depends on the physician’s e¤ort which, for simplicity, is measured
by the number of medical acts consumed by each patient. Formally, we have
Qj = qj+ ej;
where and represent preference intensities for intrinsic qualityqj and for the number
of medical acts measured by the e¤ort variable ej. This “congestion e¤ect” can be
understood by taking into account the doctor’s time constraint. In a given length of
time, a doctor has to see a certain number of patients; this determines the duration of
the visit, proxy of the qualityqj provided by hospital j. However, this congestion e¤ect
is reduced when the physician increases the number of visits, which in turn requires extra
e¤ort (longer working hours). This e¤ect is captured by the variableej. Observe that,
qjandejare substitutes. In other words, a low level of qualityqjcan be compensated by
a higher number of medical acts. The value taken of may di¤er according to the type
of disease that is considered. For all non chronic diseases, we can expect to be close to
0. Roughly speaking, for diseases which do not require a special attention from doctors,
1 1The characterization of the various equilibria we study does not depend on the sign of@'=@NP
i .
1 2As most of patients may bene…t from an health insurance plan, the priceP
jcan be interpreted as
the patient’s out-of-pocket payment to hospitalj. Our analysis remains valid under this interpretation
patients prefer to bene…t from a longer consultation than to have the same duration of
consultation split into shorter meetings. On the contrary, for chronic diseases, patients
may prefer to bene…t from the same duration spread over several consultations.
The utility of a physician, located aty, and working for hospitalj is given by
U =U + qj+Tj tD(y xj)2 (Ej); (2)
whereU is a constant, is the preference for qualityqj, while Tj denotes the
remuner-ation paid by hospital j to its providers. The term (Ej) corresponds to the disutility
of e¤ort. For simplicity, we assume a quadratic disutility of e¤ort throughout the paper
so that (Ej) = Ej2=2. A doctor’s total e¤ort Ej is given by his e¤ort per patient ej
times the number of patients. The parameters V and U are assumed to be su¢ciently
large to ensure full coverage on both sides of the market.
The total remuneration of a physicians working for hospital j, treating nP
j =(mnDj )
patients and realizing an e¤ortej per patient (and a total e¤ortEj =njP=(mnDj )ej) is
given by
Tj =wj +dj
nPj mnD
j
+ cjn
P j
mnD j
ej;
In words, it may include a …xed salary wj 0, a capitation payment dj 0 and a
fee-for-service ratecj 0.
The strategic players in our setting are the hospitals which simultaneously choose
their price structures(Kj; Tj(wj; dj; cj)). These prices induce an patient-doctor
alloca-tion such that each patient and doctor joins his preferred hospital, and with the doctor’s
e¤ort,ej, chosen according to
ej 2arg max
cjnPj
mnD j
ej (
nP j
mnD j
ej);
which (using the quadratic speci…cation of ) yields
ej = mn
D j
nP j
Not surprisingly, ej increases with the fee-for-service rate cj which is in line with the
supply induced demand literature.13 Furthermore, cj = 0 implies ej = 0. E¤ort is
costly, but does not give any direct bene…ts to providers. Consequently, a positive
e¤ort level can only be achieved through …nancial incentives.14 It is worth noticing that
our set-up is somewhat biased towards fee-for-service remuneration scheme (at least as
long as > 0). This is because, additional consultations contribute positively to the total quality perceived by patients and it is necessary to have a strictly positive
fee-for-service rate to ensure additional consultations. It is important to keep this in mind
when interpreting our results obtained later on. In particular, we show that, in spite of
this optimistic view of the fee-for-service remuneration, the introduction (or addition)
of a fee-for-service element always makes patients worse of in a two-sided competition
setting.
As both sides are fully covered, demand levels are equivalent to market shares.
De…ning the quality di¤erential between hospitals as
g nP1; mnD1 =' nP1; mnD1 ' 1 nP1; m(1 nD1 ) =q1 q2;
in our Hotelling’s set-up, the demand functions are
nP1 =1 2 +
1 2tP
g nP1; mnD1 + (e1 e2) (K1 K2) ;
nD1 =1 2 +
1 2tD
g nP1; mnD1 +w1 w2+d1 n
P
1
mnD
1
d2 (1 n
P
1)
m(1 nD
1 ) + c1n
P
1
mnD
1
e1 n
P
1
mnD
1
e1 c2(1 n
P
1)
m(1 nD
1 )
e2 n
P
1
mnD
1
e2 :
1 3More precisely, the supply induced demand theory states that physicians bene…t from asymmetric
information (derived from their diagnosis). Consequently, they can select the number of medical acts provided in order to maximize their own utility. In that context, the number of acts increases with the fee-for-service rate when the price e¤et dominates the income e¤ect. This is the case in our setting because with quasilinear preferences the income e¤ect is zero.
1 4Doctors are also sensitive to health care quality delivered to patients through the CNE’s component
Using (3) to substitute for the e¤ort levels chosen by the providers yields
nP1 =1 2+
1 2tP
(
g nP1; mnD1 + c1
mnD
1
nP
1
c2
m 1 nD
1 1 nP
1
!
(K1 K2)g; (4)
nD1 =1 2+
1 2tD
g nP1; mnD1 +w1 w2
+d1 n
P
1
mnD
1
d2 (1 n
P
1)
m(1 nD
1) +1
2
h
(c1)2 (c2)2i : (5)
The derivatives of these demand functions with respect to the parameters of the pricing
functions, namely Kj on the patients’ side and wj; dj and cj are stated in Appendix
A. There and in the remainder of the paper subscripts are used for the derivatives of
g, which are denotedgP andgD. The expressions provided in the Appendix imply that
dnP1 dd1 =
1
m dnP1 dw1;
dnD1 dd1 =
1
m dnD1
dw1: (6)
In words, equation (6) states that salary and capitation fee a¤ect demand behavior on
both sides in a similar way; the respective derivatives are simply proportional to each
other (according to their relative mass).
3
Equilibrium: general expressions
Our main objective is to compare the implications of di¤erent remuneration and pricing
schemes. To do so, we shall successively consider the di¤erent instruments in isolation
or in various combinations. To avoid repetitions, we shall start by considering the
general problem obtained whenallinstruments are available. Though somewhat lengthy
and tedious the expressions so obtained are convenient to generate the special cases
considered in the remainder of the paper.
Hospital j maximizes its pro…t functions with respect to Kj; cj; dj and wj.
maximizing 1 with respect toK1 and T1 where pro…t is de…ned by15
1 = nP1 (K1; K2; T1; T2; ) (K1 d1 c1e1) mw1nD1 (K1; K2; T1; T2; ); = nP1 (K1; K2; T1; T2; ) [K1 d1] mnD1 (K1; K2; T1; T2; ) c21+w1 : (7)
Di¤erentiating with respect to the pricing parameters and setting nP
1 = nD1 = 1=2 in the resulting expressions shows that the following conditions hold in a symmetric
equilibrium.
@ 1 @K1 =
1 2+
@nP
1
@K1 [K1 d1] m @nD
1
@K1 c
2
1+w1 = 0; (8)
@ 1
@w1 = [K1 d1] @nP
1
@w1 m
2 m
@nD
1
@w1 c
2
1+w1 = 0; (9)
@ 1
@c1 = @nP1
@c1 [K1 d1] m c
2 1+w1
@nD1 @c1 2c1
m
2 = 0; (10)
@ 1 @d1
= 1 2+
dnP
1
dd1
[K1 d1] c2
1+w1 m
dnD
1
dd1
= 0: (11)
Not surprisingly, it follows from (6) that
@ 1 @d1 =
1
m @ 1 @w1:
Consequently, if hospitals use simultaneously capitation payment and salary to
remuner-ate doctors, we have a continuum of symmetric equilibria. This issue has been discussed
in Bardeyet al. (2010).16 In this paper, we refrain from dealing with the complexity of
equilibria multiplicity. Instead, we concentrate on studying the equilibrium allocations
obtained under di¤erent type of providers’ remuneration schemes. Our main focus will
be on schemes that involve a fee-for-service, possibly in combination with capitation
of salary payments. In a …rst step, we will report the equilibria under (pure) wage or
1 5It is worth noticing that even if we would have a regulated price on patients’ side, as it can be the
case in several health care systems, it does not change the two-sided mechanism competition at work in our model. Indeed, even though we would have a regulated price on patients’ side, the patients’ demand would still depend on transfers paid to doctors, maintaining the two-sided mechanism.
capitation scheme which constitute interesting benchmarks. Observe that when there
is no fee-for-service (c = 0) we have e= 0 and we return essentially to the setting of Bardey et al. (2010) who do already characterize the equilibria under wage and
capita-tion schemes. To make this paper self-contained, we shall restate the main results we
need for the purpose of comparison. We shall refrain from repeating the proofs as well
as the discussion and intuition except when they are directly relevant for our analysis.
4
Pure salary and capitation schemes
Assume …rst that the hospitals use a salary scheme for providers, combined with a …xed
payment for patients.17 The symmetric equilibrium is then obtained by solving (8) and
(9) after setting c= 0and using the expressions for the demand derivatives provided in Appendix A. It is described in the following proposition.
Proposition 1 (Bardey et al., 2010)When hospitals useKj andwj as sole instruments
the symmetric equilibrium is given by
K1w = tP
1
2( +m )gP; (12)
ww1 = tD+
1
2( +m )gD; (13)
and hospitals realize a pro…t of
w = mtD+tP
2
( + m) (gP +mgD)
4 : (14)
Observe that gP and gD are evaluated at n1P =nD1 = 1=2, so that this proposition
provides a closed form solution.
Turning to the case where hospitals useKj and dj, solving (8) and (11) establishes
the following proposition.
Proposition 2 (Bardey et al., 2010)When hospitals useKj anddj as sole instruments
the symmetric equilibrium is given by
Kjd = mtD 2 +tP
1
4( + m) (2gP +mgD); (15)
ddj = mtD 2 +
1
4m( + m)gD: (16)
and hospitals realize a pro…t of
d= mtD+tP
2
( + m) (gP +mgD)
4 :
Notice that dd
j is exactly equal to mwjw=2. In other words, the total remuneration
received by providersTd
j =ddj=mis half of the remuneration achieved in the salary game,
namelyTw
j =wjw. To understand why capitation payment leads to lower compensations,
let us start from the equilibrium salaryww. By de…nition, this salary level is such that no
hospital can gain by decreasing its salary given the salary o¤ered by the other platform.
Now, when the capitation payment level is the strategic variable, a decrease in a say
d1 induces (for a given level of d2) a reduction in compensation o¤ered by hospital 2 (because some providers move to hospital2). This implies that a reduction ind1 (given
d2) is bene…cial, even though a reduction inw1(givenw2) is not. Interestingly, the price
level is also smaller with the capitation payment scheme. To see this, combine (15) and
(12) to obtain Kd
j = Kjw (m=2)ww. Intuitively, we can once again start from the
equilibrium under salary schemes. By de…nition, hospital1 cannot gain by decreasing its price given K2 and w2. Under the capitation payment regime, a reduction in K1
brings about a reduction in the compensation (per provider) paid by hospital2(because some patients move from hospital2 to hospital1). This in turn mitigates the negative e¤ects of a decrease in the price and implies that a unilateral price decrease is bene…cial
The main features of the comparison between salary and capitation scheme are
summarized in the following proposition.18
Proposition 3 Comparing the equilibria achieved under salary and capitation
pay-ments shows that
i) ew = ed = 0: in both cases, doctors have no incentives to exert e¤ort (increase
the number of medical acts)and set eat its minimum level.
ii) Tjd < Tjw and Kjd < Kjw: patients pay a lower price and providers a lower
remuneration under a capitation payment than under a salary scheme.
iii) Vd > Vw and Ud < Uw for all z: all patients are better o¤ and all providers
worse o¤ under capitation then under wage schemes.
iv) w
j = dj: hospitals’ pro…ts are the same under both remuneration schemes.
The heath economics literature has extensively dealt with the relative merits of
payment schemes and speci…cally their incentive properties. A point that is often made
is that ‡at payment schemes (as opposed to fee-for-service schemes) have the advantage
of providing stronger incentives for cost reduction.19 Our results are in line with this
conventional wisdom albeit in a somewhat trivial way. Speci…cally, we …nd that both
payment schemes provide the same incentives to limit the number of medical acts as
much as possible. Finally, since a switch from salary to capitation scheme decreases
both patients’ pay and doctors’ remuneration, the impact on hospitals’ pro…ts is a
priori ambiguous. In our speci…c setting the two e¤ects happen to cancel out exact so
that pro…ts are the same under the two schemes; we simply have a transfer of rents from
providers to patients. This result is due to the assumption the market fully covered on
both sides which implies that hospitals compete in a “business stealing” model. When
the CNE is simply determined by the doctor/patient ratio, the term gP+mgD is equal
1 8Items i), ii)andiv)follow directly from Propositions (1) and (2). Itemiii) follows fromi)andii),
making use of (1) and (2), the speci…cation of patients’ and doctors’ utilities.
1 9See, for instance, Gosden et al.(1999) for a review of the literature on the remuneration of health
to 0 and hospitals’ pro…ts do not depend on the common network externalities (see Bardeyet al., 2010). This is because the negative externality generated by patients and
the positive one due to doctors exactly cancel each other out. In other words, their
pro…ts are be the same as in a Hotelling game without network externalities.
5
Pure fee-for-service schemes
We now turn to the case where hospitals use a fee-for-service rate on the doctors’ side,
while patients continue to pay a …xed fee. The hospital’s relevant …rst-order conditions
are now equations (8) and (16). The symmetric equilibrium achieved in the case is
described in Proposition 4, which is established in Appendix B.
Proposition 4 When hospitals useKj and cj as sole instruments the symmetric
equi-librium is described by
K1c = tP
1
2[( + 2m )gP 4mc
c
1 ] +
gPm
2cc
1
;
(cc1)2 = 2tD+
1
2[( + 2m )gD+ 4c
c
1 ] + cc
1
tD
mgD
2 ;
and hospitals realize a pro…t of
c= 1
2 tP + 2mtD 1
2[( + 2m ) (gP +mgD)]
m cc
1
tD
(mgD+gP)
2 :
While we were able to obtain closed-form solutions under wage and capitation
schemes, this is no longer possible with a pure fee-for-service scheme. Accordingly,
the prices reported in Proposition 4 are implicitly de…ned as functions of cc
1. This makes their interpretation more di¢cult. An observation that can easily be made at
this point is that hospitals’ pro…ts increase with the fee-for-service rate. However, this
is a relationship between two endogenous variables which has to be interpreted with
Closed form solutions continue to be available in the special case where = 0. In this situation,ecan be interpreted as a pure induced demand e¤ect. Indeed, withc >0 and = 0, doctors exert a positive level of e¤ort (increasing the number of acts) to increase their remuneration, but this does not induce any bene…ts to patients. The
equilibrium in this case is stated in the following corollary, which follows directly from
Proposition 4.
Corollary 1 Assume = 0. When hospitals use Kj and cj as sole instruments the
symmetric equilibrium is described by
K1c = tP
1
2( + 2m )gP; (17)
(cc1)2 = 2tD+
1
2( + 2m )gD; (18)
and hospitals realize a pro…t of
c = 1
2 tP + 2mtD 1
2[( + 2m ) (gP +mgD)] :
On the patients’ side, as usual, the price charged depends positively on the
trans-portation cost tP. Moreover, the negative externality generated by patients increases
the price. Comparing K1c de…ned by (17) with K1w speci…ed by (12) shows that this e¤ect is stronger when doctors are remunerated via a fee-for-service than under a salary
scheme. Consequently we haveKc
1( = 0)> K1w. Intuitively, the fee-for-service induces a higher level of e, which increases the hospitals’ cost. This cost increase is shifted, at
least to some degree, to patients. In the same way, on the doctors’ side, hospitals take
more advantage of the transportation cost tD when they use a fee-for-service scheme
due to the positive number of events. The positive externality generated by doctors
favor them in comparison with a salary payment. Moreover, it can be noticed that
we obtain a symmetric equilibrium that ensures a positive fee-for-service-rate only if
4tD ( + 2m )gD. In words, the positive externality generated by doctors must be
We will now compare patients’ and providers’ welfare and hospitals’ pro…ts achieved
under fee-for-service and under the other remuneration schemes. We will concentrate on
the comparison with the salary regime. The comparisons will make use of the following
lemma which is established by substituting the equations provided in Propositions 1
and 4 into the de…nitions ofV,U and and by rearranging the resulting expressions.
Lemma 1 Welfare and pro…t variations between wage and fee-for-service regimes are
given by
V = Vc Vw = mcc1 K1c (0 K1w) =m cc1+1 2 gP
cc
1
cc
1
; (19)
U = Uc Uw = (cc1)2 1 m 2
2 w
w
1 (20)
= mcc1 mc
c
1 4
2 tD
mgD
2
cc
1
cc
1
; (21)
= c w= m 2 tD
(mgD+gP)
2
cc1 cc
1
: (22)
These expressions are rather complex. The only obvious result is that V < 0 for = 0. Intuitively, the fee-for-service increases the number of acts (we havee > 0). As discussed above, this results in higher payments for patients but does not give them
any extra bene…ts. The other expressions are ambiguous, even for = 0. When tD
mgD=2, we have U < 0, so that providers are also better o¤ with a salary scheme.
This is because they receive a higher payment and do not incur any disutility of e¤ort.
However, whentD > mgD=2these two e¤ects go in opposite directions. Regarding ,
we have an explicit expressions for = 0.20 Consequently, some results can be obtained for that case. For instance, when the CNE is determined by the doctor/patient ratio
(a function homogeneous of degree 0, which implies mgD+gP = 0), is necessarily
positive. It appears that hospitals take advantage of the fee-for-service to charge twice
the transportation cost on doctors, allowing them to increase their pro…t (compared to
salary or capitation scheme).
When > 0, only few analytical results can be obtained. They make use of the following Lemma (established in Appendix C) which studies the comparative statics
properties ofcc1 and K1c with respect to .
Lemma 2 The variations ofcc
1 andK1c with respect to satisfy the following properties. i) In the neighborhood of = 0, mgD 2tD ensures that dcc1=d 1which in turn
implies cc
1 .
ii)
dKc
1
d =m 4c1+ 2c1+ gP
2c1 (1 ") ;
where
"=
c1
dcc
1
d :
The variation of the total fee paid by patients with respect to is ambiguous and
mainly depends on the elasticity of the fee-for-service rate with respect to . Situations
in which this elasticity is higher than1can be interpreted as an induced demand e¤ect. In such a case, the fee-for-service rate paid to providers increases faster than the patients’
valuation of the number of medical acts. Then, the …xed price paid by patients increases
faster than their valuation of the number of events. On the contrary, for values of this
elasticity inferior to1, we have two countervailing forces at work and the overall e¤ect is ambiguous.
In the neighborhood of = 0, we have cc
1 which, from (19) implies V < 0 so that patients are worse o¤ when the doctors’ remuneration is switched from wage
to fee-for-service. Intuitively, the positive level of c implies that doctors exert some
e¤ort. However, the valuation of this e¤ort is low and it is more than outweighed by
6
Mixed fee-for-service schemes
We now consider the case where the di¤erent types of remuneration can be combined
(on the doctors’ side). First, we study a scheme involving both a salary and a
fee-for-service. Then, we consider a combination of capitation and fee-for-fee-for-service. As to the
patients, we continue to consider only …xed fees.
6.1 Fee-for-service and salary
The relevant …rst-order conditions are now (8), (10) and (9). The resulting equilibrium
is stated in the following proposition, which is established in Appendix D.
Proposition 5 When hospitals use a …xed feeKj on the patients’ side, while combining
wage wj and fee-for-servicecj on the doctors’ side,
(i) the symmetric equilibrium is given by
K1wc = tP
1
2( +m )gP + 2m
2; (23)
wwc1 = tD+gD
1
2( +m ) +
2; (24)
cwc1 = ; (25)
and hospitals realize a pro…t of
wc
= w = d= 1
2 tP +mtD 1
2( +m ) (gP +mgD) : (26)
(ii) the induced e¤ort level ej =m is e¢cient (maximizes total surplus).
Interestingly, the mixed payment case turns out to be simpler to solve than the
pure fee-for-service case and we obtain closed form solutions like in Section 4. The
proposition shows that the introduction of a fee-for-service (on top of the salary) only
patients’ bill as well as the wage remain at the same levels as under a pure wage scheme
(we have Kwc
1 = K1w and w1wc = ww1). Now, when > 0, hospitals use a positive fee-for-service in equilibrium, and it is just equal to (the marginal bene…t to patients).
The shifting pattern of this extra fee is quite interesting. One could have expected
some kind of crowding out (or substitution) between remuneration schemes, but we …nd
exactly the opposite result: salary but also prices increase such that patients loose and
doctors win. This result only comes from the role played by the number of consultation
and does not interact with the quality captured by the common network externalities.
To understand this, consider a slightly di¤erent game in which the fee-for-service rate is
exogenously set at its e¢cient levelc1 =c2 = , while the number of consultations per patient is …xed and given bye=m (the level of e¤ort implied by (3) whenc1 =c2 = and whennP1 =nD1 = 1=2).21 In this game, when hospitals compete in price and salary as in Section 4, it can easily be shown that, symmetric equilibrium, prices and salaries
are equal toKw
1 +m 2andww1 respectively (whereK1wandww1 are de…ned by expressions (12) and (13) in Proposition 1. Now, let us continue to assume that the fee-for-service is
given byc1=c2= , but that the number of consultations per patient is determined by (3) which depends on the number of patients and doctors e¤ectively a¢liated with both
hospitals. Further assume that prices and wages in hospital 2 are given by Kw
2 +m 2 and ww
2 respectively.22 An increase in the price or the wage in hospital 1 now brings
2 1In this game, the demand functions for hospital 1 are given by
nP
1 =
1 2+
1 2tP
g nP
1; n
D
1 [K1 K2] ;
nD
1 =
1 2+
1 2tD
g nP
1; n
D
1 + [w1 w2] :
2 2The demand system for hospital 1 becomes
nP1 = 1 2+
1 2tP
g nP1; n
D
1 + 2
mnD
1 nP
1
m 1 nD
1 1 nP
1 !
(K1 K2) !
;
nD1 = 1 2+
1 2tD
+ g nP1; n
D
about an increase in the number of consultations per patient in hospital 1 (because
some patients move from hospital 1 to hospital 2; while doctors move from hospital 2 to hospital 1). This in turn mitigates the negative e¤ects of an increase in the price and
the wage and implies that a unilateral price and wage increase is bene…cial whenw2; K2 and c2 are held constant. This leads to higher symmetric equilibrium prices and wages
which, as shown by (23) and (24) are given by Kw
1 + 2m 2 and ww1 +m 2. To sum up, the introduction of the fee-for-service component along with a salary scheme leads
to higher prices on the patients’ side and higher wages on doctors’ side. Observe, that
this has no adverse e¤ect on hospitals’ pro…ts; the extra compensation paid to doctors
is exactly shifted to patients. A patient’s bill increase by 2m 2, which is equal to the sum of the fee-for-service (mcwc
1 =m 2) and the extra salary (m 2).23
Welfare comparisons are also much simpler than in the pure fee-for-service case.
With the closed form solutions reported in Propositions 1 and 5, it is straightforward
to compare patients’ and doctors’ welfare.
Proposition 6 When a fee-for-service component is introduced into a pure salary scheme,
the welfare variations are:
i) on the patients’ side, V =Vwc Vw = m 2<0; ii) on the doctors’ side, U =Uwc Uw = (3=2) 2>0.
To sum-up, patients loose, doctors win and (as shown by 26) hospitals are indi¤erent.
Patients do bene…t from the increase ine(which they value when >0), but this bene…t is more than o¤set by the increase in fees.
6.2 Fee-for-service and capitation payment
The relevant …rst-order conditions are now (8), (10) and (11). The solution is derived
in Appendix E, and presented in the following proposition.
2 3Themappears in the expressions because there aremdoctors per patient in a symmetric
Proposition 7 When hospitals use a …xed fee Kj as the sole instruments on the
pa-tients’ side, while capitation payment dj and fee-for-service cj on the doctors’ side,
(i) the symmetric equilibrium is given by
ddc1 = 1
2mtD+ ( m+ )
mgD
4 + 1 2m
2;
K1dc = tP +
1 2mtD
( +m ) (2gP +mgD)
4 +
3 2m
2;
cdc1 = ;
and hospitals realize a pro…t of
dc= wc= w = d= 1
2 tP +mtD 1
2( +m ) (gP +mgD) ; (ii) the induced e¤ort level ej =m is e¢cient (maximizes total surplus).
As in the previous case, for = 0, at a symmetric equilibrium hospitals do not use a fee-for-service rate and consequently we obtain exactly the same equilibrium as the
one obtained in a pure capitation payment on doctors’ side. Now, when >0, the …xed price paid by patients is increased. This rent paid by patients is totally transferred to
doctors as hospitals’ pro…t remain the same as in the previous cases (except the case
when hospitals only remunerate providers via a fee-for-service scheme). The intuition
is exactly the same as when the fee-for-service was combined with the salary. As in
that previous setting, there is no crowding out between remuneration schemes,i.e.,the
capitation payment received by doctors increases simultaneously with the fee-for-service
rate. As in the previous section, prices are wages are increased because the number of
consultations per patient is increasing in the number of doctors and decreasing in the
number of patients.
Proposition 8 When a fee-for-service component is introduced in a pure capitation
payment scheme, the welfare variations are:
The introduction of a fee-for-service component in a capitation payment scheme
un-ambiguously decreases the patients’ welfare and increases the doctors’ utility. As in the
previous casei.e. in the salary case, the fee-for-service introduction favors doctors while
patients are worse o¤. However, the capitation scheme remains more “patient friendly”
exactly like under pure (salary of capitation) remuneration schemes; see Proposition 3.
7
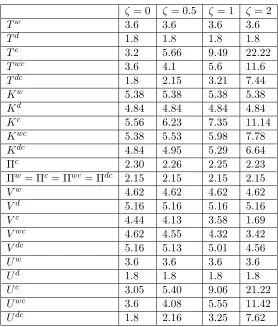
Numerical illustration
We now provide a numerical example which illustrates our analytical results and
pro-vides a basis of comparisons for the cases where analytical results are ambiguous. Table
1 reports the results for the following example: ' NC
j ; NjP = NjC=NjP , tP = 4 ;
tD = 1, = 2, = 1, m = 0:3; V = 10 and U = 0. We consider di¤erent levels of
including 0 (the case for which we have a full set of analytical results). This uses the simplest meaningful speci…cation for quality by assuming that the CNE depends on the
patient-doctor ratio.
For the most part this example simply illustrates the earlier results and there is no
point reviewing them here. However, there are some extra features which supplement
the analytical results. First, we …nd that a fee-for-service is bad for patients’ welfare,
even for levels of beyond the neighborhood of = 0. As increases, patients put a higher value on the doctors’ e¤ort and only a fee-for-service can induce this e¤ort. This
e¤ect tends to make the fee-for-service remuneration attractive to patients. However,
this comes at a price. As competition for doctors intensi…es, their total compensation
increases in a signi…cant way and this extra cost is more then fully shifted to the patients.
Overall, it turns out that the increase in fees more then outweighs the bene…ts patients
derive from the higher e¤ort.
Turning to the mixed schemes, we know from the analytical part that patients’
wel-fare decreases as a fee-for-service element is introduced along with a salary or capitation
in-= 0 = 0:5 = 1 = 2
Tw 3:6 3:6 3:6 3:6
Td 1:8 1:8 1:8 1:8
Tc 3:2 5:66 9:49 22:22
Twc 3:6 4:1 5:6 11:6
Tdc 1:8 2:15 3:21 7:44
Kw 5:38 5:38 5:38 5:38
Kd 4:84 4:84 4:84 4:84
Kc 5:56 6:23 7:35 11:14
Kwc 5:38 5:53 5:98 7:78
Kdc 4:84 4:95 5:29 6:64
c 2:30 2:26 2:25 2:23 w= c = wc= dc 2:15 2:15 2:15 2:15
Vw 4:62 4:62 4:62 4:62
Vd 5:16 5:16 5:16 5:16
Vc 4:44 4:13 3:58 1:69
Vwc 4:62 4:55 4:32 3:42
Vdc 5:16 5:13 5:01 4:56
Uw 3:6 3:6 3:6 3:6
Ud 1:8 1:8 1:8 1:8
Uc 3:05 5:40 9:06 21:22
Uwc 3:6 4:08 5:55 11:42
[image:26.612.167.445.203.530.2]Udc 1:8 2:16 3:25 7:62
Table 1: Equilibrium under di¤erent remuneration schemes when '(NP
j ; NjD) =
(NP
j =NjD), tP = 4; tD = 1, = 2, = 1, m = 0:3; V = 10, U = 0 for di¤erent
troduced in a fee-for-service scheme. For the considered parameter values, this leads to
an increase in patients’ welfare. More interestingly, it has an ambiguous e¤ect on
doc-tors’ welfare. It increases when is small, but decreases for larger levels of . In other
words, when is su¢ciently large, doctors would prefer a pure fee-for-service scheme.
8
Conclusion
This paper represents an attempt to study the interplay between hospitals’ competition
and doctors’ remuneration schemes properties via a two-sided market approach that
includes common network externalities. In a …rst step, we considerpurewage, capitation
of fee-for-service payment schemes. We …nd that the number of consultations, and
consequently the level of quality delivered, is higher under a fee-for-service scheme than
under other schemes. As a matter of fact, when doctors are remunerated solely via a
salary or a capitation payment, they provide the minimum level of e¤ort. Under salary
and capitation schemes, hospitals obtain the same pro…t at equilibrium. Patients pay
a lower price and doctors are less remunerated when they receive capitation payments
rather than salary schemes are used. In other words, a capitation payment scheme
favor patients while patients are better o¤ under a salary scheme. Next, even though
our set-up can be considered as biased in favor of fee-for-service schemes, our results
suggest that patients are worse o¤ when doctors are paid via a fee-for-service rather
than under a salary scheme. We show this analytically for the case when the number
of acts provides only small bene…ts to patients. For larger levels of bene…ts, numerical
simulations appear to corroborate this result.
Second, we consider payment schemes mixing fee-for-service with either salary or
capitation payments. We show that in either case, hospitals set the fee-for-service rate
just equal to the patients’ valuation of the number of consultations. Both type of mixed
schemes yield the same pro…t for hospitals as under pure capitation fee or salary schemes.
in their implications for patients and doctors. Exactly like in the pure remuneration
case, the presence of a capitation element favors patients, while a salary term favors
doctors. Finally, our results show that the introduction of a fee-for-service component
in a capitation or salary scheme always favor doctors whereas patients are worse o¤, in
spite of the quality increase.
This paper can be extended in several directions. First, it would be interesting to
consider outcome where the market for patients is not completely covered. From a
theoretical perspective this would actually simplify the model. However, it would make
it more interesting from an applied policy perspective as access to health care is a major
problem in practice. Second, both from a theoretical and from a practical perspective,
it would be useful to study mixed oligopolies (with public or non pro…t hospitals).
References
[1] Armstrong M, 2006, “Competition in Two-Sided Markets”,Rand Journal of
Eco-nomics, 37(3), 668–691.
[2] Brekke K., R. Nuscheler and O. Straume, 2006, “Quality and Location Choices
Under Price Regulation”, Journal of Economics & Management Strategy, 15, 1,
207-227.
[3] Brekke K., L. Siciliani and O. Straume, 2009, “Hospital competition and quality
with regulated prices”, CESifo working paper 2635, 2009, forthcoming in
Scandi-navian Journal of Economics.
[4] Choné P and C.A Ma, 2010, “Optimal Health Care Contracts under Physician
[5] Cutler D. and R. Zeckhauser, 2000, The Anatomy of Health Insurance, in Anthony
Culyer and Joseph Newhouse, eds., Handbook of Health Economics, Volume IA,
Amsterdam: Elsevier, 563–643.
[6] Fergusson-Paré M, 2004, “ACEN Position Statement: Nursing Workload-A Priority
for Healthcare”,Nursing Leadership, 17(2), 24–26.
[7] Fortin B., N. Jacquemet and B. Shearer, 2008, “Policy Analysis in the
Health-Services Market: Accounting for Quality and Quantity”, CIRPEE working paper
n 807.
[8] Gaynor M and M V. Pauly, 1990, “Compensation and Productive E¢ciency in
Partnerships: Evidence from Medical Groups Practice” Journal of Political
Econ-omy, 98, no. 3, 544–573.
[9] Gosden T, Pedersen L and D. Torgerson, 1999, “How should we pay doctors? A
systematic review of salary payments and their e¤ect on doctor behaviour”, QJ
Med, 92, 47–55.
[10] Gri¢n K and B.A Swan, 2006, “Linking Nursing Workload and Performance
Indi-cators in Ambulatory Care”, Nursing Economics,. 24(1), 41–44.
[11] Ma C. A., 1994, “Health Care Payment Systems: Cost and Quality Incentives”,
Journal of Economics & Management Strategy, 3, 93–112.
[12] Ma C.A. and J. F. Burgess, 1993,“Quality competition , welfare and regulation”,
Journal of Economics, 58, 2, 153-173.
[13] Ma C.A and M. Riordan, 2002, “Health Insurance, Moral Hazard, and Managed
Care”, Journal of Economics & Management Strategy, Vol. 11, 81-107.
[14] Mc Gillis Hall L, 2004, “Quality Work Environments for Nurse and Patient Safety”,
[15] Newhouse J.P, 1996, Reimbursing Health Plans and Health Providers: E¢ciency
in Production Versus Selection,Journal of Economic Literature , 34, 1236-1263.
[16] Pezzino M and Pignatoro G., 2008, “Competition in the Health Care Markets: a
Two-Sided Approach”, Working Paper University of Manchester.
[17] Rochet J-C. and Tirole J., 2003, “Platform Competition in Two-Sided Markets”,
Journal of the European Economic Association, 1, 990–1029.
[18] Rochet J-C. and Tirole J., 2006, “Two-Sided Markets: A Progress Report”, Rand
Journal of Economics, 37, 645–667.
[19] Tarnow-Mordi W.O, C Hau, A Warden and A.J Shearer, 2000, “Hospital Mortality
in Relation to Sta¤ Workload: a 4-Year Study in an Adult Intensive Care Unit”,
Appendix
A
Properties of the demand functions
Di¤erentiating (4) and (5), rearranging and solving yields
dnP
1
dK1 =
1 4tDtPjBj
2tD mgD
4
md1 ; dnD
1
dK1 =
1 4tDtPjBj
gP +
4
md1 ; dnP
1
dw1 =
1 4tDtPjBj
[m[ gD+ 4c1 ]];
dnD
1
dw1 =
1 4tDtPjBj
[2tP ( gP 4mc1 )];
dnP
1
dc1
= m
4tPtDjBj
2tD mgD 4
d1 m +c
2
1 +c1 gD ;
dnD
1
dc1 =
1 4tPtDjBj
(2tP [ gP 4mc1 ])c1+ gP +
4
md1 m ; dnP
1
dd1 =
1 4tDtPjBj
[ gD+ 4c1 ] = 1
m dnP
1
dw1; dnD
1
dd1
= 1
4mtDtP jBj
[2tP ( gP 4mc1 )] = 1
m dnD
1
dw1
;
where
jBj = 1
4tPtD
4tPtD 2tP mgD gP2tD+
4
md1(2tP (gP +mgD))
B
Proof of Proposition 4
The demand functions properties are in this case:
dnP
1
dK1 =
1 4tDtPjBj
[(2tD mgD)];
dnD1 dK1 =
1 4tDtPjBj
[ gP];
dnP
1
dc1 =
m
4tPtDjBj
h
2tD mgD 4 (c1)2 +c1 gD
i
;
dnD1 dc1 =
1 4tPtDjBj
[(2tP [ gP 4mc1 ])c1+ gPm ];
where
jBj= 1 4tPtD
[4tPtD 2tP mgD gP2tD+ 4mc1 [2tD (mgD+gP)]]:
The …rst-order conditions reduce to
@ 1 @K1 =
1 2 +
@nP
1
@K1K1 mc
2 1
@nD
1
@K1 = 0; @ 1
@c1 = @nP
1
@c1 K1 mc
2 1
@nD
1
@c1 mc1= 0:
From(8) and (10), we have
1 2+
@nP
1
@K1
K1 @n
D 1 @c1 = @n D 1 @K1 @nP 1 @c1
K1 mc1
or,
K1=
@nD
1
@c1 + 2mc1
@nD
1
@K1
2 @nD1
The denominator can be succesively rearranged as follows
2 @n
D
1
@K1 @nP
1
@c1
@nP
1
@K1 @nD
1
@c1
= 2 1
4tDtPjBj
[m gP]
1 4tPtDjBj
h
2tD mgD 4 (c1)2 +c1 gD
i
+ 1
4tDtPjBj
[(2tD mgD)]
1 4tPtDjBj
[(2tP [ gP 4mc1 ])c1+ gPm ]
= 2c1 (4tDtPjBj)2
( 4 (c1)m gP + 2tD2tP 2tD gP mgD2tP
+4mc1 (2tD) mgD4mc1 )
= 2c1 (4tPtDjBj)
:
Consequently, we obtain
K1 = (2tP [( + 2m )gP 4mc1 ])c1+ gPm
2c1 ;
= tP
1
2[( + 2m )gP 4mc1 ] +
gPm
2c1
:
Moreover, we have
1 2 +
@nP
1
@K1K1
@nD
1
@K1
=mc2 1;
leading to
1
2(4tPtD 2tP mgD gP2tD+ 4mc1 [2tD (mgD +gP)]) [2tD mgD] tP
1
2( + 2m )gP + 2mc1 +
gPm
2c1
= gPmc21;
implying
c21 = 2c1 2tD+
gD
2 ( + 2m ) +c1 tD
mgD
Finally, evaluating hospitals’ pro…ts at this equilibrium yields
c = 1
2 tP 1
2[( + 2m )gP 4mc1 ] +
gPm
2c1
m 2c1 + 2tD tD
c1 +gD
2 [( + 2m )] gD
m
2c1
;
= 1
2 tP + 2mtD 1
2[( + 2m ) (gP +mgD)] +
m c1 tD
(gP +mgD)
2 :
C
Proof of Lemma 2
Prices in a symmetric equilibrium are given by:
K1 = tP
1
2[( + 2m )gP 4mc1 ] +
gPm
2c1 ;
(c1 )2 = 2tD +
1
2[( + 2m )gD+ 4c1 ] +c1 tD
mgD
2 :
Di¤erentiation with respect to gives:
0
@ 1 2m +
gPm
2c2 1
0 2 (c1 ) +c2 1
tD mg2D
1
A dK1
dc1 =
2mc1 mgP
2c1
2c1 1
c1 tD
mgD
2
!
d
So, the Cramer’s rule gives:
dc1
d =
1
j j
1 2mc1+ mgP
2c1
0 2c1+c11 tD
mgD
2
;
= 1
j j 2c1+
1
c1 tD
mgD
2 ;
with
j j= 2 (c1 ) +
c2 1
tD
mgD
Moreover, we have
dK1
d =
1
j j
2mc1+ mgP
2c1 2m +
gPm
2c2 1
2c1+c11 tD
mgD
2 2 (c1 ) +c2 1
tD mg2D
;
= 1
j j 2mc1+ mgP
2c1 2 (c1 ) +c2 1
tD
mgD
2
2c1+ 1
c1 tD
mgD
2 2m +
gPm
2c2 1
;
= 2mc1+ mgP 2c1
dc1
d 2m +
gPm
2c2 1
;
= m 2c1+ gP 2c1 c1
dc1
d 2c1+ gP
2c1
;
= m 4c1+ 2c1+
gP
2c1 (1 ) ;
with
=
c1 dc1
d :
Finally, we have
dc1
d 1
,
2c1 1 c1 tD
mgD
2 2 (c1 ) c2 1
tD
mgD
2 :
A su¢cient condition to ensure this last inequality is mgD 2tD.
D
Proof of Proposition 5
@ 1 @K1 =
1 2+
@nP
1
@K1K1 m c
2 1+w1
@nD
1
@K1 = 0; @ 1
@c1 = @nP1
@c1 K1 m c
2 1+w1
@nD1
@c1 mc1= 0; @ 1
@w1 = K1 @nP1 @w1
m
2 m c 2 1+w1
From(8) and (10), we have respectively that
1 2+
@nP
1
@K1K1
@nD
1
@K1
=m c21+w1
and,
@nP
1
@c1 K1 mc1
@nD
1
@c1
=m c2
1+w1 :
It gives
1 2+
@nP
1
@K1K1 @nD
1
@c1 = @nP
1
@c1 K1 mc1 @nD
1
@K1
or,
K1=
@nD
1
@c1 + 2mc1
@nD
1
@K1
2 @nP1
@c1 @nD 1 @K1 @nP 1 @K1 @nD 1 @c1 :
From(8) and (9), we have respectively that
1 2+
@nP
1
@K1K1
@nD
1
@K1
=m c2 1+w1
and,
K1@nP1
@w1 m 2 @nD 1 @w1
=m c21+w1 :
It gives that
1 2+
@nP1 @K1K1
@nD1 @w1 =
@nD1 @K1 K1
@nP1 @w1
m
2 or,
K1=
@nD
1
@w1 +m
@nD
1
@K1
2 @nD1
@K1 @nP 1 @w1 @nP 1 @K1 @nD 1 @w1 :
Combining with(D) yields
@nD
1
@c1 + 2mc1
@nD
1
@K1
2 @nP1
@c1 @nD 1 @K1 @nP 1 @K1 @nD 1 @c1 = @nD 1
@w1 +m
@nD
1
@K1
2 @nD1
or,
@nD
1
@c1 + 2mc1 @nD 1 @K1 @nD 1 @K1 @nP 1 @w1 @nP 1 @K1 @nD 1 @w1 = @n D 1
@w1 +m @nD 1 @K1 @nP 1 @c1 @nD 1 @K1 @nP 1 @K1 @nD 1
@c1 :
It gives
2mc1 =
@nD
1
@w1 +m
@nD
1
@K1 h@nP
1 @c1 @nD 1 @K1 @nP 1 @K1 @nD 1 @c1
i @nD
1 @c1 @nD 1 @K1 @nP 1 @w1 @nP 1 @K1 @nD 1 @w1 @nD 1 @K1 @nP 1 @w1 @nP 1 @K1 @nD 1 @w1 @nD 1 @K1 ; implying that
2mc1 =
@nD
1
@w1 +m @nD
1
@K1
h@nP
1 @c1 @nD 1 @K1 @nP 1 @K1 @nD 1 @c1
i @nD
1
@c1
h@nD
1 @K1 @nP 1 @w1 @nP 1 @K1 @nD 1 @w1 i @nD 1 @K1 @nP 1 @w1 @nP 1 @K1 @nD 1 @w1 @nD 1 @K1 = @nP 1 @c1 @nD 1
@w1 +m @nD
1
@K1
@nD
1
@c1 m @nP
1
The numerator gives
@nP
1
@c1 @nD
1
@w1 +m @nD
1
@K1
@nD
1
@c1 m @nP
1
@K1 + @nP
1
@w1
= m
(4tDtPjBj)2
2 tD mgD+ 4 c21+c1 gD [2tP ( + m)gP + 4mc1 ]
+ 2tPc1+ gPc1 4 mc21 gPm [ 2tD+ ( + m)gD+ 4c1 ]
= m
(4tDtPjBj)2
(4tPtD 2 tD( + m)gP + 2 tD4mc1 mgD2tP
+ mgD( + m)gP mgD4mc1
+4 (c1)22tP 4 (c1)2( + m)gP + 4 (c1)24mc1
+c1 gD2tP c1 gD( + m)gP +c1 gD4mc1
+4tPtDc1 2tPc1( + m)gD 2tPc14c1
gPc12tD+ gPc1( + m)gD+ gPc14c1
+4 mc2
12tD 4 mc21( + m)gD 4 mc214c1 + gPm 2tD gPm ( + m)gD gPm 4c1 );
= m
(4tDtPjBj)2
( +c1) [4tPtD 2tD gP mgD2tP + 4mc1 (2tD (mgD+gP))] ;
= m( +c1) (4tDtPjBj)
:
Therefore, we obtain
2mc1 =
@nP
1
@c1 h@nD
1
@w1 +m
@nD
1
@K1
i @nD
1
@c1 h
m@nP1
@K1 +
@nP
1
@w1 i
@nD
1
@K1
@nP
1
@w1
@nP
1
@K1
@nD
1
@w1
;
= m( +c1):
Then, we have
Moreover, patients’ price becomes
K1 =
@nD
1
@w1 +m @nD
1
@K1
2 @nD1
@K1 @nP
1
@w1 @nP
1
@K1 @nD
1
@w1
;
= 2tP ( gP 4mc1 ) m gP
2 ;
= tP
1
2( +m )gP + 2mc1 ; = tP
1
2( +m )gP + 2m 2:
The salary is determined by
mw1 = 1 2+
@nP
1
@K1K1
@nD
1
@K1
mc2 1;
= 1
gP
(2tDtP tD gP tP mgD+ 2 mc1(2tD (mgD+gP))
[2tD mgD] tP
1
2( +m )gP + 2m
2 m 2:
Therefore, we obtain
w1 = tD+
gD
2 ( +m ) + 2:
Hospitals’ pro…t becomes:
1 = 1 2
h
^
K1 mh(^c1)2+ ^w1ii;
= 1 2 tP
1
2( +m )gP + 2m
2 mh 2 t
D+
gD
2 ( +m ) + 2i ;
= 1
2 tP +mtD 1
E
Proof of Proposition 7
From the set of relevant …rst order conditions, we have:
1 2 +
@nP1
@K1 [K1 d1] =mc
2 1
@nD1 @K1; @nP
1
@c1 [K1 d1] mc1 =mc
2 1
@nD
1
@c1 ;
1 2+
dnP
1
dd1
[K1 d1] =mc2 1 dnD 1 dd1 : It gives 1 2 + @nP 1
@K1[K1 d1]
@nD
1
@K1
=mc21
and,
1 2 +
dnP
1
dd1 [K1 d1]
dnD
1
dd1
=mc2 1;
therefore, we have
1 2 +
@nP1
@K1 [K1 d1] dnD1
dd1 = @nD1 @K1
1 2+
dnP1
dd1 [K1 d1]
or,
K1 d1 =
dnD
1
dd1 +
@nD
1
@K1
2 @nD1
@K1 dnP 1 dd1 @nP 1 @K1 dnD 1 dd1 :
Moreover, we have
@nP
1
@c1 [K1 d1] mc1
@nD
1
@c1
=mc21:
It gives that
@nP
1
@c1
[K1 d1] mc1 @n
D 1 @K1 = @n D 1 @c1 1 2 + @nP 1 @K1
[K1 d1]
or,
K1 d1 =
@nD
1
@c1 + 2mc1
@nD
1
@K1
2 @nP1
![sustainabledevelopmentandthatsuchprogramsaimtotransformourworldthrough Inotherwords,wemustensurethattheneweducationalprogramsofUNESCO digitalplatforms.Cabero[ , ]arguesthatthewellbeingofstudentsincludesfiveareas:material,social,physical,psychological,andco](data:image/gif;base64,R0lGODlhAQABAIAAAP///wAAACH5BAEAAAAALAAAAAABAAEAAAICRAEAOw==)