Use of Informal Mobile Telephony in Low income households in
Colombia
1
!
Abstract.
" #$ % &$ $ # $
' $ '
$ $ $
% $ % ( $ # # ' % $ $
$ $ ) * # &# $
$ $ # # $ + , $ ' $ # #
$ % # # % # # $ $ $ # % $
( $ # # $ $ -$
$ # ' # #
# # $ $ $ %
. / 0 # #
# / . 0 0 1 /
% # 1 2 # 2
. # # / 1
0 %
3 4 # / # &# / #
1 % 1 # 1 # # %
1 # 1 2 % #
0 5 1 1 #
. #
1 # % /
# # % # # 1
JEL classification: O30; O10; P59; L86; C24; O52
Keywords: Mobile telephony, ICT, gender gap, Resale
6 Corresponding author, Phone (571)-2970200 ext. 631. We thank to Judith Mariscal for
access to data of the Mobile Opportunities.(DIRSI)
5 #$ % $ & % $ -$ %
' ) $ $ ) ' 7 $
$ $ " $ # 8 #$ %
&$ $ # $ (
% 7 $ % ' # # 7 $ $ $
# % 7 7 )
$ " 7 $ $ '
$ $ ' 7 $ ' $ #$ $
$ ' ) 7 $ $ # $ $ '
$ $ 9. 5 7 $ $ $ $ # $
( $ ' ' % '$ $ $ # # '$ $ +
, % $ #
$ # # 7 ' # % :;; ' # #
$ ' # % (5 5( 4( 8 %
< =;;> -$ ' ? ( $ '
$ ' $ ) # $
-$ $ $ ) $ #
% -$ 7 ' $ ' $ &# $ % *
$ # % $ ( # $
% % $ # + , # # '$ ' #$
1 7 ' ' ? % ' $ ' $ $ ' $ $
( #$ % $ ' $ % 9 $ 7 '
$ $ @ A=;;BC7 $ A=;;DC7 8 $ )
A=;;:C 8 A=;;BC7 $ $ @ A=;;BC % $
# -$ % ## $ # 4 $ #
#$ ' 6EED =;;; $ 7 $
$ A=;;DC $ ' $ $ # #
&# $ $ $ $ 1
# 4$ $ # # $ # $
# #$ % $ 3 )
#$ @ 8 $ ) A=;;:C # $ $ @
' ) $ $ # $ % ' %
# ( $ 7 $ % % $ %
$ % % $ &# $
( ' % # $ # # ' %
'$ ' $ $
#$ ' ' 8 A=;;BC # $ $ $ '
$ $ $ &#
# 9 $ F A=;;6C7 A=;;6C
A=;;GC & $ #
9 $ $ $ 7 ' $ # $ $ %
$ # $ # # ( $ $7 $ ' $
# $ $ # # $
)' ' $ # $ $ # # -$ % % $
$ # $
" $ $ + # , '$ $ $ #
$ , ' '$ $ ' H $ 4847
$ $ &# I 7 A=;;DC $ %#
$ # # $ % $ 7 $ $
# 484 1 '$ # # '$
' I 7 A=;;DC $ $ $ $ # '$ # #
$ $ $ $ ' #$ 7 # # $ $ % $
$ ( $ 7 $ $ + %,
. $ $ # 7 #
$ $ ' % # ' A4 48
&# 6; # $ A4 ( 7
=;;GH ' 7 =;;GH 4 7 =;;GC
" $ $ $ ' #$ 7 4 A=;;GC $ # $ #$
' $ # # % ' # $ '$ $ #$ $
$ % +' 1 ' $ $ & % , ( $ & #$ 7 % # #
$ % ' )
9 # $ # # # # '
$ % $ '$ $ $ # %
1 # ' $ $ ' # # " 1 7
% # % $ # $
4 & # # % $ ) % A=;;BC 5
A=;;GC " ( $ $ # + , %
' $ # $ $ # #
5 " % A=;;:C $ ' $ $ 8 & 7 ' # #
484 # $ $ #$ % $ $
$ A" " C 5 A=;;DC $ J # K
% 7 7
$ % # -$ # # # ' $
484L & # ' $ ## % 7 % $
&# $ # A" @ C
" ' 7 $ # '
# # % ( 7 $ # % $ $ %
$ ' "
-$ $ #$ % ' 6EEB ' $ %
% # ' ' $ $ % # # % (
$ $ # $ ' # #
' ) ' $ '$ ) ' $ -$ # # $ '
$ $ $ ' # # $ $ '
&# A $ &# C $ # # -$ #
# # 6EE> ## # $ M $ 7
A=;;>C $ '7 $ % $ $ # # $ # #
-' $ &# $ # ' 7 $ #
7 $ N # % # % N % " $ 67 $
6EE>
" $ =;;O7 $ # $ ) -$
) # '$ $ # 1 % $
&# -$ % $ $ $
& ( $ # *$ ' ) $ $ #
' $ # 7 ' $ $ ' $ ' # %
$ $ % # # % # $ ' $ $
) # % $ #
A" @ C
" $ $ $ # 7 # # ) %
$ N N $ ' =;;= =;;O 5 #
$ % # # # 7 ) $ #
' & 7 $ $ $ # $ # # 7 $ #
' ' ) ' $ # $
$ ' ) -$ %# ' $ $
$ % # % # # $ $ $
# # 7 $ $ % % ' $ # $
&# $ # # ( # 7 $ $ '
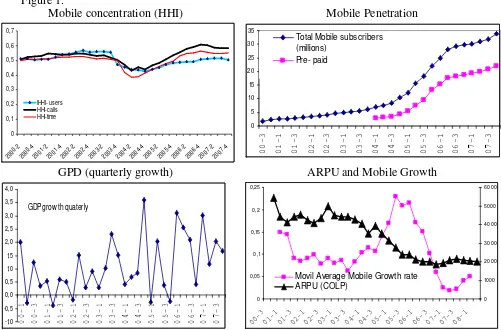
Figure 1.
Mobile concentration (HHI) Mobile Penetration
0 0,1 0,2 0,3 0,4 0,5 0,6 0,7 2000 -2 2000 -4 2001 -2 2001 -4 2002 -2 2002 -4 2003 -2 2003 -4 2004 -2 2004 -4 2005 -2 2005 -4 2006 -2 2006 -4 2007 -2 2007 -4 IHHI- users HHI-calls HHI-time 0 5 10 15 20 25 30 35 0 0 -3 0 1 -1 0 1 -3 0 2 -1 0 2 -3 0 3 -1 0 3 -3 0 4 -1 0 4 -3 0 5 -1 0 5 -3 0 6 -1 0 6 -3 0 7 -1 0 7 -3
Total Mobile subscribers (millions)
Pre- paid
GPD (quarterly growth) ARPU and Mobile Growth
-1,0 -0,5 0,0 0,5 1,0 1,5 2,0 2,5 3,0 3,5 4,0 0 0 -1 0 0 -3 0 1 -1 0 1 -3 0 2 -1 0 2 -3 0 3 -1 0 3 -3 0 4 -1 0 4 -3 0 5 -1 0 5 -3 0 6 -1 0 6 -3 0 7 -1 0 7 -3
GDP grow th quaterly
0 0,05 0,1 0,15 0,2 0,25 00 -3 01 -1 01 -3 02 -1 02 -3 03 -1 03 -3 04 -1 04 -3 05 -1 05 -3 06 -1 06 -3 07 -1 07 -3 08 -1 0 1000 2000 3000 4000 5000 6000
Movil Average Mobile Growth rate ARPU (COLP)
Source: Ministry of Communications.
" $ $ $ # 7 # # ) % $
N N $ ' =;;= =;;O 5 # $
% # # # 7 ) $ #
' & 7 $ $ $ # $ # # 7 $ #
' ' ) ' $ # $
$ ' ) -$ %# ' $ $
$ % # % # # $ $ $
# # 7 $ $ % % ' $ # $
&# $ # # ( # 7 $ $ '
$ # # '$ $
$ 5 , # % %7 ' $ % # #
' #$ $ '$ ' 7 $
$ #$ $ N N %7 $
# # # $ $ & #$ $
# $ $ # ' & " $ $
# ' $ # '$ $ $ ' $ +
, $ $ # -, '
-$ 3 $ $ '$ ' $ $
$ # ( $ 7 $
' $ & #$ % ' $ $
' =;;B =;;> $ ' ==> # $
$ $ , 66 BG D # " $ =;;> $ '
O; #$ % 6; & #$ %
" A=;;>C $ ' 7 $ ' $ ' % &# % $
# % # # $ $ $ $ $ $
% # # % AM '7 :B # $ # # # C
Table 1
Mobile Market 1996 2002 2004 2007
Total owners of mobiles (Millions)-b 0,52 4,59 10,4 33.9
Mobile Penetration (owners/population) a 1,3% 10,6% 23,2% 71,3%
Prepaid/Total -b n.a n.d 73,9 90.2
(Herfindhal Hirschman Index)-b 0,5 0,55 0,42 0,58
Market Share of two highest firms -b 87,6% 90.4%
Share of Telecommunications Sector 11,0% 29,6% 45,6% c
Fixed market
Main Lines (millions) a 4,64 7,76 7,58 n.d
Fixed Penetration (Lines/population) a 11,8% 17,8% 16,9% n.d
Share of Telecommunications Sector 36,1% n.d. 32,6% 31,7% c
Gross Domestic Product per capita
n.a Not applicable n. a Not available a- World Development Indicators b- Ministry of Communications c- year 2006
$ # '7 $ $ $ $ $
) 7 $ $ ) ' $ DD # $ A '$ $ $
#C -$ $ $ $ $ $ ' $
$ # 9 $ A C $ # $ $
$ $ # % $ $ -$ $ '
% ' $ ' & #$ # $
M '7 $ $ # ? " 80 A8 & C7
- 0 A4# C 8 A & C
" &# 7 ' ' % # # $
&# #$ % ( % $
# ( $ ' # # '$ ' #$
) -$ 7 ' A # % ' %C # # $
% # # % -$ # # $ '$ $ # %
% $ % $
' # # A 7 8 / 7 @
F C
5 8 % =;;>7 (5 5( 4( # %
" ' $ $ -$ %
& #$ %7 # #
# # 7 % , %7 1 $ %
' # $ $ $ (
7 :;; # # ' % ? 7 8 / 7 @
F ( $ %7 ' $ >6O # A:E # C
#$ % % D6 # ABE= # # C ' #$ * $ # #
'$ # # % # # $ #$ $ $
) $ $ %7 ' $ % $ O> # $ $
& #$ 6; # $ # $ % $ -$
# $ G; # $ # # % $ $ '
( $ $ # # # $ $ &# $
$ # # $ $
( 7 $ # # '$ $
Table 2 Mobile and Fixed users distribution among Respondents Fixed phone
Yes No Total
Yes
301 (37.63)
191 (23.88)
492 (61.5)
No
204 (25.50)
104 (13.0)
308 (38.5) Mobile
Phone
Total
505 (63.13)
295 (36.88)
800 (100)
- O7 ' $ # # $ % $ $ %
$ $ $ # A$ $ $ C " '
# # # 7 A=;;>C7 # #
#$ 1 % $ # # % " $ $
$ % $ ' 7 7 =;;O =;;B " '
% 7 6EEB
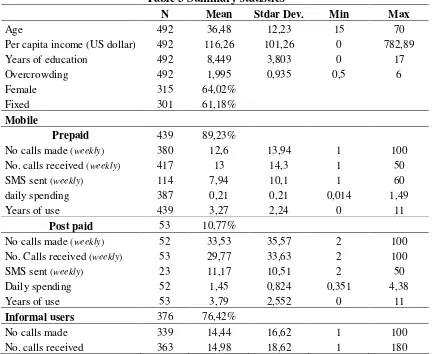
Table 3 Summary statistics
N Mean Stdar Dev. Min Max
Age 492 36,48 12,23 15 70
Per capita income (US dollar) 492 116,26 101,26 0 782,89 Years of education 492 8,449 3,803 0 17
Overcrowding 492 1,995 0,935 0,5 6
Female 315 64,02%
Fixed 301 61,18%
Mobile
Prepaid 439 89,23%
No calls made (weekly) 380 12,6 13,94 1 100 No. calls received (weekly) 417 13 14,3 1 50
SMS sent (weekly) 114 7,94 10,1 1 60
daily spending 387 0,21 0,21 0,014 1,49
Years of use 439 3,27 2,24 0 11
Post paid 53 10,77%
No calls made (weekly) 52 33,53 35,57 2 100 No. Calls received (weekly) 53 29,77 33,63 2 100 SMS sent (weekly) 23 11,17 10,51 2 50
Daily spending 52 1,45 0,824 0,351 4,38
Years of use 53 3,79 2,552 0 11
Informal users 376 76,42%
No calls made 339 14,44 16,62 1 100
[image:10.612.91.523.353.707.2]-$ # $ $ % $ $ 1
$ # # $ ' $ #$ $ '
$ % # # % *$ ' $ 7 $ $ $ $
# # -$ $ $ #$
6:O $ % A== :EPC $ ' $ $ O>= A>D BP
' C ( $ %7 $ ' ) ?
# 7 4847 $ #$ % 7 %
-$ ' % $ 1 %
&# % $ ' #$ 484 ' $ *
# $ #$ % # % # # '
Table 4 Percentage of use of minimizing strategies among mobile owners
N Beeping
Phone-receiver SMS
Informal re-sale Gender
Male 177 40,68 48,02 9,6 77,4
Female 315 45,08 61,59 8,57 75,87
Age
12-18 years 51 49,02 62,75 15,69 80,39
19-30 years 182 55,49 58,24 12,09 78,02
31-50 years 200 33,64 52,5 22,73 73
> 50 years 59 27,12 61,02 6,78 79,66
City
Bogotá 127 52,67 71,65 14,96 80,31
Medellín 100 43 58 16 65
Villavicencio 149 44,3 44,97 3,36 69,13
Pasto 116 32,76 54,31 3,45 91,38
Quintile of SES
1 78 37,18 66,67 11,54 78,21
2 96 42,71 67,71 10,42 69,79
3 97 41,24 55,67 11,34 74,23
4 104 45,19 57,69 9,62 83,65
5 117 48,72 41,03 3,42 76,07
Educative Level
Basic or less 280 37,14 63,21 10 77,86
Secondary 146 50 52,05 8,9 71,12
Superior 66 56,06 39,39 6,82 81,82
Type of Contract
Post-paid 53 49,06 30,19 7,55 49,06
Pre-paid 439 42,82 59,91 9,11 79,73
Firm
Largest 348 44,25 58,33 8,62 77,59
Medium 130 40 52,31 8,46 71,54
Small(*) 14 92,9
TOTAL 492 43,5 56,71 8,94 76,42
(*) Due to few data, percentages are not shown.
$ # # 7 # # % ' $ # #
$ % # # % # $ #$ '$ $ %
) 7 $ % ' $ %7 ' $ $ $
$ ' $ ' ) $ ' $ &#
( $ $ $ #$ %
# $ # 7 ' $ $ % 7
' $ $ 6O # # % $ ( #
$ $ $ $ $ D; # $ $ # $ $
' % $ #$ * $ 484 '
[image:13.612.144.475.205.301.2]1 % $ #
Table 5. Distribution of Strategies of Minimization in Sample (%) informal
use Beeping SMS
Phone receiver
informal use 12,26 28,32 5,53 38,34
Beeping 4,31 4,66 18,48
SMS 0,1 6,22
Phone receiver 4,66
5. Model
* ' $ $ $ # # $ $
#$ % 5 $ % 7 ' ' #
## $ 7 ' % # '$ ' #$ %
$ 1 $ % $ ( $ 7 ' $ BE=
-$ 7 7 ' A>6OC ( $ #7 $
$ $ $ #
# # $ ' $ #$ ( 1 ' $ '$ $
# $ $
4 # 7 ' # ( $
7 $ # '$ $
$ #$ % $ " $ &# %
' ? %# A# # # # C7 7 7
# & % 7 $ $ $ 7 7 $
# 7 & $ 7 A $ $
## &C
* $ # # '$ $ $ % # # % $ $ $ # %
-$ 1 $ $ $ #
% ' # # 9 $ $ $
+ , '$ $ % $ ' $ $ $ $ $
# # $ $ -$ $ $ $ $ 5 =;;D
=;;> # ' $ $ $ $ $ =
* # $ # $
-$ # $ $ $ $ '$ $ $
%7 $ 9 $ ) % # #
$ # # $ # $ ' $ # # $ #
-$ % $ $ -$
$ # $ '
Our second estimation includes all the users. In this case, the dependent variable is defined as whether the person uses or not the informal mobile. The first consequence of the re-definition of the variable is the greater number of observations. Some of the explanatory variables should be modified. Now we include variables like the use of other information and communication technologies (ICTs) and the use of Internet in order to capture the level of use of digital alternatives. For estimation purposes, we use ICT in a separate and in aggregate way.
2
Table 6. Dependent Variable: Use of informal mobile. (Marginal effects)
(1) (2) (3) (4)
Gender 0,0295 0,0321 0,0323 0,0295
(0,0680) (0,0641) (0,0640) (0,0680)
Age 0,0347*** 0,0351*** 0,0352*** 0,0346***
(0,014) (0,014) (0,014) (0,014)
Age2 -0,0004*** -0,0004*** -0,0004*** -0,0004***
(0,0002) (0,0002) (0,0002) (0,0002) Log(income) 0,0653*** 0,0660*** 0,0672*** 0,0653***
(0,0337) (0,0331) (0,0327) (0,0337)
Prepaid 0,6796*** 0,6797*** 0,6786*** 0,6796***
(0,0351) (0,0351) (0,0354) (0,0351)
Schooling 0,0000 0,0000 0,0001 0,0000
(0,0006) (0,0006) (0,0005) (0,0006)
small city dummy 0,0829 0,0830 0,0747 0,0829
(0,0665) (0,0667) (0,0656) (0,0665) Medellin -0,1602*** -0,1603*** -0,1530*** -0,1602***
(0,0792) (0,0793) (0,0774) (0,0792)
Laboral status 0,0098 0,0098
(0,0624) (0,0624)
Firm leader 0,2295*** 0,2300*** 0,2298*** 0,2295*** (0,0591) (0,0590) (0,0590) (0,0591)
Internet user 0,1151* 0,1135* 0,1139 0,0838
(0,0760) (0,0748) (0,0746) (0,0962)
Size of Household 0,0014
(0,0167) Owns a Fixed phone 0,0320 0,0320
(0,0618) (0,0618)
Sensibility to price -0,0286 -0,0287 -0,0272 -0,0286 (0,0664) (0,0664) (0,0660) (0,0664)
ICT 0,0320
(0,0618)
Hosmer-Lemeshow Chi2(8) 22.76 22.22 18.92 22.76
Prob <Chi2 0.0037 0.0045 0.0153 0.003
Pseudos-R 0.43 0.44 0.43 0.43
Log -259.84 -260.0 -260 -259
Standard Errors in parentheses. *** p<001
We also include a socioeconomic index (SES) which was constructed by principal components and is composed of several items as house materials, economic dependence,
lets us to replace information of the level of use of cell and fixed phone in the first estimation. Other variables as the level of using phone (fixed and mobile) are included for assessing complementarities but results show that none of them are significant.
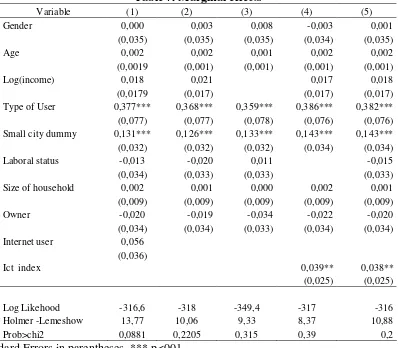
Table 7. Marginal effects
Variable (1) (2) (3) (4) (5)
Gender 0,000 0,003 0,008 -0,003 0,001
(0,035) (0,035) (0,035) (0,034) (0,035)
Age 0,002 0,002 0,001 0,002 0,002
(0,0019 (0,001) (0,001) (0,001) (0,001)
Log(income) 0,018 0,021 0,017 0,018
(0,0179 (0,017) (0,017) (0,017)
Type of User 0,377*** 0,368*** 0,359*** 0,386*** 0,382***
(0,077) (0,077) (0,078) (0,076) (0,076)
Small city dummy 0,131*** 0,126*** 0,133*** 0,143*** 0,143***
(0,032) (0,032) (0,032) (0,034) (0,034)
Laboral status -0,013 -0,020 0,011 -0,015
(0,034) (0,033) (0,033) (0,033)
Size of household 0,002 0,001 0,000 0,002 0,001
(0,009) (0,009) (0,009) (0,009) (0,009)
Owner -0,020 -0,019 -0,034 -0,022 -0,020
(0,034) (0,034) (0,033) (0,034) (0,034)
Internet user 0,056
(0,036)
Ict index 0,039** 0,038**
(0,025) (0,025)
Log Likehood -316,6 -318 -349,4 -317 -316
Holmer -Lemeshow 13,77 10,06 9,33 8,37 10,88
Prob>chi2 0,0881 0,2205 0,315 0,39 0,2
Standard Errors in parentheses. *** p<001
City) are on average more digitalized. This finding also is unsurprising since people living in the capital have more access to ICT nodes of connections be them fixed telephony, public telephony and mobile. The variable owner seeks to identify if people who has a mobile device tends to use the informal resale with a higher probability with respect to those who does not have it. Although it is not significant, the sign is the expected. As we
expected, we found that there are no gender differences in the use of this alternative of communication.
6. Conclusions
9 $ ' $ $ $
$ ( 7 # # '$ + , $
'$ $ % # # % # $ ' %
* $ $
7 $ $ $ &# % $ $ $ %
# # $ $
5 $ % 7 # # $ $
$ ' # ( 1 # ' $
$ 1 '$ $ $ $
( $ 7 # % $ $
'$ $ $ % # # # '$ $ # ' $
$ $ # $
#$ % $ ## % 7 $ % ' %
% # # ' $ ' '
References
$ 7 " 7 @ A=;;BC
-@ % =: B=>QBO>
$ 7 " A=;;DC ! ? &# R @
( @ ( @ "
$ ) %7 5 A=;;BC ! " # "
''' B L L %;BL ) S $
5 " A=;;:C $ % %
& ! ' () " '''
5 7 < $ A=;;DC * + , $) - !
! " @ # # $ $ (
" 7 4$ M ' T )7 M ' T ) %7 MT7 9 ' 7 " A. C A=;;GC ), .
/0 $ ( - "
7 A=;;6C7 , !
$ $ 7 ( . @ %7 F 6O7 ## 6E OB
7 ) F A=;;6C7 !
$ - 7 . # . '7 F BG7 ## G>> G::
7 A=;;>C 1 & 2 !
300/ 300455( 4( (5 4 $ #?LL''' L L S L #
7 A=;;>C 2 5 ! % &
( ! , $ ! " '''
7 < A=;;GC7 ! ! ) "
7 - @ %7 F =E7 ## BEOQG;G
( A=;;GC 6 " , . * 7 " # 6
7 ## % * )
''' $ L# L ' $
8 7 4 A=;;BC ! -8,
. ( U M ' $ % F 6O AOC ## =G6 =>>
8 $ ) 7 7 5 F 7 - 4#$ # A=;;:C !
- @ % O= ## =OB =BG
4 5 7 4 7 M 7 $ 7 < 7 8 $ 9 7 U 8 V % V A=;;GC
,
9 ' :7 % ! ; % A ' $
-9 V 5 # ( 5 # 7 =;;GC "
''' $ L # L# L-$ P=;. P=;( # P=; P=;
- P=; P=; P=; $ - P=; # #
I "% $ 7 4 3 7 " " % % A=;;DC - " , "
-" ! < " *5 5 -$ O
!
Name Description
Gender Dummy variable equal to 1 if the person is men, 0 elsewhere
Age age of the person (continuous variable)
Age 2 age squared
Log(income) per capita income (in logarithms)
SES Socioeconomic index ( ranges from 0 to 100)
Contract
Dummy variable equal to 1 if the person is in the pre-paid modality, 0 elsewhere (postpaid or not own the phone)
Education Years of schooling
Medellin Dummy variable equal to one if the person lives in Medellin small city
dummy Dummy variable equal to one if the person lives in Pasto or Villavicencio
Laboral status
Dummy variable equal to one if the person is employed and cero if he/she is unemployed or inactive
Size of
household number of people in household
phone reception Dummy variable equal to 1 if the person only use the mobile for receiving calls Owns a Fixed
phone Dummy variable equal to 1 if the person has a fixed line in household Perception Equal to 1 if the person thinks mobile is costly
Sensibility to price
This is a dummy variable constructed from a question done to people about their probability of change the use when price change (up and down). It is equal to 1 if the person change her level of use when price change
Type of User
Dummy variable equal to 1 if he/she does not have a mobile or have it in the modality of prepayment
Owner Dummy variable equal to 1 if he/she owns a mobile phone
Mobile calls Number of calls made from a mobile phone Fixed calls Number of calls made from a main (fixed) phone Total calls Mobile + fixed calls
internet If the user use internet during the last month
Use of internet Number of days in which he/she used internet during the last month ICT index Internet +fixed. Then it takes values from 0 to 2.
Other strategies