Economic efficiency of e learning in higher education: an industrial approach
21
0
0
Texto completo
(2) ©© Intangible Capital, 2008 – 4(3): 191-211 – ISSN: 1697-9818 doi: 10.3926/ic.2008.v4n3.p191-211. Título: La eficiencia económica del e-learning en la educación superior: Un enfoque industrial Resumen: Existe poca literatura que haya analizado en términos económicos la eficiencia del e-learning. en. la. enseñanza. universitaria,. principalmente. debido. a. la. no. disponibilidad de estadísticas oficiales. A pesar de estas importantes limitaciones, el presente artículo tiene como objetivo contribuir al estudio de la eficiencia económica del e-learning, a través del análisis de una muestra de universidades durante un período de tiempo (1997-2002). Se han obtenido algunos datos empíricos para tratar de comprender si el e-learning es un modelo viable de educación superior, y qué variables permiten alcanzar dicha viabilidad. Las principales conclusiones son: 1) que el aumento del número de estudiantes matriculados es coherente con el aumento de las tasas de productividad laborales, 2) que el ahorro de costes laborales se explica por la mejora de la eficiencia económica de las universidades (o productividad total de los factores), y 3) que la mejora de la productividad total de los factores en el e-learning no solamente se debe a la consecución de economías de escala, sino también a dos innovaciones organizativas: los procesos de externalización que conducen al aumento de los costes variables en consonancia con una disminución de los costes marginales, y el hecho de compartir el control y la utilización de los activos, que permiten incrementar la rotación. Palabras clave: e-learning, universidad, producción, productividad, eficiencia económica. 1. Introduction Within the framework of the economic growth literature, a consensus has emerged that the diffusion and the productive use of ICT (through its effects on knowledge creation and transfer across industries) can be situated at the material basis of the economic growth of many developed countries since 1995 (Nordhaus, 2002; Jorgenson, Ho & Stiroh, 2005). The main drivers of this fact can be found in a combination of the speed of technological change and product improvement in. Economic efficiency of e-learning in higher education… J. Vilaseca – D. Castillo. 192.
(3) ©© Intangible Capital, 2008 – 4(3): 191-211 – ISSN: 1697-9818 doi: 10.3926/ic.2008.v4n3.p191-211. semiconductors and the continuing fall in their prices. Falling IT prices has provided important economic incentives for the effective diffusion of digital technologies among the different industries in the economy. In fact, this rate price decline is a key component of the cost of capital, and it can explain the impacts of rapidly growing stocks of computers, communication equipment and software. From an international perspective, in recent years we have seen the emergence of an increasing number of empirical studies for different countries: G7 (Jorgenson, Ho & Stiroh, 2005), OECD (Colecchia & Schreyer, 2001), United States (Jorgenson, Ho & Stiroh, 2005; Jorgenson & Stiroh, 2001; Gordon, 2003; Nordhaus, 2002) and the European Union (van Ark et al., 2001; van Ark, 2005; van Ark & Inklaar, 2005). The results of these works show, in general terms, that has been an important surge in investment in ICT technologies after 1995 in mainly all these economies, what has contributed significantly to economic growth in this period. Within the analysis of sources of productivity growth, an important conclusion, in terms of labour, is that productivity growth after 1995 has been accompanied by important changes in the allocation and composition of the work force, since the positive trend in labour quality during the period 1995-2000 is explained by the rise in average levels of educational attainment, as older and less-qualified workers retired and left the labour force and, complementarily, young workers improve their education attainment. The age profile of worker has also changed, with young workers receiving premium rates closer today to the more experienced workers than it was in the past. This empirical finding is consistent with the hypothesis of a skill-biased technical change and the existence of complementarities between ICT inputs and young workers. Therefore, these results show effects of the ICT revolution on labour markets, particularly the fact that college-educated workers have been one of the main sources of employment growth in this period. Therefore, there is a link between productive uses of digital technologies and labour composition, what has implied an expansion of the Education industry. These evidences allow us to affirm that education has a critical role in the sustaining of economic and productivity growth based on ICT investment and usage, not only because its direct allocation to the innovation processes of those industries responsible for knowledge creation, but also for its important incidence on the increase of efficient digital uses by workers across industries in the economy. Economic efficiency of e-learning in higher education… J. Vilaseca – D. Castillo. 193.
(4) ©© Intangible Capital, 2008 – 4(3): 191-211 – ISSN: 1697-9818 doi: 10.3926/ic.2008.v4n3.p191-211. and the improvement of individuals capacities for knowledge management, transfer and productive usage. Therefore, organisations in the supply side of the Education industry, where Universities are included and have an important role, have significant challenges in two main lines: 1) to generalise the access to education across population and encourage the improvement of their educational attainment levels, to respond to the social demand of a long-life learning offer, and to fit with workers needs of specific skills and abilities, and 2) to adapt their organisational and institutional structure to the innovation process for an effective and efficient ICT use in teaching and management activities through the adoption of new business models, and to reach to an intensive use of digital technologies in teaching and learning processes (courses and programs) in order to be able to offer students the achievement of ICT skills and abilities required in the labour market; in other words, to educate students on how to use and, what is more important, how to apply digital technologies to their professional activities. In this field, e-learning can be an opportunity to encourage a general ICT policy in universities that can favour their organisational adaptation to digital requirements in terms of a better performance, and to offer students a continuing education with a better match with the production needs in the knowledge economy. 2. Economic efficiency of e-learning production The use of ICT in the production of education is transforming the way universities are developing learning and teaching processes; new opportunities have emerged to integrate pedagogical and technological resources, to enlarge flexibility across the learning process, and to improve the communication between teachers and students, and the interaction between different educational resources (Collis, 1996). In fact, the increasing use of ICT and particularly Internet in the educational process of universities across OECD countries explains the growing adoption of elearning systems and the development of online courses in universities (European Commission, 2004; University of Southern California, 1990-2006; OECD/CERI, 2005). Since the second half of the nineteen’s there is an increasing belief that the use of e-learning systems in universities may lead to an improve of efficiency in the production of education, in terms of scale (number of student enrolments), students’ achievement and costs (OECD, 1998); in other words, there is the. Economic efficiency of e-learning in higher education… J. Vilaseca – D. Castillo. 194.
(5) ©© Intangible Capital, 2008 – 4(3): 191-211 – ISSN: 1697-9818 doi: 10.3926/ic.2008.v4n3.p191-211. intuition that the intensive use of information and communication technologies and the development of online courses may allow universities to achieve better levels of output and input efficiency. But little theoretical and empirical research has been done in this field (Carnoy, 2002). The analysis of the effects of innovations in the technology of teaching and learning on students’ attitude towards and performance of the learning process is the most explored field, which seems to be evolving towards a consensus that an appropriate use of digital technologies in higher education can have significant positive effects on students’ attitude towards learning and on students’ achievement (Talley, 2005). Recent research (Sosin et al., 2004) has demonstrated that the results of previous works, showing a worse performance of online students (Coates et al., 2004; Brown & Liedholm, 2002) respect to face-to-face students, can be explained by the fact that different manners of technology usage; in other words, the availability of innovations in the technology of teaching and learning do not affect all teaching and learning methodologies equally. Fewer research studies can be found within the economic efficiency approach, and they are particularly concentrated in the cost-efficiency analysis with case study methodology (Bates, 1995; Hülsmann, 2000; Osiakwan & Wright, 2001; Rumble, 2001). The main results in this field show that costing structure of online courses is characterised by a high weigh of fixed costs that allows the attainment of a dynamic of scale economies based upon the reduction of marginal costs. This paper aims to contribute to the empirical analysis of e-learning efficiency at university level through the adoption of an industrial-based methodology following Carnoy’s proposal (2002) for the study of changes in higher education as a result of ICT investment and usage, taking in account that the production of education, as other industries within the knowledge production sector, are facing an increasing competence for students and financial resources driven by the development of elearning. And assuming the multi-product nature of universities based on the multiproduct cost concepts (Baumol et al., 1982). ICT adoption and usage in the Education industry explains the emergence and development of the e-learning market, characterised by relative high levels of competition and internationalization. The activity of e-learning can be defined as the use of information and communication networks to develop teaching and. Economic efficiency of e-learning in higher education… J. Vilaseca – D. Castillo. 195.
(6) ©© Intangible Capital, 2008 – 4(3): 191-211 – ISSN: 1697-9818 doi: 10.3926/ic.2008.v4n3.p191-211. learning processes (Rosenberg, 2001). Its own definition allows us to identify the three main characteristics of the net-based education process: first, the fact that the education activity is developed in a network basis makes possible the immediate update, the storage, the recovery, the distribution ant the easy sharing of contents and information; second, all educational resources and communication processes. are. integrated. in. net-based. learning. environments;. and,. third,. educational resources surpass the traditional framework due to ICT use, what leads to new methodological solutions. From an investment perspective, e-learning processes are different from traditional ones because they are based on the intensive use of digital technologies as a way for the teaching and learning process development. The efficient use of these general-purpose. technologies. requires. some. complementary. investments. in. organisational and methodological structures, in order to make them more specific and, therefore, useful to meet university needs, in terms of technical innovation and, specially, of the methodological adjustment to digital devices and the improvement of labour knowledge and skills required for an effective use of ICT in the production of education. This new patterns in investment implies an important shift from physical to technological and, at some extent, intangible capital investment within the technical relation of production of e-learning in universities. In this sense, it is well-known (Phelps, Wells, Ashworth & Hahn, 1992; Temple 1995; Whalen & Wright, 1999; Rumble, 2001; Rumble, 1989; Bates, 2003) that the production of courses based on e-learning systems has a timing structure with three different phases: 1) the planning and production stage, characterised by an important investment in labour (teachers, technicians and methodology specialists) for the design of the courses’ content and format, in copyrights for the development of didactic materials, in software licenses or production, hardware, and training; 2) the development stage, where the reproduction and distribution of didactic material are involved, as well as the capital maintenance; and 3) the online teaching and administration support to students. The nature of e-learning process has an important economic implication: it is based on a specific costing structure, with high initial fixed costs that are consistent with decreasing marginal costs if it is accompanied with a flexible methodological and organisational structure (Hülsmann, 2000).. Economic efficiency of e-learning in higher education… J. Vilaseca – D. Castillo. 196.
(7) ©© Intangible Capital, 2008 – 4(3): 191-211 – ISSN: 1697-9818 doi: 10.3926/ic.2008.v4n3.p191-211. Therefore, the expansion of e-learning provision in universities will be accompanied with a relative high investment in ICT infrastructure and digital applications, as well as in methodological issues (courses designs, didactic materials, etc.) and labour adjustments at the university level. This capital accumulation required for the increase of the production capacity must be consistent with increasing rates of productivity in order to make universities able to educate a higher number of students without any reduction in quality standards. Therefore, economic viability of e-learning systems in universities is based on productivity gains. Productivity gains in an ICT-based activity can be explained by the fact that efficient uses of digital infrastructures in the provision of education allows for at least three benefit effects, which are related to the organisational structure: 1) the attainment of increasing scale returns to investment (due to low marginal costs of reproduction and distribution), 2) the chance to easier outsource operational parts of some critical activities (due to an organisational structure based on networking processes), and 3) the possibility to share assets’ control and use (Vilaseca et al., 2002). 3. Hypotheses and methodology Within this framework, this paper aims to demonstrate the following hypotheses: H1: The increase of productivity in universities’ e-learning systems, in terms of labour productivity growth, is mainly explained by the increase of university’s efficiency (total factor productivity). H2: Economic efficiency improvement in the production of e-learning is based on universities’ ability to exploit benefit effects from digital uses, as the shift from fixed to variable costs and the increase of assets rotation, consistent with the attainment of scale economies. The technical relation that underlies the production of education implies, as in other production processes, the allocation and combination of different inputs in order to generate one or more outputs, and leads, within the framework of industrial economics, to the assumption of an objective of efficiency in production in terms of maximizing the quantity of output and minimizing the consumption of inputs. Therefore, this relation between inputs and outputs can be expressed as a production function (Hanushek, 1986). A general industry-based formulation Economic efficiency of e-learning in higher education… J. Vilaseca – D. Castillo. 197.
(8) ©© Intangible Capital, 2008 – 4(3): 191-211 – ISSN: 1697-9818 doi: 10.3926/ic.2008.v4n3.p191-211. applying the standard growth accounting framework for studying the productivity of inputs is as follows (Brynjolfsson & Hitt, 2003):. Yit = Af (K it , Tit , C it , Lit ; i, t ). (1). We assume that the production process of e-learning in universities must be represented by a production function (f) that links output (Y) with four kinds of inputs: ordinary capital stock (K), ICT capital stock (T), intangible capital stock (C), and labour (L). In addition, we assume that the production function is affected by time (t) and universities’ specificities (i). Following common practice, we consider that this relationship can be approximated by a Cobb-Douglas production function, and written in logarithms:. Y = A(i, t )K β1 T β 2 C β 3 Lβ 4. (2). y = a(i, t ) + β1 k + β 2 t + β 3 c + β 4 l. (3). The term a is often considered as the multifactor productivity level or the total factor productivity level, and it will capture differences in output production across universities and over time that are not accounted for changes in inputs use. This kind of productivity is usually applied to time series or panel data sets by taking the time differences of variables in logarithms to calculate growth rates. For growth accounting exercises (e.g., Jorgenson, Ho & Stiroh, 2005), the values of the elasticity parameters (βi) are assumed to be equal to their theoretical values; this assumption enables total factor productivity (TFP) growth and the contribution of each input to be determined without the need of any econometric estimation. Therefore, under neoclassical assumptions the output elasticity is equal to the ratio of the current dollar cost of each input to total input costs. To calculate year variation of TFP we use Caves, Christensen and Diewert (1982) approach, and denote each input’s contribution to be. Economic efficiency of e-learning in higher education… J. Vilaseca – D. Castillo. ϖ i , being i = (k, t, c, l):. 198.
(9) ©© Intangible Capital, 2008 – 4(3): 191-211 – ISSN: 1697-9818 doi: 10.3926/ic.2008.v4n3.p191-211. 1 1 1 1 a& = at − a t −1 = (qt − q t −1 ) − ϖ k (k t − k t −1 ) − ϖ t (t t − t t −1 ) − ϖ c (ct − ct −1 ) − ϖ l (l t − l t −1 ) 2 2 2 2. (4). The economic effects affecting the allocation and use of inputs, and, therefore, universities’ internal efficiency, can be formally expressed as follows: 1) The shift from fixed to variable costs, through outsourcing mechanisms enhanced by ICT use, shows universities’ capability to optimize their costing structure, as a higher amount of inputs’ services are manageable in the short term (Verry & Layard, 1975; Rumble, 1997; Grossman & Helpman, 2005). This “flexibility effect” can be measured by the decrease trend of marginal costs:. F=. δC it <1 δYit. (5). 2) Assets rotation is a measure of universities’ efficiency in the use of assets (TA) for education’s production, and indirectly expresses an organisational policy that aims to share assets’ investments and control based on ICT properties of networking and reproduction (Shapiro & Varian, 1999). This “assets effect” can be expressed as follows:. O=. δYit >0 δTAit. (6). 3) The two above economic effects must be consistent with the attainment of increasing returns to scale, one of the main economic properties of ICT-based goods (Shapiro & Varian, 1999), especially when the value of this goods depends on the network size as in e-learning production. These e-learning scale economies can be formally measured as the marginal productivity of inputs that is equal to the relation between average incremental cost and marginal costs (Cohn, Rhine & Santos, 1989):. C (Yit ) − C (Yit −1 ) Yit AIC (i, t ) = >1 S (i, t ) = δC MC (i, t ) δYit. Economic efficiency of e-learning in higher education… J. Vilaseca – D. Castillo. (7 ). 199.
(10) ©© Intangible Capital, 2008 – 4(3): 191-211 – ISSN: 1697-9818 doi: 10.3926/ic.2008.v4n3.p191-211. 4. Data and measures To analyse the production of e-learning in universities we have selected a set of four e-learning universities within OECD countries through the period 1997-2002, and we have computed only outputs and inputs related to the educational production process. These four universities are: the Open University of Catalonia (UOC), a Spanish public university managed by a private foundation created by Catalan Government in 1994; Athabasca University, a Canadian public university created by Alberta’s Government in 1970; Capella University, a private university created in 1993 in Minneapolis, Minnesota (USA); and the Open Learning Agency of Australia (OLAA), a private consortium of seven Australian universities, created by Australian Commonwealth Government in 1992. The data have been obtained through a questionnaire and through the universities’ financial statements. The calculation of TFP growth index and the contribution of the different inputs to output growth require the measure of the following variables: Output (Y): Following the works by Maynard (1971), Bottomely (1972), Bowen (1980) or McLaughlin (1980) we have measured the output of education through students enrolments adjusted to fiscal years. The number of students enrolled is adjusted to the equivalent number of full-time students. The proxy of output’s value is the average value of labour market earnings related to the level of students’ educational attainment and labour experience. Quantities are expressed in euros by converting currencies to euros applying purchase parity power tables by OECD, and computed in current prices. Ordinary Capital Stock (K): Ordinary capital stock is calculated as the net fair value of ordinary capital investments, which is equal to the gross fair value of capital less depreciation. The main categories here are land, buildings and furniture. ICT Capital Stock (T):. Economic efficiency of e-learning in higher education… J. Vilaseca – D. Castillo. 200.
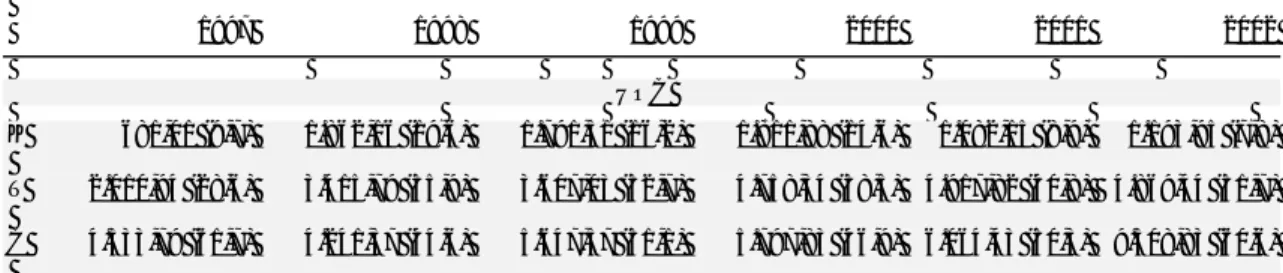
(11) ©© Intangible Capital, 2008 – 4(3): 191-211 – ISSN: 1697-9818 doi: 10.3926/ic.2008.v4n3.p191-211. ICT capital stock is calculated as the net fair value of ICT capital investments, which is equal to the gross fair value of capital less depreciation. The main issues considered here are hardware and telecommunications’ equipment. Intangible Capital Stock (C): Intangible capital stock is calculated as the net fair value of intangible capital investments, which is equal to the gross fair value of capital less depreciation. The main issues here are software, copyrights, innovation investments and workers training. Labour (L): Labour has been measured through the number of workers devoted to education activity. Inputs cost contribution: For each input, cost contribution is the percentage of the input cost over total input costs. Total cost is the sum of capital cost and labour cost. Capital cost, for each type of capital considered, is calculated by estimating the cost of capital use through the addition of liabilities’ cost and depreciation levels. And labour cost is measured by gross labour expenses, that contains wages and other labour expenses, mainly social assurance expenses. 5. Results The data collected from the four e-learning universities under study reveals that the growth of. e-learning. production. requires an. important. investment in. information technologies infrastructure, and also in complementary assets needed to run net-based higher education campuses, such as software applications, new methodologies and contents’ copyrights (see table 1). In fact, investment in ICT and intangible capital has a higher weight than investment in physical capital in every case, except for Athabasca University, and for every year considered. This divergence. between. Athabasca. University. and. the. other. three. e-learning. universities is due to the fact that the departure point for Athabasca is something different: it was created as a traditional distance education university and it has been involved in a changing process since middle nineteen’s in order to adapt its Economic efficiency of e-learning in higher education… J. Vilaseca – D. Castillo. 201.
(12) ©© Intangible Capital, 2008 – 4(3): 191-211 – ISSN: 1697-9818 doi: 10.3926/ic.2008.v4n3.p191-211. organisational structure to e-learning standards. In the other hand, the Open University of Catalonia (UOC) and the Open Learning Agency of Australia (OLAA) show the higher percentages of ICT and intangible investment.. In thousand of euros and in percentages (the relative value of each input over the total capital investment) 1997. 1998. 1999. 2000. 2001. 2002. K. 681,01 (9,7). 1.862,16 (19,6). 1.791,51 (16,2). 1.811,88 (14,6). 1.082,15 (8,9). 1.193,95 (7,8). T. 2.010,94 (28,6). 3.415,79 (35,9). 3.607,03 (32,7). 4.758,34 (38,5). 4.917,82 (40,8). 4.869,44 (31,7). C. 4.333,79 (61,7). 4.241,37 (44,6). 5.647,57 (51,1). 5.797,83 (46,9). 6.064,43 (50,3). 9.308,83 (60,6). K. 687,66 (30,3). 687,66 (22,8). 628,51 (15,4). 591,39 (11,1). 974,15 (20,7). 1.037,32 (19,0). T. 796,45 (35,1). 1.150,96 (38,2). 1.592,79 (39,1). 2.201,05 (41,4). 1.645,82 (35,1). 1.913,36 35,0). C. 787,28 (34,7). 1.173,84 (39,0). 1.849,60 (45,4). 2.523,55 (47,5). 2.075,21 (44,2). 2.510,01 (46,0). UOC. Capella University. Athabasca University K. 8.369,53 (74,9). 8.061,03 (68,0). 7.871,85 (65,3). 7.797,22 (64,6). 7.835,60 (59,6). 8.420,17 (60,5). T. 2.133,46 (19,1). 2.280,94 (19,3). 2.966,60 (24,6). 3.080,83 (25,5). 3.901,97 (29,7). 4.237,00 (30,4). C. 674,15 (6,0). 1.503,63 (12,7). 1.213,24 (10,1). 1.195,90 (9,9). 1.402,20 (10,7). 1.264,77 (9,1). OLAA K. 16,31 (10,6). 11,07 (13,6). 10,63 (7,9). 8,44 (6,3). 111,64 (9,3). 92,31 (5,7). T. 38,07 (24,8). 33,20 (40,8). 42,52 (31,5). 47,83 (36,0). 1.004,79 (83,9). 1.244,02 (76,8). C. 99,40 (64,6). 37,01 (45,5). 81,73 (60,6). 76,72 (57,7). 81,66 (6,8). 283,35 (17,5). K. 9.754,51 (47,3). 10.621,92 (43,4). 10.302,50 (37,7). 10.208,93 (34,2) 10.003,54 (32,2) 10.743,75(29,5). T. 4.978,92 (24,1). 6.880,89 (28,1). 8.208,94 (30,1). 10.088,05 (33,7) 11,470,40 (36,9) 12.263,82 (33,7). C. 5.894,62 (28,6). 6.955,85 (28,4). 8.792,14 (32,2). Average. 9.594 (32,1). 9.623,50 (30,9) 13.366,96 (36,7). Source: own elaboration from questionnaire and universities’ financial states.. Table 1. Investment structure in e-learning universities. Nevertheless, the important thing derived from this picture is that the rise of elearning production, in terms of students enrolled, is consistent with important rates of ICT and intangible capital accumulation. In this sense, our results show that an average growth of 171,44% in students enrolment for the whole period. Economic efficiency of e-learning in higher education… J. Vilaseca – D. Castillo. 202.
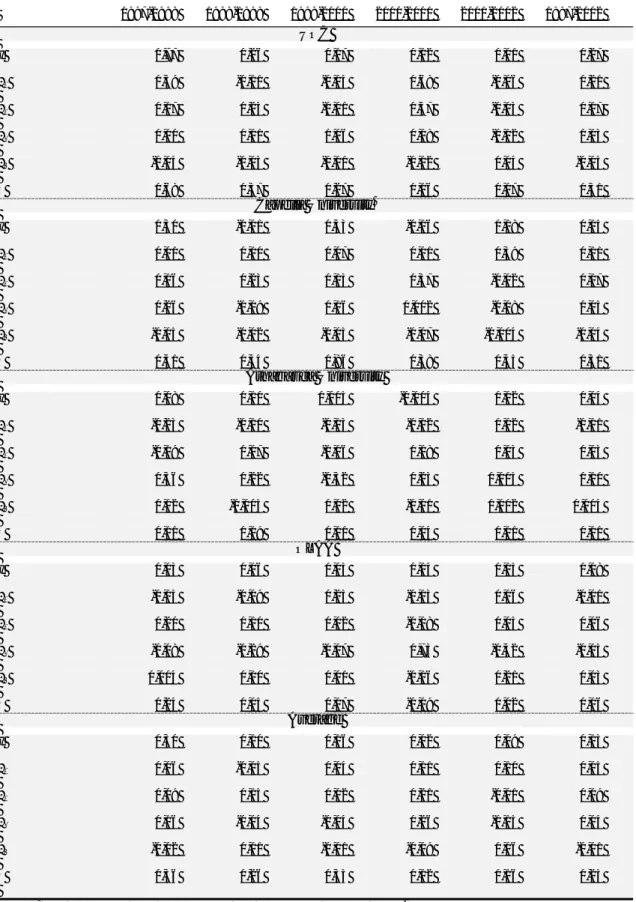
(13) ©© Intangible Capital, 2008 – 4(3): 191-211 – ISSN: 1697-9818 doi: 10.3926/ic.2008.v4n3.p191-211. (1997-2002) is accompanied by an increase of 10,14% in physical capital, 146,31% in information and communication technologies infrastructure and 126,77% in complementary investments to ICT use in e-learning higher education. The production function analysis through equations (3) and (4) has allows us to identify the determinants of labour productivity evolution. Labour productivity is expressed as the relation between students enrolled and personnel devoted to education. activities. (mainly. teachers,. education. and. computer. specialists,. administrative support and staff). Our results (table 2) show that labour productivity has grown 0.13 as average for the period 1997-2002. This increase is mainly explained by total factor productivity improvement, with an average rise of 0.25, followed by ICT capital deepening (0.09), physical capital deepening (0.05) and intangible investments accumulation (0.04). It is also important to remark that that labour inputs have had an average diminishing contribution (-0.01) to labour productivity during the six years considered. Despite of differences in inputs contribution between universities, it can be identified a common trend in the explanation of labour productivity growth: ICT investment shows a positive contribution for the whole period and total factor productivity is the main single factor for every university. Therefore, we can affirm that universities’ investment in ICT and intangible capital for e-learning production is a necessary but not sufficient condition to attain growing productivity rates in education. The production capacity growth in e-learning systems is consistent with a rise in labour productivity if it is accompanied with the improvement of universities’ economic efficiency. These results allow us to confirm the relationship established in hypothesis 1. Economic efficiency captures two different types of phenomena: 1) demand shocks that affect students’ enrolments, and, 2) an internal economic efficiency based on the ability to use information and communication technologies in order to increase the quantity and quality of education production. In fact, both effects are complementary and explain the extent at what universities are able to build up a feasible model for the production of e-learning, i.e. for getting an optimal consumption of inputs to reach demand trends and assuring high quality standards in students’ achievement.. Economic efficiency of e-learning in higher education… J. Vilaseca – D. Castillo. 203.
(14) ©© Intangible Capital, 2008 – 4(3): 191-211 – ISSN: 1697-9818 doi: 10.3926/ic.2008.v4n3.p191-211. 1997-1998. 1998-1999. y. 0,77. 0,26. β1. 0,59. β2. 1999-2000. 2000-2001. 2001-2002. 1997-2002. 0,17. 0,12. 0,01. 0,27. -0,11. -0,04. 0,68. -0,06. 0,21. 0,17. 0,23. -0,01. 0,47. -0,03. 0,17. β3. 0,10. 0,01. 0,06. 0,08. -0,12. 0,03. β4. -0,04. -0,03. -0,01. -0,12. 0,04. -0,03. å. 0,68. 0,37. 0,27. 0,16. 0,07. 0,31. UOC. Capella University y. 0,30. -0,01. 0,43. -0,16. 0,18. 0,15. β1. 0,01. 0,10. 0,07. 0,01. 0,39. 0,11. β2. 0,16. 0,23. 0,13. 0,37. -0,02. 0,17. β3. 0,26. -0,09. 0,16. 0,002. -0,08. 0,05. β4. -0,05. -0,02. -0,05. -0,07. -0,004. -0,04. å. 0,41. 0,44. 0,86. 0,38. 0,45. 0,51. Athabasca University y. 0,08. 0,10. 0,005. -0,004. 0,02. 0,04. β1. -0,23. -0,10. -0,13. -0,12. 0,02. -0,11. β2. -0,19. 0,07. -0,06. 0,08. 0,03. 0,03. β3. 0,36. 0,22. -0,32. 0,23. 0,005. 0,10. β4. 0,02. -0,005. 0,02. -0,01. 0,002. 0,004. å. 0,11. 0,19. 0,11. 0,04. 0,11. 0,11. OLAA y. 0,03. 0,06. 0,03. 0,14. 0,15. 0,08. β1. -0,15. -0,09. 0,25. -0,13. 0,06. -0,01. β2. 0,20. 0,10. 0,02. -0,08. 0,05. 0,06. β3. -0,08. -0,29. -0,07. 0,73. -0,42. -0,03. β4. 0,004. 0,10. 0,01. -0,16. 0,21. 0,03. å. 0,24. 0,05. 0,07. -0,09. 0,02. 0,06. Average y. 0,30. 0,10. 0,16. 0,02. 0,09. 0,13. β1. 0,06. -0,05. 0,04. 0,11. 0,10. 0,05. β2. 0,09. 0,15. 0,02. 0,21. -0,01. 0,09. β3. 0,16. -0,04. -0,04. 0,26. -0,15. 0,04. β4. -0,02. 0,01. -0,01. -0,09. 0,06. -0,01. å. 0,36. 0,26. 0,33. 0,12. 0,16. 0,25. Source: own elaboration from questionnaire and universities’ financial states.. Table 2. Labour productivity growth and inputs contribution. Economic efficiency of e-learning in higher education… J. Vilaseca – D. Castillo. 204.
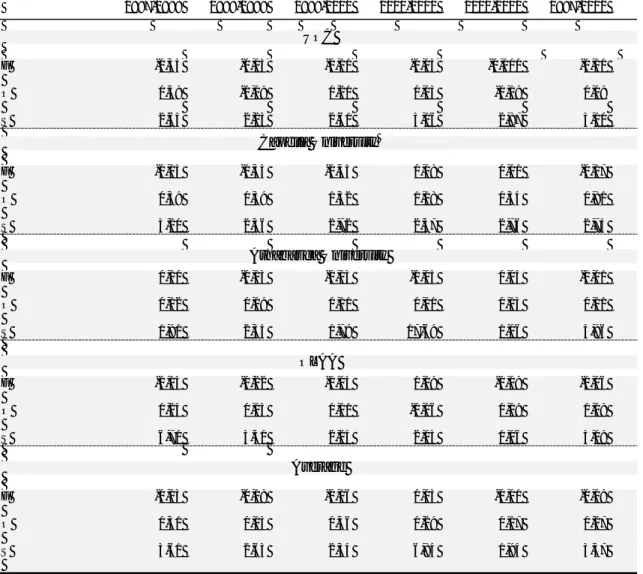
(15) ©© Intangible Capital, 2008 – 4(3): 191-211 – ISSN: 1697-9818 doi: 10.3926/ic.2008.v4n3.p191-211. We have also analyse if the improvement of economic efficiency can be explained through three benefit effects related to the impact of digital uses on inputs allocation and consumption (table 3): 1) the decrease of marginal costs (which we have called flexibility effect, F); 2) the increase of assets rotation (or assets effect, O), and 3) the attainment of scale economies (S). The calculation of parameter F in equation (5) has allow us to verify that there is a common trend in all four universities to increasing the weigh of variable costs that has raised from an average of 37,95% in 1997 to 42,96% over total costs in 2002. This shift from fixed to variable costs has been consistent with a decreasing pattern in marginal costs (with an average value of -0.09). In fact, if F values are compared with å results in table 2, there is evidence of a positive correlation between a costing structure that tends to a higher weigh of variable costs and the attainment of greater rates of economic efficiency growth. In other words, universities with a higher rate of change from fixed to variable costs and a more accelerated trend of decreasing marginal costs show a greater rate of total factor productivity growth. The results for the parameter O based on equation (6) show that in each case there is a trend to increase the assets rotation, which range from a value of 0.81 for Capella University to a 0.08 in the Open Learning Agency of Australia. Moreover, if we compare these values (table 3) and those related to TFP (table 2), we can observed that in average and for the whole sample and period there is a positive relation between the minimisation of assets disposal (0.27) and the improvement of economic efficiency (0.25). Indeed, it can also be observed for every university a direct relation between the annual values of the assets rotation indicator (O) and the annual rates of TFP growth. Finally, we can affirm that decreasing marginal costs and assets rotation are consistent with the attainment of scale economies, which in fact it seems to explain an important part of the economic efficiency growth, taking in account the high values of this indicator in almost every year considered. Our results show that there are increasing returns to scale for e-learning universities in the middle term (with an average value of 3.47 for the whole period) and that it can not be observed a decreasing trend of growth of these scale economies during the period 1997-2002.. Economic efficiency of e-learning in higher education… J. Vilaseca – D. Castillo. 205.
(16) ©© Intangible Capital, 2008 – 4(3): 191-211 – ISSN: 1697-9818 doi: 10.3926/ic.2008.v4n3.p191-211. With the abovementioned results, we can confirm that there is a trend within the e-learning universities in our sample to raise variable costs while decreasing marginal costs, and to increase assets rotation, consistent with the attainment of scale economies; therefore, we can verify our hypothesis 2.. 1997-1998. 1998-1999. 1999-2000. 2000-2001. 2001-2002. 1997-2002. UOC F. -0,33. -0,05. -0,11. -0,05. -0,001. -0,11. O. 0,48. -0,09. 0,21. 0,03. -0,19. 0,09. S. 2,65. 2,23. 2,61. 5,16. 2,87. 3,10. Capella University F. -0,15. -0,33. -0,45. 0,08. 0,01. -0,17. O. 0,39. 0,39. 1,52. 1,18. 0,54. 0,81. S. 3,20. 2,56. 2,72. 2,47. 2,76. 2,74. F. 0,10. -0,13. -0,03. -0,05. 0,05. -0,01. O. 0,12. 0,19. 0,11. 0,01. 0,13. 0,11. S. 1,91. 2,35. 1,79. 17,69. 1,06. 4,96. Athabasca University. OLAA F. -0,13. -0,22. -0,05. 0,19. -0,09. -0,06. O. 0,24. 0,03. 0,01. -0,06. 0,19. 0,08. S. 6,70. 3,40. 2,24. 2,03. 1,06. 3,09. Average F. -0,13. -0,18. -0,16. 0,05. -0,01. -0,09. O. 0,31. 0,13. 0,46. 0,29. 0,17. 0,27. S. 3,61. 2,63. 2,34. 6,84. 1,94. 3,47. Source: own elaboration from questionnaire and universities’ financial states.. Table 3. Economic effects of ICT use in e-learning universities. 6. Conclusion and discussion The importance of education for productivity and economic growth, in terms both of quality of labour and maintenance of innovation rates, explains the emergence and diffusion of e-learning since middle nineteen’s. E-learning is nowadays a. Economic efficiency of e-learning in higher education… J. Vilaseca – D. Castillo. 206.
(17) ©© Intangible Capital, 2008 – 4(3): 191-211 – ISSN: 1697-9818 doi: 10.3926/ic.2008.v4n3.p191-211. widespread technology of producing higher education in universities of OECD countries. Some work has started to assess students’ achievement based on different ICT uses. But little work has been yet done to analyse if e-learning is an efficiency way in economic terms to produce higher education, especially because there are no available data in official statistics. Despite of these important constrains, this paper aims to contribute to the study of economic efficiency of e-learning through the analysis of a little sample of e-learning universities during a period of time (19972002). We have wanted to obtain some empirical evidence to understand if elearning is a feasible model of providing education for universities and which are the variables that allow for feasibility attainment. We have adopted an industrial economics approach to determine a suitable production. function. for. e-learning. production. that. allows. us. to. calculate. productivity growth and to identify its main determinants. The analysis done lets us to confirm that the adoption of e-learning systems in higher education implies a shift in the technology of education production from a labour-intensive production process to a capital-intensive one, with important theoretical effects on higher education development, especially because it can become a cheaper way for universities to spread the provision of education based on the attainment of scale economies related to capital investment. The results of the production function analysis show that the increase of e-learning production, i.e. the rise of the number of students enrolled is consistent with increasing labour productivity rates. Therefore, there exist relative cost labour savings when it raises the number of students. This cost labour savings are explained in part by the increasing investment in ICT infrastructure and complementary assets (software applications, technological and methodological innovations and workers’ training) but mainly by the improvement of universities’ economic efficiency (or total factor productivity) based on universities’ ability to embody some benefit effects from ICT uses. The improvement of total factor productivity in e-learning production can be explained especially by the attainment of scale economies derived from the exploitation of economic benefits of ICT-goods investment (reproduction and reutilisation); but also by two organisational innovations: outsourcing processes that Economic efficiency of e-learning in higher education… J. Vilaseca – D. Castillo. 207.
(18) ©© Intangible Capital, 2008 – 4(3): 191-211 – ISSN: 1697-9818 doi: 10.3926/ic.2008.v4n3.p191-211. leads to the increase of variable costs consistent with the decrease of marginal costs, and the sharing of assets’ control and use that allow for a rise in assets rotation. References BATES, A. W. (1995). Technology, open learning and distance edutacion. London: Routledge. BATES, A. W. (2003): Technology, E-Learning and Distance Education. London and New York: Routledge. BAUMOL, W. J.; PANZAR, J. C.; WILLIG, D. G. (1982). Contestable Markets and the Theory of Industry Structure. New York: Harcourt Brace Jovanovich. BROWN, B. W.; LIEDHOLM, C. E. (2002). Teaching Microeconomic Principles. Can Web Courses Replace the Classroom in Principles of Microeconomics? American Economic Review Papers and Procedings, 92(2): 444-448. BRYNJOLFSSON, E.; HITT, L. M. (2003). Computing Productivity: Firm-level Evidence. Working Paper 139. MIT Sloan School Working Paper. Cambridge, Massachusetts. Available online at: <http://ebusiness.mit.edu/research/papers.html>. CARNOY, M. (2002). The Effectiveness of ICT in Schools: Current Trends and Future Prospects, OECD Conference, Tokyo, Japan. December. CAVES, D. W.; CHRISTENSEN, L. R; DIEWERT, E. (1982). Multilateral comparisons of output, input and productivity using superlative index numbers. Economic Journal 92: 73-86. CENTRE FOR EDUCATIONAL RESEARCH AND INNOVATION (CERI) (2005). Elearning in Tertiary Education. Where do we Stand? OECD. COATES, D.; HUMPHREYS, B. R.; KANE, J.; VACHRIS, M. A. (2004). No significant distance between face-to-face and online instruction: Evidence form principle of economics. Economics of Education Review, 23: 533-546. COLECCHIA, A.; SCHREYER, P. (2001). ICT Investment and Economic Growth in the 1990s: Is the United States a Unique Case? A comparative study of nine OCDE Economic efficiency of e-learning in higher education… J. Vilaseca – D. Castillo. 208.
(19) ©© Intangible Capital, 2008 – 4(3): 191-211 – ISSN: 1697-9818 doi: 10.3926/ic.2008.v4n3.p191-211. Countries.. STI. Working. Papers. 2001/7.. Available. online. at:. <http://www.oecd.org/dsti/sti/prod/sti_wp.htm>.. COLLIS, B. (1996). Tele-learning in a digital world: The future of distance learning. London: International Thomson Computer Press. GORDON, R. J. (2003)- Hi-Tech Innovation and Productivity Growth: Does Supply Create its Own Demand? NBER Working Paper 9437. [On-line]. Disponible a URL: <http://www.nber.org/papers/w9437>.. HANUSHEK, E. A. (1986). The economics of schooling: Production and efficiency in public schools. Journal of Economic Literature, 24: 1141-1177. HÜLSMANN, T. (2000). The costs of open learning: A handbook. Oldenburg: Biblioteks- und Informationssystem der Universität Oldenburg. JORGENSON, D. W.; STIROH K. J. (2001). Information Technology and the US Economy. American Economic Review, 91: 1-32. JORGENSON, D. W.; HO, M. S.; STIROH K. J. (2005). Productivity, volume 3. Information Technology and the American Growth Resurgence. Cambridge: The MIT Press. NORDHAUS, W. D. (2002). Alternative Methods for Measuring Productivity Growth Including Approaches When Output is Measured With Chain Indexes. Woking Paper, Yale University. June. OECD (1998). Redefining Tertiary Education. OECD, Paris. OSIAKWAN, C.; WRIGHT D. (2001). Distance Training for Operating Equipment: A Cost-Benefit and Return-on-Investment Analysis. American Journal of Distance Education, 15(1): 155-161. PHELPS, R. H.; WELLS, R. A.; ASHWORTH, R. L.; HAHN H. A. (1991). Effectiveness and Costs of Distance Education Using Computer-Mediated Communication. American Journal of Distance Education, 5(3): 7-19.. Economic efficiency of e-learning in higher education… J. Vilaseca – D. Castillo. 209.
(20) ©© Intangible Capital, 2008 – 4(3): 191-211 – ISSN: 1697-9818 doi: 10.3926/ic.2008.v4n3.p191-211. PLS RAMBOLL MANAGEMENT (2004). Studies in the Context of the E-learning initiative: Virtual Models of European Universities. Final Report to the EU Commission, DG Education & Culture. March. ROSENBERG, M. J. (2001). E-learning. Strategies for Delivering Knowledge in the Digital Age. New York: McGraw-Hill. RUMBLE, G. (1989). The management of distance learning systems. UNESCO: International Institute for Educational Planning, Fundamentals of Educational Planning. Paris. RUMBLE, G. (2001). Just How Relevant is E-education to Global Educational Needs. Open Learning 16(3): 223-232. SOSIN, K.; B. BLECHA, R.; AGARWAL, R.; BARTLETT, J.; DANIEL, J. (2004). Efficiency in the use of technology in economic education: Some preliminary results. American Economic Review 94: 253-258. TALLEY, D. A. (2005). Technology and Teaching: Learning in a High-Tech Environment Revisited. Dakota State University. Mimeo. TEMPLE, H. (1995). Cost Effectiveness of Open Learning for Small Firms. A study of first experiences of open learning. London: Department for Education and Employment. UNIVERSITY OF SOUTHERN CALIFORNIA (1994-2002). National Survey of Desktop Computing in Higher Education. The Campus Computing Project, Encino, California. VAN ARK, B. (2005). Does the European Union Need to Revive Productivity Growth?. Working Paper GD-75. Groningen Growth and Development Centre. University. of. Groningen.. April.. Available. online. at:. <http://www.eco.rug.nl/GGDC/index-publ.html#top>. VAN ARK, B.; INKLAAR, R. (2005). Catching up or Getting Stuck? Europe’s Trouble to Exploit ICT’s Productivity Potential, Working Paper GD-79. Groningen Growth and Development Centre. University of Groningen. September. Available online at: <http://www.eco.rug.nl/GGDC/index-publ.html#top>. Economic efficiency of e-learning in higher education… J. Vilaseca – D. Castillo. 210.
(21) ©© Intangible Capital, 2008 – 4(3): 191-211 – ISSN: 1697-9818 doi: 10.3926/ic.2008.v4n3.p191-211. VAN ARK, B.; MELKA, J.; MULDER, N.; TIMMERS, M; YPMA G. (2002). ICT Investment and Growth Accounts for the European Union, 1980-2000. European Commission, Brussels, June. VILASECA, J.; TORRENT, J.; CASTILLO, D. (2003). Using costing models in knowledge-based production: The case of Spanish firms. Sevilla:. 26th.Annual. Congress of the European Accounting Association (EAA). April. WHALEN, T.; WRIGHT, D. (1999). Methodology for Cost-Benefit Analysis of WebBased Tele-Learning: Case Study of the Bell Online Institute. American Journal of Distance Education, 15(1): 24-44.. ©© Intangible Capital, 2008 (www.intangiblecapital.org). El artículo está con Reconocimiento-NoComercial 2.5 de Creative Commons. Puede copiarlo, distribuirlo y comunicarlo públicamente siempre que cite a su autor y a Intangible Capital. No lo utilice para fines comerciales. La licencia completa se puede consultar en http://creativecommons.org/licenses/by-nc/2.5/es/. Economic efficiency of e-learning in higher education… J. Vilaseca – D. Castillo. 211.
(22)
Figure
Documento similar
In the “big picture” perspective of the recent years that we have described in Brazil, Spain, Portugal and Puerto Rico there are some similarities and important differences,
The analysis presented shows that energy efficient motors are an opportunity for improving the efficiency of motor systems, leading to large cost-effective energy savings,
‘What is education for?’, by Roger Marples, critically discusses three philosophical curriculum theories in relation to the aims of education (namely, RS Peters’ and
Controlling the model by the labour and economic characteristics (employment, remittances, tenure of residence), the individual characteristics (family in origin, education
We want to follow the proof of the existence of Delaunay surfaces given in the previous section in order to prove the existence of a smooth family of normal graphs over the
Parameters of linear regression of turbulent energy fluxes (i.e. the sum of latent and sensible heat flux against available energy).. Scatter diagrams and regression lines
It is generally believed the recitation of the seven or the ten reciters of the first, second and third century of Islam are valid and the Muslims are allowed to adopt either of
In the preparation of this report, the Venice Commission has relied on the comments of its rapporteurs; its recently adopted Report on Respect for Democracy, Human Rights and the Rule
