Text detection and recognition in natural images using computer vision techniques
218
0
0
Texto completo
(2)
(3) A mi familia.
(4)
(5) Agradecimientos En primer lugar quisiera darle las gracias a Luis Miguel Bergasa Pascual por la oportunidad que me ofreció para realizar esta tesis doctoral, por las innumerables revisiones de artı́culos y documentos, las reuniones de seguimiento y por permitirme disfrutar de los congresos a los que he asistido (Vigo, USA, Portugal, Japón), los congresos en los que he colaborado (el IV’12 en Alcalá) y por las estancias de investigación que he realizado (Inglaterra, Alemania), los cuales me han permitido conocer numerosos lugares y distintas culturas y me han hecho crecer como persona y, porqué no decirlo, sentirme algo más pequeño dentro de este mundo. Ya solo por esto, estos largos años de doctorado han merecido la pena. Quiero tener una mención especial a Miguel Ángel Sotelo, del cual, aunque no haya sido mi tutor, he aprendido muchas cosas durante estos cinco años que he estado trabajando en el grupo de investigación Robesafe, en especial a trabajar en equipo y a colaborar en proyectos de investigación grandes e importantes, por su sentido del humor, por su iniciativa y por permitirme haber formado parte de ese proyecto que ha sido Vision Safety Technologies. Durante estos años han pasado muchas personas por Robesafe. De todos ellos he aprendido mucho y he compartido muy buenos momentos con ellos. Gracias a Fer y sus chistes malos (y algunos no tan malos, todo hay que decirlo) que animan el laboratorio O202, a Ángel, Estefanı́a, Eduardo, al casado Yebes, a Almazán, Gavilán, Balky, Óscar, Carlos, Jesús, Pablo, Sebas, Iván, Noelia, Pedro, Llorca, Nacho, Raúl, Sergio, Garrido, Manuel Ocaña, y un largo etcétera. Tengo muchı́simo que agradecer a Krystian Mikolajczyk. Krystian me dio la oportunidad de acudir a su laboratorio en Guildford cuando aún no sabı́a casi nada de visión. Durante los tres meses que estuve trabajando con él aprendı́ mucho y fue capaz de orientar mi tesis cuando me encontraba un poco perdido sobre qué camino seguir. La experiencia vivida en Guildford fue de las mejores de mi vida, no solo en el plano laboral, sino sobre todo en el personal. Allı́ conocı́ a muchas personas a las que no querı́a dejar de mencionar, como a Edu (the Mozart of Guildford), Akshay, Raquel, Carmen, Lorena (nunca olvidaré ese “crucero” que tuvimos que tomar para poder volver a la madre patria), a Alberto, Leti, Dani, Laura (por esos language exchanges sin los que no habrı́a podido aprender inglés tan rápido) y a todos los que me olvido, que sé que son muchos. Gracias a Hermann Ney por permitirme visitar y trabajar en el laboratorio que él dirige en Aachen, y por todas las facilidades que me dio. Allı́ aprendı́ mucho y fue donde empezó a gestarse el final de esta tesis. También quiero tener un especial agradecimiento al profesor Javier Macı́as, quien tuvo la amabilidad de introducirme de forma altruista en el mundo de la Programación Dinámica. Sin su ayuda, una buena parte de esta tesis no habrı́a sido posible. Sin duda a las personas a las que más tengo que agradecer son a mi familia, mis padres y mi hermano, por el apoyo constante durante todos estos años, por creer en mi y por la v.
(6) vi. vida que me han dado. Espero haber sido un buen hijo. Y por último, y no menos importante, tengo mucho que agradecer a una persona que apareció hace unos meses en mi vida y que, sin duda, es la persona más especial que he tenido en mi vida y que tengo hoy en dı́a. Llegó por casualidad, como mucha gente en la vida, y desde entonces me ha hecho muy feliz. Espero que yo también a ella y que sigamos juntos por mucho tiempo. Con ella estoy creciendo como persona y por ello tengo mucho que agradecerle. Gracias por estar ahı́, Luz Marı́a. En la vida hay tinieblas, pero también hay luces. Y tú eres la luz de toda luz. El secreto de la genialidad es el de conservar el espı́ritu del niño hasta la vejez, lo cual quiere decir nunca perder el entusiasmo. Aldous Huxley..
(7) Resumen El reconocimiento de texto en imágenes reales ha centrado la atención de muchos investigadores en todo el mundo en los últimos años. El motivo es el incremento de productos de bajo coste como teléfonos móviles o Tablet PCs que incorporan dispositivos de captura de imágenes y altas capacidades de procesamiento. Con estos antecedentes, esta tesis presenta un método robusto para detectar, localizar y reconocer texto horizontal en imágenes diurnas tomadas en escenarios reales. El reto es complejo dada la enorme variabilidad de los textos existentes y de las condiciones de captura en entornos reales. Inicialmente se presenta una revisión de los principales trabajos de los últimos años en el campo del reconocimiento de texto en imágenes naturales. Seguidamente, se lleva a cabo un estudio de las caracterı́sticas más adecuadas para describir texto respecto de objetos no correspondientes con texto. Tı́picamente, un sistema de reconocimiento de texto en imágenes está formado por dos grandes etapas. La primera consiste en detectar si existe texto en la imagen y de localizarlo con la mayor precisión posible, minimizando la cantidad de texto no detectado ası́ como el número de falsos positivos. La segunda etapa consiste en reconocer el texto extraı́do. El método de detección aquı́ propuesto está basado en análisis de componentes conexos tras aplicar una segmentación que combina un método global como MSER con un método local, de forma que se mejoran las propuestas del estado del arte al segmentar texto incluso en situaciones complejas como imágenes borrosas o de muy baja resolución. El proceso de análisis de los componentes conexos extraı́dos se optimiza mediante algoritmos genéticos. Al contrario que otros sistemas, nosotros proponemos un método recursivo que permite restaurar aquellos objetos correspondientes con texto y que inicialmente son erróneamente descartados. De esta forma, se consigue mejorar en gran medida la fiabilidad de la detección. Aunque el método propuesto está basado en análisis de componentes conexos, en esta tesis se utiliza también la idea de los métodos basados en texturas para validar las áreas de texto detectadas. Por otro lado, nuestro método para reconocer texto se basa en identificar cada caracter y aplicar posteriormente un modelo de lenguaje para corregir las palabras mal reconocidas, al restringir la solución a un diccionario que contiene el conjunto de posibles términos. Se propone una nueva caracterı́stica para reconocer los caracteres, a la que hemos dado el nombre de Direction Histogram (DH). Se basa en calcular el histograma de las direcciones del gradiente en los pixeles de borde. Esta caracterı́stica se compara con otras del estado del arte y los resultados experimentales obtenidos sobre una base de datos compleja muestran que nuestra propuesta es adecuada ya que supera otros trabajos del estado del arte. Presentamos también un método de clasificación borrosa de letras basado en KNN, el cual permite separar caracteres erróneamente conectados durante la etapa de segmentación. El método de reconocimiento de texto propuesto no es solo capaz de reconocer palabras, sino también números y signos de puntuación. El reconocimiento de palabras se lleva a cabo vii.
(8) viii. mediante un modelo de lenguaje basado en inferencia probabilı́stica y el British National Corpus, un completo dictionario del inglés británico moderno, si bien el algoritmo puede ser fácilmente adaptado para ser usado con cualquier otro diccionario. El modelo de lenguaje utiliza una modificación del algoritmo forward usando en Modelos Ocultos de Markov. Para comprobar el rendimiento del sistema propuesto, se han obtenido resultados experimentales con distintas bases de datos, las cuales incluyen imágenes en diferentes escenarios y situaciones. Estas bases de datos han sido usadas como banco de pruebas en la última década por la mayorı́a de investigadores en el área de reconocimiento de texto en imágenes naturales. Los resultados muestran que el sistema propuesto logra un rendimiento similar al del estado del arte en términos de localización, mientras que lo supera en términos de reconocimiento. Con objeto de mostrar la aplicabilidad del método propuesto en esta tesis, se presenta también un sistema de detección y reconocimiento de la información contenida en paneles de tráfico basado en el algoritmo desarrollado. El objetivo de esta aplicación es la creación automática de inventarios de paneles de tráfico de paı́ses o regiones que faciliten el mantenimiento de la señalización vertical de las carreteras, usando imágenes disponibles en el servicio Street View de Google. Se ha creado una base de datos para esta aplicación. Proponemos modelar los paneles de tráfico usando apariencia visual en lugar de las clásicas soluciones que utilizan bordes o caracterı́sticas geométricas, con objeto de detectar aquellas imágenes en las que existen paneles de tráfico. Los resultados experimentales muestran la viabilidad del sistema propuesto..
(9) Abstract Reading text in real-world scene images has focused the attention of many researchers all over the world during the last few years. The reason is the increasingly availability of cheap image-capturing devices in low-cost products such as smartphones and Tablet PCs. For this reason, this thesis presents a robust method to detect, locate and recognize horizontally-aligned text in natural images taken in real-world scenarios at daytime. This is a complex challenge due to the huge variability of text appearance and the capturing conditions in real scenarios. Initially a review of the main works of the last years in the field of text reading in real-world scene images is presented. Then, we carry out a study of the most suitable features to describe text versus non-text components. A computer vision system for reading text in images typically is composed of two main stages. Firstly, a text location method is applied in order to detect if text is present in the image and to locate it with the highest precision possible and minimizing the amount of undetected text as well as the number of false positives. Secondly, a text recognition algorithm is applied in order recognize the extracted text. The text location method here proposed is based on a connected-component analysis applied after a segmentation process, which combines a global method like MSER with a locally adaptive thresholding algorithm that improves the existing approaches by segmenting text even when blur motion is present in the images or if their resolution is too small. The connected component analysis process is optimized using genetic algorithms. Unlike other methods, we also propose a recursive method to restore character connected components initially erroneously discarded. This allows to improve the accuracy of the detection. Although the proposed system is based on connected component analysis, some ideas used on texture-based methods are also used in our approach. On the other hand, our approach to recognize text is based on identifying single characters and then applying a language model to correct misspelled words, constraining the output to a dictionary of all the possible terms. A new feature based on gradient direction histogramming, which we name as Direction Histogram (DH), is proposed to characterize single letters. This new feature is compared to other state-of-the-art features and the experimental results obtained on a challenging dataset show that the proposed feature is more than adequate as it outperforms the results achieved in the state of the art. We present a fuzzy classification method based on KNN, which is useful to separate characters that can be wrongly connected during the segmentation process. The recognition method here proposed is able to recognize not only words, but also numbers and punctuation marks. The word recognition is carried out using a language model based on probabilistic inference on the British National Corpus, a dictionary of modern British English, although the algorithm can be easily adapted to be used with any other dictionary. The language model uses a modification of the forward algorithm used in Hidden Markov Models (HMMs). To check the performance of the proposed system, experimental results have been ix.
(10) x. obtained with several datasets that include images in different scenarios and situations. These datasets have been used as a benchmark for most of the researchers in the area of text reading in natural images during the last decade. The results show that the proposed system achieves state-of-the-art performance in terms of text location, while it overpass the state-of-the-art results in text recognition. In order to show the applicability of the method proposed in this thesis, a system to detect and recognize traffic panels based on the developed text reading method is presented in this thesis. The aim of this application is to automatically create inventories of traffic panels of regions or countries that facilitate traffic signposting maintenance using images downloaded from Google Street View service. A dataset has been created for this purpose. We propose to model traffic panels using visual appearance instead of the classic approaches that use edge detection or geometrical characteristics, in order to detect the images where traffic panels are present. The experimental results show the viability of the proposed system..
(11) Contents Contents. 1. List of Figures. 3. List of Tables. 7. List of Algorithms. 9. 1 Introduction 11 1.1 Document structure . . . . . . . . . . . . . . . . . . . . . . . . . . . . . . . 13 2 State of the Art 2.1 Text detection . . . . . . . . . . . . 2.1.1 Connected component-based 2.1.2 Edge-based methods . . . . 2.1.3 Texture-based methods . . . 2.2 Text recognition . . . . . . . . . . . 2.3 Discussion . . . . . . . . . . . . . . 2.4 Aim of this thesis . . . . . . . . . .. . . . . . methods . . . . . . . . . . . . . . . . . . . . . . . . .. 3 Text Detection in Natural Images 3.1 Text features analysis . . . . . . . . . . 3.2 Text location . . . . . . . . . . . . . . 3.2.1 Candidates extraction . . . . . 3.2.2 Connected component analysis . 3.2.3 Text line aggregation . . . . . . 3.2.4 Text line classification . . . . . 3.2.5 Word separation . . . . . . . . 3.3 Experimental results . . . . . . . . . . 3.3.1 Partial experiments . . . . . . . 3.3.2 ICDAR 2003/2005 dataset . . . 3.3.3 ICDAR 2011 dataset . . . . . . 3.3.4 CoverDB dataset . . . . . . . . 3.4 Conclusions and future works . . . . .. . . . . . . . . . . . . .. . . . . . . . . . . . . .. . . . . . . . . . . . . .. . . . . . . . . . . . . . . . . . . . .. . . . . . . . . . . . . . . . . . . . .. . . . . . . . . . . . . . . . . . . . .. . . . . . . . . . . . . . . . . . . . .. . . . . . . . . . . . . . . . . . . . .. . . . . . . . . . . . . . . . . . . . .. . . . . . . . . . . . . . . . . . . . .. . . . . . . . . . . . . . . . . . . . .. . . . . . . . . . . . . . . . . . . . .. . . . . . . . . . . . . . . . . . . . .. . . . . . . . . . . . . . . . . . . . .. . . . . . . . . . . . . . . . . . . . .. . . . . . . . . . . . . . . . . . . . .. . . . . . . . . . . . . . . . . . . . .. . . . . . . . . . . . . . . . . . . . .. . . . . . . . . . . . . . . . . . . . .. . . . . . . .. 15 16 16 19 20 21 24 27. . . . . . . . . . . . . .. 29 30 40 40 42 47 49 51 51 51 56 62 74 74. 4 Text Recognition in Natural Images 77 4.1 Character recognition . . . . . . . . . . . . . . . . . . . . . . . . . . . . . . 78 4.1.1 Proposed approach . . . . . . . . . . . . . . . . . . . . . . . . . . . 78 4.1.2 Experimental results . . . . . . . . . . . . . . . . . . . . . . . . . . 83 1.
(12) 2. CONTENTS. 4.2. 4.3. 4.1.3 Study on rotations . . . . . . . . . . . . . . 4.1.4 Character separation . . . . . . . . . . . . . Word recognition . . . . . . . . . . . . . . . . . . . 4.2.1 Proposed approach . . . . . . . . . . . . . . 4.2.2 Numbers and punctuation marks recognition 4.2.3 Experimental results . . . . . . . . . . . . . Conclusions and future works . . . . . . . . . . . .. . . . . . . .. . . . . . . .. . . . . . . .. 5 Text Detection and Recognition on Traffic Panels from agery 5.1 Related work . . . . . . . . . . . . . . . . . . . . . . . . 5.2 Image capture and dataset creation . . . . . . . . . . . . 5.3 Traffic panels detection using visual appearance . . . . . 5.4 Text detection and recognition in traffic panels . . . . . . 5.5 Text geolocalization . . . . . . . . . . . . . . . . . . . . . 5.6 Experimental results . . . . . . . . . . . . . . . . . . . . 5.6.1 Traffic panels detection . . . . . . . . . . . . . . . 5.6.2 Text detection and recognition . . . . . . . . . . . 5.7 Conclusions and future work . . . . . . . . . . . . . . . . 6 Conclusions and future 6.1 Conclusions . . . . . 6.2 Main contributions . 6.3 Future work . . . . .. . . . . . . .. . . . . . . .. . . . . . . .. . . . . . . .. . . . . . . .. . . . . . . .. . . . . . . .. . . . . . . .. . . . . . . .. . . . . . . .. 86 89 95 95 104 106 118. Street-level Im119 . . . . . . . . . . 122 . . . . . . . . . . 123 . . . . . . . . . . 128 . . . . . . . . . . 135 . . . . . . . . . . 139 . . . . . . . . . . 141 . . . . . . . . . . 141 . . . . . . . . . . 147 . . . . . . . . . . 169. work 171 . . . . . . . . . . . . . . . . . . . . . . . . . . . . . . 171 . . . . . . . . . . . . . . . . . . . . . . . . . . . . . . 172 . . . . . . . . . . . . . . . . . . . . . . . . . . . . . . 174. A Results for the CoverDB dataset. 177. B The forward algorithm. 191. C Conversion of coordinates 195 C.1 Converting Latitude and Longitude to UTM coordinates . . . . . . . . . . 198 C.2 Converting UTM coordinates to Latitude and Longitude . . . . . . . . . . 199 Bibliography. 201.
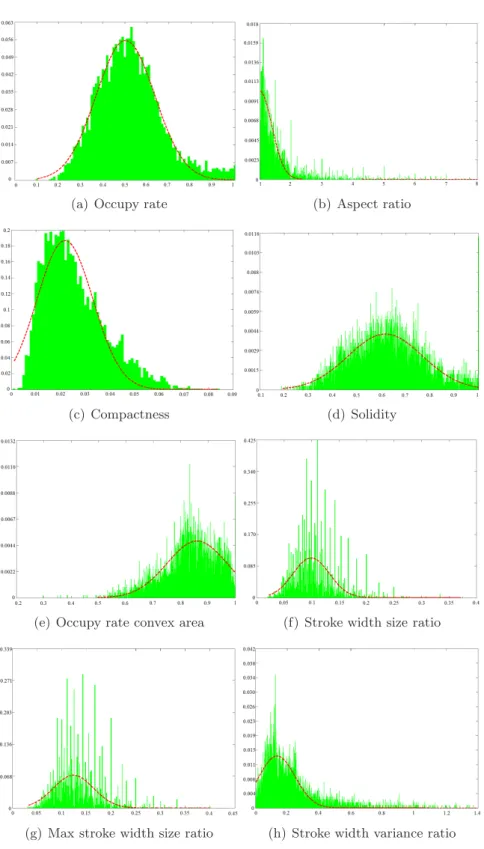
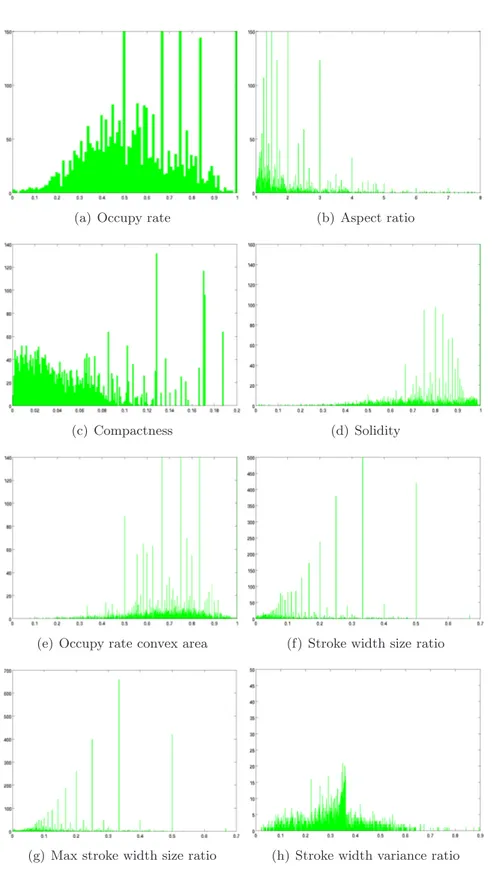
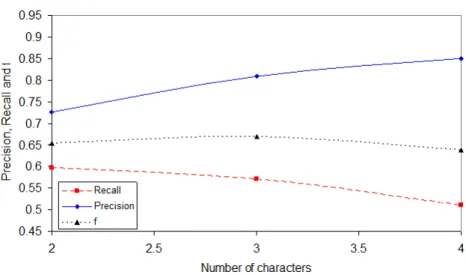
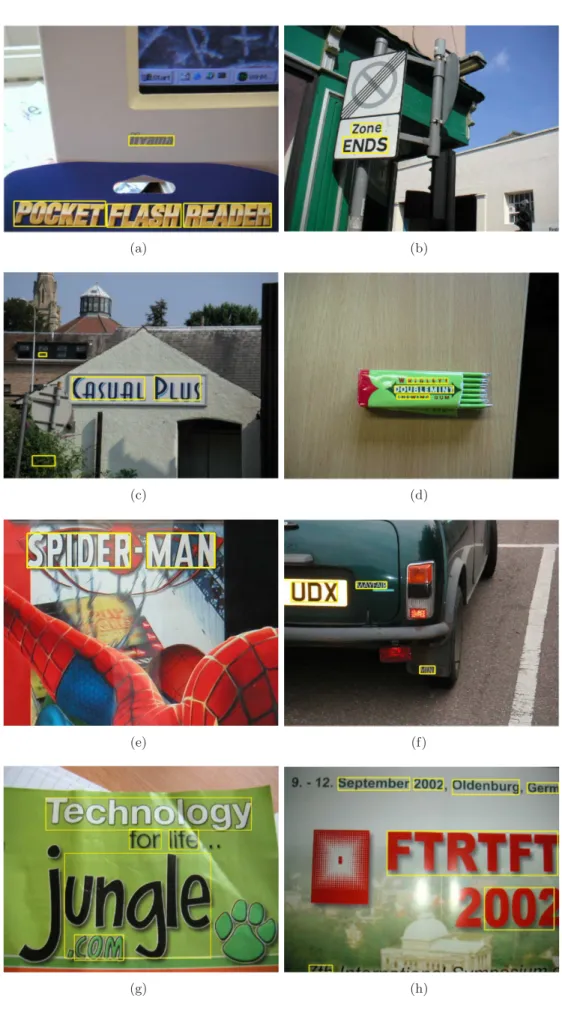
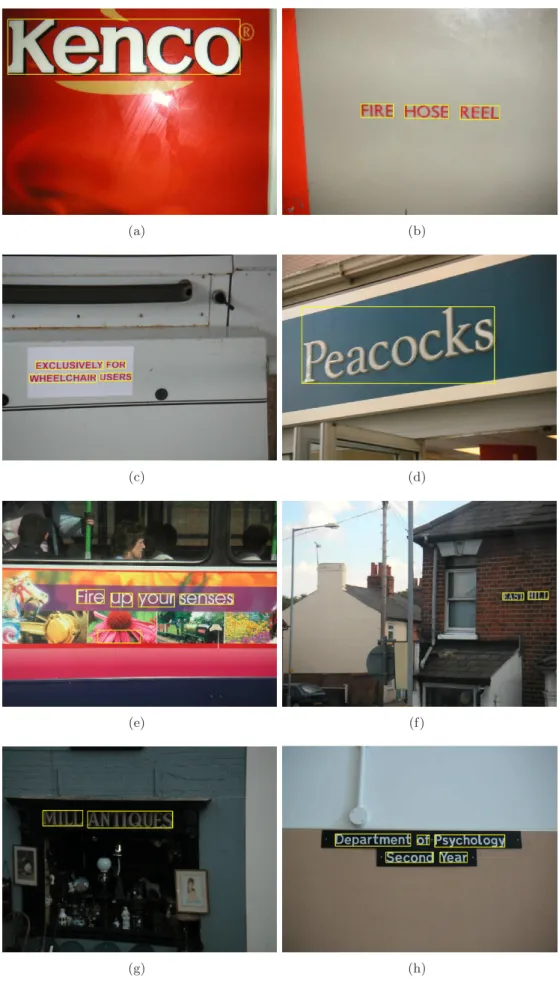
(13) List of Figures 1.1. Examples of different scenarios that would benefit from text reading applications. . . . . . . . . . . . . . . . . . . . . . . . . . . . . . . . . . . . . . 12. 2.1 2.2. Text detection and recognition with a public OCR . . . . . . . . . . . . . . 15 Classification of text detection methods . . . . . . . . . . . . . . . . . . . . 16. 3.1 3.2 3.3 3.4 3.5 3.6. Flowchart of the proposed framework . . . Two examples of the rough pixel templates Some positive training samples. . . . . . . Some negative training samples. . . . . . . Convex hull (red) . . . . . . . . . . . . . .. 3.7 3.8 3.9 3.10 3.11 3.12 3.13 3.14 3.15 3.16 3.17 3.18 3.19 3.20 3.21 3.22 3.23 3.24 3.25 3.26. . . . used . . . . . . . . .. . . . . . . by [Yao et . . . . . . . . . . . . . . . . . .. . . . . . . al., 2007]. . . . . . . . . . . . . . . . . . .. . . . . .. . . . . .. Normalized histograms of features vs approximated Gaussian functions for character components on ICDAR’03 training set. . . . . . . . . . . . . . . . . . . . . . .. . . . . .. . 35. Histograms of features for non-character components on ICDAR’03 training set. . . . . . . . . . . . . . . . . . . . . . . . . . . . . . . . . . . . . . . . . The flowchart of the text location algorithm . . . . . . . . . . . . . . . . . Image segmentation. . . . . . . . . . . . . . . . . . . . . . . . . . . . . . . Restoring conditions. . . . . . . . . . . . . . . . . . . . . . . . . . . . . . . Connected component analysis. . . . . . . . . . . . . . . . . . . . . . . . . Text line aggregation. . . . . . . . . . . . . . . . . . . . . . . . . . . . . . . MDF classifier. . . . . . . . . . . . . . . . . . . . . . . . . . . . . . . . . . Bernstein weight functions for F-HOG classifier. . . . . . . . . . . . . . . . Word separation. . . . . . . . . . . . . . . . . . . . . . . . . . . . . . . . . Effect of varying the MSER parameters. . . . . . . . . . . . . . . . . . . . Effect of varying the minimum number of characters per text line. . . . . . Effect of varying the ranges of the features (µ − k · σ, µ + k · σ). . . . . . . Text location results on some images from the ICDAR 2003/2005 dataset. Text location results on some images from the ICDAR 2003/2005 dataset. Text location results on some images from the ICDAR 2003/2005 dataset. Text location results on some images from the ICDAR 2003/2005 dataset. Text location results on some images from the ICDAR 2011 Challenge 1 dataset. . . . . . . . . . . . . . . . . . . . . . . . . . . . . . . . . . . . . . Text location results on some images from the ICDAR 2011 Challenge 1 dataset. . . . . . . . . . . . . . . . . . . . . . . . . . . . . . . . . . . . . . Text location results on some images from the ICDAR 2011 Challenge 1 dataset. . . . . . . . . . . . . . . . . . . . . . . . . . . . . . . . . . . . . . Text location results on some images from the ICDAR 2011 Challenge 1 dataset. . . . . . . . . . . . . . . . . . . . . . . . . . . . . . . . . . . . . . 3. 30 31 32 33 34. 36 41 43 44 46 46 49 50 51 54 55 55 58 59 60 61 65 66 67 68.
(14) 4. LIST OF FIGURES. 3.27 Text location results on some images dataset. . . . . . . . . . . . . . . . . 3.28 Text location results on some images dataset. . . . . . . . . . . . . . . . . 3.29 Text location results on some images dataset. . . . . . . . . . . . . . . . . 3.30 Text location results on some images dataset. . . . . . . . . . . . . . . . . 3.31 Text location results on some images dataset. . . . . . . . . . . . . . . . . 4.1 4.2 4.3 4.4 4.5 4.6 4.7 4.8 4.9 4.10 4.11 4.12 4.13 4.14 4.15 4.16 4.17 4.18 4.19 4.20 4.21 4.22 4.23 4.24 4.25 4.26 4.27 4.28 4.29 4.30 4.31 4.32 4.33 4.34. from . . . from . . . from . . . from . . . from . . .. the ICDAR . . . . . . . the ICDAR . . . . . . . the ICDAR . . . . . . . the ICDAR . . . . . . . the ICDAR . . . . . . .. 2011 . . . 2011 . . . 2011 . . . 2011 . . . 2011 . . .. Challenge . . . . . . Challenge . . . . . . Challenge . . . . . . Challenge . . . . . . Challenge . . . . . .. 1 . . 2 . . 2 . . 2 . . 2 . .. 69 70 71 72 73. The flowchart of the text recognition algorithm . . . . . . . . . . . . . . . 77 Character recognition flowchart . . . . . . . . . . . . . . . . . . . . . . . . 78 Feature computation . . . . . . . . . . . . . . . . . . . . . . . . . . . . . . 80 Classification method . . . . . . . . . . . . . . . . . . . . . . . . . . . . . . 82 Recognition rate vs Training dataset size (1st cand.) . . . . . . . . . . . . . 84 Recognition rate vs Training dataset size (1st /2ndcand.) . . . . . . . . . . . 85 Recognition rate vs Training dataset size (1st /2nd/3rd cand.) . . . . . . . . . 85 Effect of rotations on character recognition . . . . . . . . . . . . . . . . . . 87 Effect of rotations on upper-case letter recognition . . . . . . . . . . . . . . 88 Effect of rotations on lower-case letter recognition . . . . . . . . . . . . . . 88 Effect of rotations on number recognition . . . . . . . . . . . . . . . . . . . 88 Segmented image. . . . . . . . . . . . . . . . . . . . . . . . . . . . . . . . . 89 Projection of the object pixels on the horizontal axis (continuous) . . . . . 92 Character separation. . . . . . . . . . . . . . . . . . . . . . . . . . . . . . . 93 Character separation. . . . . . . . . . . . . . . . . . . . . . . . . . . . . . . 94 Confusion matrix of the character recognizer . . . . . . . . . . . . . . . . . 97 Path with maximum associated probability for the observed sequence “lWORD” and the correct sequence “SWORD”. . . . . . . . . . . . . . . . . . . . . . 99 Path with maximum associated probability for the observed sequence “lWORD” and the correct sequence “SWORE”. . . . . . . . . . . . . . . . . . . . . . 99 Character splitting process. . . . . . . . . . . . . . . . . . . . . . . . . . . 100 Character merging process. . . . . . . . . . . . . . . . . . . . . . . . . . . . 101 Sequence candidates for each observed sequence and output of the word recognizer. . . . . . . . . . . . . . . . . . . . . . . . . . . . . . . . . . . . . 102 Sequence candidates for each observed sequence and output of the word recognizer. . . . . . . . . . . . . . . . . . . . . . . . . . . . . . . . . . . . . 103 Word recognition flowchart . . . . . . . . . . . . . . . . . . . . . . . . . . . 105 Punctuation marks. . . . . . . . . . . . . . . . . . . . . . . . . . . . . . . . 106 Histogram of normalized edit distances for ICDAR 2003 . . . . . . . . . . . 107 Histogram of normalized edit distances for ICDAR 2011 Challenge 2 . . . . 108 Word recognition on ICDAR 2003/ICDAR 2011 (Chall. 2). . . . . . . . . . 109 Word recognition on ICDAR 2003/ICDAR 2011 (Chall. 2). . . . . . . . . . 110 Word recognition on ICDAR 2003/ICDAR 2011 (Chall. 2). . . . . . . . . . 111 Word recognition on ICDAR 2003/ICDAR 2011 (Chall. 2). . . . . . . . . . 112 Word recognition on ICDAR 2003/ICDAR 2011 (Chall. 2). . . . . . . . . . 113 Histogram of normalized edit distances for ICDAR 2011 Challenge 1 . . . . 114 Word recognition on ICDAR 2011 Challenge 1. . . . . . . . . . . . . . . . 115 Word recognition on ICDAR 2011 Challenge 1. . . . . . . . . . . . . . . . 116.
(15) LIST OF FIGURES. 5. 4.35 Word recognition on ICDAR 2011 Challenge 1. 5.1 5.2 5.3 5.4 5.5 5.6 5.7 5.8. . . . . . . . . . . . . . . . 117. 5.9 5.10 5.11 5.12 5.13 5.14 5.15 5.16 5.17 5.18 5.19 5.20 5.21 5.22 5.23 5.24 5.25 5.26 5.27 5.28 5.29 5.30 5.31 5.32 5.33 5.34 5.35 5.36 5.37 5.38 5.39 5.40. Classification of the vertical signposting . . . . . . . . . . . . . . . . . . . . Road identification signs . . . . . . . . . . . . . . . . . . . . . . . . . . . . The flowchart of the proposed application . . . . . . . . . . . . . . . . . . http://cbk0.google.com/cbk?output=xml&ll=40.477007,-3.406987 . . Panoramic view . . . . . . . . . . . . . . . . . . . . . . . . . . . . . . . . . Different zoom levels for a panoramic view . . . . . . . . . . . . . . . . . . Region of interest in the panoramic view (red) . . . . . . . . . . . . . . . . Roads from which the images have been obtained: training set (red) and test set (blue) . . . . . . . . . . . . . . . . . . . . . . . . . . . . . . . . . . Traffic panels detection . . . . . . . . . . . . . . . . . . . . . . . . . . . . . Visual vocabulary construction and word assignment . . . . . . . . . . . . Regions of interest on the images . . . . . . . . . . . . . . . . . . . . . . . Blue color detection . . . . . . . . . . . . . . . . . . . . . . . . . . . . . . . White color detection . . . . . . . . . . . . . . . . . . . . . . . . . . . . . . Considered symbols . . . . . . . . . . . . . . . . . . . . . . . . . . . . . . . Area covered by Cartociudad . . . . . . . . . . . . . . . . . . . . . . . . . XML input file format to Cartociudad server . . . . . . . . . . . . . . . . . XML output file format from Cartociudad server . . . . . . . . . . . . . . Function to convert from height (pixels) to distance (meters) . . . . . . . . Geometry to estimate the position of the panel . . . . . . . . . . . . . . . . f-measure as a function of the size of the vocabulary . . . . . . . . . . . . . Sensitivity as a function of the size of the vocabulary . . . . . . . . . . . . Specificity as a function of the size of the vocabulary . . . . . . . . . . . . Image results . . . . . . . . . . . . . . . . . . . . . . . . . . . . . . . . . . Image results . . . . . . . . . . . . . . . . . . . . . . . . . . . . . . . . . . Image results . . . . . . . . . . . . . . . . . . . . . . . . . . . . . . . . . . Image results . . . . . . . . . . . . . . . . . . . . . . . . . . . . . . . . . . Image results . . . . . . . . . . . . . . . . . . . . . . . . . . . . . . . . . . Image results . . . . . . . . . . . . . . . . . . . . . . . . . . . . . . . . . . Image results . . . . . . . . . . . . . . . . . . . . . . . . . . . . . . . . . . Image results . . . . . . . . . . . . . . . . . . . . . . . . . . . . . . . . . . Image results . . . . . . . . . . . . . . . . . . . . . . . . . . . . . . . . . . Image results . . . . . . . . . . . . . . . . . . . . . . . . . . . . . . . . . . Image results . . . . . . . . . . . . . . . . . . . . . . . . . . . . . . . . . . Image results . . . . . . . . . . . . . . . . . . . . . . . . . . . . . . . . . . Image results . . . . . . . . . . . . . . . . . . . . . . . . . . . . . . . . . . Image results . . . . . . . . . . . . . . . . . . . . . . . . . . . . . . . . . . Image results . . . . . . . . . . . . . . . . . . . . . . . . . . . . . . . . . . Image results . . . . . . . . . . . . . . . . . . . . . . . . . . . . . . . . . . Image results . . . . . . . . . . . . . . . . . . . . . . . . . . . . . . . . . . Image results . . . . . . . . . . . . . . . . . . . . . . . . . . . . . . . . . .. 127 128 129 131 133 134 135 136 137 138 139 140 145 145 146 151 152 153 154 155 156 157 158 159 160 161 162 163 164 165 166 167 168. A.1 A.2 A.3 A.4 A.5. Text Text Text Text Text. 178 179 180 181 182. detection detection detection detection detection. results results results results results. on on on on on. some some some some some. images images images images images. from from from from from. the the the the the. CoverDB CoverDB CoverDB CoverDB CoverDB. dataset. dataset. dataset. dataset. dataset.. . . . . .. . . . . .. . . . . .. . . . . .. . . . . .. 120 121 122 123 124 125 126.
(16) 6. LIST OF FIGURES. A.6 Text A.7 Text A.8 Text A.9 Text A.10 Text A.11 Text A.12 Text. detection detection detection detection detection detection detection. results results results results results results results. on on on on on on on. some some some some some some some. images images images images images images images. from from from from from from from. the the the the the the the. CoverDB CoverDB CoverDB CoverDB CoverDB CoverDB CoverDB. dataset. dataset. dataset. dataset. dataset. dataset. dataset.. . . . . . . .. . . . . . . .. . . . . . . .. . . . . . . .. . . . . . . .. 183 184 185 186 187 188 189. C.1 Latitude and longitude of the Earth . . . . . . . . . . . . . . . . . . . . . . 196 C.2 UTM zones . . . . . . . . . . . . . . . . . . . . . . . . . . . . . . . . . . . 197 C.3 An UTM zone . . . . . . . . . . . . . . . . . . . . . . . . . . . . . . . . . . 197.
(17) List of Tables 2.1 2.2. A comparison of text detection methods . . . . . . . . . . . . . . . . . . . 22 A comparison of single character recognition methods . . . . . . . . . . . . 25. 3.1 3.2 3.3 3.4 3.5 3.6 3.7 3.8. Features used by [Yao et al., 2007]. . . . . . . . . . . . . . . . . . . . . . . Features used by [Epshtein et al., 2010]. . . . . . . . . . . . . . . . . . . . Features used by [Chen et al., 2011]. . . . . . . . . . . . . . . . . . . . . . Features used by [Neumann and Matas, 2010]. . . . . . . . . . . . . . . . . Features proposed in this thesis. . . . . . . . . . . . . . . . . . . . . . . . . Mean and standard deviation of each feature. . . . . . . . . . . . . . . . . Lower and upper thresholds for each feature. . . . . . . . . . . . . . . . . . Relative deviation of the mean and standard deviation of each feature per class respect to the values for all the classes. . . . . . . . . . . . . . . . . . Weighted mean of the relative deviations of the mean and standard deviation of each feature for the uppercase letters, the lowercase letters, the digits and for all the classes, respect to the values that include all the classes. Optimum thresholds for restoring conditions. . . . . . . . . . . . . . . . . . Binary component features proposed by [Yao et al., 2007]. . . . . . . . . . Binary component features proposed by [Epshtein et al., 2010]. . . . . . . . Binary component features proposed by [Chen et al., 2011]. . . . . . . . . . Binary component features proposed by [Neumann and Matas, 2012]. . . . Binary component features proposed by [Pan et al., 2011]. . . . . . . . . . Binary component features proposed in this thesis. . . . . . . . . . . . . . Comparison of segmentation algorithms. . . . . . . . . . . . . . . . . . . . Effect of using the character restoration. . . . . . . . . . . . . . . . . . . . Comparison of text line classifiers. . . . . . . . . . . . . . . . . . . . . . . . Text location ICDAR’03 dataset. . . . . . . . . . . . . . . . . . . . . . . . Text location on ICDAR’11 Chall. 1 (%). . . . . . . . . . . . . . . . . . . . Text location on ICDAR’11 Chall. 2 (%). . . . . . . . . . . . . . . . . . . . Text location on CoverDB test set. . . . . . . . . . . . . . . . . . . . . . .. 30 31 32 32 33 34 37. Mean and standard deviation of each feature per letter. . . . . . Mean and standard deviation of each feature per letter. . . . . . Number of samples per letter in the training set. . . . . . . . . . Individual character recognition on ICDAR 2003 dataset. . . . . Individual character recognition on ICDAR 2003 dataset. . . . . Individual character recognition on ICDAR 2003 dataset, taking guishable pairs of letters as one class for each pair. . . . . . . . OCR confusion matrix. . . . . . . . . . . . . . . . . . . . . . . . Substitution matrix. . . . . . . . . . . . . . . . . . . . . . . . .. 79 79 81 84 86. 3.9. 3.10 3.11 3.12 3.13 3.14 3.15 3.16 3.17 3.18 3.19 3.20 3.21 3.22 3.23 4.1 4.2 4.3 4.4 4.5 4.6 4.7 4.8. 7. . . . . . . . . . . . . . . . . . . . . . . . . . . . . . . indistin. . . . . . . . . . . . . . . . . .. 39. 39 45 47 47 47 47 47 48 53 53 56 57 64 64 74. 87 98 98.
(18) 8. LIST OF TABLES. 4.9 4.10 4.11 4.12 4.13 4.14. Word recognition on ICDAR’03 . . . . . . . . . . . . . . . . . . . . Effect of language model on word recognition (ICDAR’03) . . . . . Word recognition on ICDAR’11 Chall. 2. . . . . . . . . . . . . . . . Effect of language model on word recognition (ICDAR’11 Chall. 2.) Word recognition on ICDAR’11 Chall. 1. . . . . . . . . . . . . . . . Effect of language model on word recognition (ICDAR’11 Chall. 1.). . . . . . .. . . . . . .. . . . . . .. . . . . . .. 107 107 108 108 114 114. 5.1 5.2 5.3 5.4 5.5 5.6 5.7 5.8 5.9 5.10 5.11 5.12 5.13 5.14 5.15 5.16 5.17 5.18. Number of panels and images in the dataset. . . . . . . . . Detection for blue lateral panels . . . . . . . . . . . . . . . Detection for blue upper panels . . . . . . . . . . . . . . . Detection for white lateral panels . . . . . . . . . . . . . . Detection for white upper panels . . . . . . . . . . . . . . Detection including all the lateral panels . . . . . . . . . . Detection including all the upper panels . . . . . . . . . . Effect of classifier for blue lateral panels . . . . . . . . . . Effect of classifier for blue upper panels . . . . . . . . . . . Effect of classifier for white lateral panels . . . . . . . . . . Effect of classifier for white upper panels . . . . . . . . . . Text detection and recognition for blue lateral panels. . . . Text detection and recognition for blue upper panels. . . . Text detection and recognition for white lateral panels. . . Text detection and recognition for white upper panels. . . Text detection and recognition including all lateral panels. Text detection and recognition including all upper panels. . Text detection and recognition including all the panels. . .. . . . . . . . . . . . . . . . . . .. . . . . . . . . . . . . . . . . . .. . . . . . . . . . . . . . . . . . .. . . . . . . . . . . . . . . . . . .. 128 143 143 143 143 143 144 146 146 146 147 148 148 148 149 149 149 150. . . . . . . . . . . . . . . . . . .. . . . . . . . . . . . . . . . . . .. . . . . . . . . . . . . . . . . . .. . . . . . . . . . . . . . . . . . .. . . . . . . . . . . . . . . . . . ..
(19) List of Algorithms 4.1 5.1. Character separation . . . . . . . . . . . . . . . . . . . . . . . . . . . . . . 91 Image capture . . . . . . . . . . . . . . . . . . . . . . . . . . . . . . . . . . 126. 9.
(20)
(21) Chapter 1. Introduction Automatic text recognition has traditionally focused on analyzing scanned documents. Since Emanuel Goldberg presented in 1914 a machine that read characters and converted them into standard telegraph code, many technologies have been developed to convert images of scanned documents into machine-encoded text, so that they can be electronically stored and used in machine translation and text-to-speech processes. Many free and licensed systems that achieve a high performance have been created and commercialized. However, recognition of Latin-script, typewritten text in scanned documents is still not 100% accurate even where clear imaging is available. One study based on recognition of 19th- and early 20th-century newspaper pages concluded that accuracy of commercial software varied from 71% to 98% [Holley, 2009]. Total accuracy can be achieved only with human review. Other areas, including recognition of hand printing, cursive handwritting and printed text in other scripts (especially those East Asian language characters which have many strokes for a single character), are still the subject of active research. However, commercial systems are not reliable for camera-captured real-world scenes and automatic text recognition in real-world images still remains one of the most challenging problems in computer vision due to complex backgrounds, uncontrolled lighting conditions and wide variety of text appearance. During the last years digital cameras have started to be embedded in low-cost consumer products such as smartphones and Tablet PCs, so that user applications related to digital image processing have become very popular, and the range of applications of automatic text reading systems has expanded, from support to robotic navigation in indoor and outdoor scenarios, image spam filtering, driver assistance or translation services for tourists, among others, since textual information can be found on any environment, both indoors and outdoors. For instance, figure 1.1 depicts different topics where text reading systems can have a tremendous applicability. Some recent applications in robotics and ICT (Information and Telecommunication Technologies) are: • A system embedded in a PDA or smartphone to help visually handicapped people [Mancas-Thillou et al., 2007]. • A head-mounted device to aid visually impaired persons [Merino et al., 2011]. • Indoor [Liu and Samarabandu, 2005] and outdoor [Posner et al., 2010] mobile robot navigation. • A translator robot [Shi and Xu, 2005]. • A PDA-based sign translator [Zhang et al., 2002]. 11.
(22) 12. Introduction. • An automatic comic reader on mobile phones [Yamada et al., 2004]. • A translator of signboard images from English to Spanish [Rodrı́guez et al., 2009]. • A word translator from English to Spanish and vice versa [Press release, 2010]. • A street sign recognizer for geolocalization [Parizi et al., 2009].. (a) Smartphone. (b) Humanoid robot (c) A visually impaired user. (d) Intelligent vehicle. Figure 1.1: Examples of different scenarios that would benefit from text reading applications.. The applications of text recognition to Intelligent Transportation Systems (ITS) can be also multiple. Automatic text recognition could be useful to support drivers or autonomous vehicles to find a certain place by simply reading and interpreting street signs, road panels, variable-message signs or any kind of text present in the scenario, when Global Positioning Systems (GPS) suffer from lack of coverage, especially in highdensity urban areas. Advanced Driver Assistance Systems (ADAS) could also benefit from text recognition for automatic traffic signs and panels identification. In addition, textual information could be also fused with other data obtained from image or RADAR in order to make more robust systems. Up to now, most of works on text reading in natural images have focused on concrete subsets of the problem, such as extracting text in CD cover images [Escalera et al., 2009] or segmenting text in web images [Karatzas and Antonacopoulos, 2007]. This is due to the wide variety of text appearance because of different fonts, thicknesses, colors, sizes, textures, lighting conditions, image resolutions, languages, etc., together with the presence of geometrical distortions, partial occlusions and different shooting angles that can cause deformed text..
(23) 1.1. Document structure. 13. The aim of this thesis is to develop a computer vision method able to read text in any kind of scenario, both indoors and outdoors, and in any kind of image, both natural and born-digital images, with the highest precision possible and minimizing the amount of undetected text as well as the number of false text extracted. We simply constrain to machine-printed horizontally-aligned text and English language. To check the performance of the proposed system, we propose to obtain experimental results from several datasets that include images in different scenarios and situations. These datasets have been used as a benchmark for most of the researchers in the area of text reading in natural images during the last decade. The first dataset was released for the Robust Reading Competition held in the frame of the 7th International Conference on Document Analysis and Recognition (ICDAR) in 2003. The competition was divided into three subproblems: text location, character recognition and word recognition. In this thesis, we will show our results for the three problems. The first one received five entries, while there was no participants in the character recognition and word recognition problems. The same competition was carried out two years later in the following conference, using the same dataset. Again, the participants only took part in the text locating problem. In order to check the improvements achieved in the area of text detection and recognition since 2005, a new competition was celebrated in the ICDAR 2011 edition. The competition was divided into two contests. The first one was aimed at detecting and reading text in born-digital images (web, email), while the second one was very similar to the competitions held in 2003 and 2005, as it was aimed at reading text in real-world images, so the same dataset was released at this time with slight modifications. The first challenge was organized over three tasks: text location, text segmentation and word recognition. On the other hand, the second challenge consisted of two tasks: text location and word recognition. In both contests, most of the entries were done for the text location task, while there was hardly any participant in the word recognition problem. In this thesis, we will show our results for all the tasks. In order to show that the method proposed in this thesis is applicable and can be generalized to any kind of situations, results are also obtained using a dataset composed of CD and DVD covers. Moreover, a system to detect and recognize traffic panels based on our text reading proposal is also developed. This application fits one of the main investigation lines of the Robesafe Research Group 1 , as it is the research in ITS. The aim of this application is to automatically create inventories of traffic panels of regions or countries in order to facilitate traffic signposting maintenance and driver assistance.. 1.1. Document structure. This document is divided in several parts, of which the present introduction is the first one. Chapter 2 contains a brief review of the state of the art in text detection and recognition. That chapter aims to present a global summary of the approaches to text detection and recognition, without going into specific details. These are introduced as needed in the subsequent chapters, as related techniques and methods are described. Chapter 3 presents the text localization method developed and tests its performance on different public datasets in order to get a reliable comparison with other methods of the state of the art. Similarly, chapter 4 explains the text recognition method implemented 1. http://www.robesafe.com/.
(24) 14. Introduction. in this work, making a comparison with other methods and showing the results obtained with different publicly available datasets. Chapter 5 describes a real application of the proposed text reading method to detect and recognize the information contained in traffic panels. The dataset created for this purpose using images from Google Street View is described in this chapter and detailed experimental results obtained with this dataset are shown. Finally, chapter 6 contains the conclusions and main contributions of this work, and future research lines that may spring from it. The document is closed with the bibliography as well as with three appendices that show, on the one hand, the results obtained with one of the benchmarked datasets, and on the other hand, the explanation of the forward algorithm and the description of the UTM from/to Latitude and Longitude conversion equations..
(25) Chapter 2. State of the Art Automatic text location and recognition in images has been one of the main challenges in computer vision ever. Most of the work in this field is based on optical character recognition (OCR), which consists of converting images of handwritten or printed text in scanned documents into machine-encoded text, so that they can be electronically shared, stored and displayed, as well as used in machine processes such as machine translation, text-to-speech and text mining. Many OCR systems have been developed and patented and achieve a very good performance when reading text of scanned images of documents. There are many free and licensed systems, such as Tesseract [Google, 2010] and ABBYY FineReader [ABBYY, 2009]. However, they do not work so well for camera-captured scenes, where the text is typically embedded in complex environments and text varies in size, style, color and layout. An example is shown in figure 2.1, where a public OCR, specifically Tesseract, has been applied over a natural image captured from Google Street View service and the results are unexpected.. (a) Input image. (b) OCR (Tesseract). Figure 2.1: Text detection and recognition with a public OCR. In order to benchmark the state of the art in terms of text reading in natural images, a competition was held in the frame of the 7th International Conference on Document Analysis and Recognition (ICDAR) in 2003. Since then, many research groups have focused their attention in this field, using the datasets released for this competition and the subsequent ones as benchmark, and a huge improvement has been achieved in the last decade. This chapter presents a brief survey of the state of the art in text detection and text recognition in natural images, both in terms of single character recognition and word 15.
(26) 16. State of the Art. recognition. This chapter does not intend to make an exhaustive review, as it would result in a lengthy chapter, both in time and space. The aim of what follows is to provide an overview of the most remarkable methods in each field of the last years, and those that are related to the contents of the following chapters of this thesis. This chapter closes with a discussion on the most adequate methods to be studied with their advantages and drawbacks, and the specific aims of this thesis.. 2.1. Text detection. Text detection deals with the problem of finding if text appears in an image, and locating it if any is present. Almost every system that recognizes text in natural images has text detection as its first step. Firstly, a general classification of text localization methods can be made into two main categories, as shown in figure 2.2: those methods based on a single frame and those based on multiple frames. The algorithms based on a single frame use implementations based either on connected component (CC) analysis [Yao et al., 2007; Neumann and Matas, 2012; Epshtein et al., 2010; Pan et al., 2011; Chen et al., 2011; Yi and Tian, 2011], on edge analysis [Liu et al., 2005; Shivakumara et al., 2008; Liu and Sarkar, 2008; Zhang and Kasturi, 2010], or on texture analysis [Chen and Yuille, 2004; Ye et al., 2007; Wang et al., 2009; Hanif and Prevost, 2009; Tu et al., 2006; Minetto et al., 2010; Pan et al., 2011]. On the other hand, the algorithms based on multiple frames can be split into multi-frame averaging methods [Hua et al., 2002; Wang et al., 2004], and time-based minimum pixel search methods [Sato et al., 1999]. Since the method proposed in this thesis is aimed at locating text on single images, the focus of this chapter are methods based on a single frame.. Figure 2.2: Classification of text detection methods. 2.1.1. Connected component-based methods. The CC-based approaches segment a frame into multiple small CCs, apply different geometric constraints to discard non-text candidates and join the text candidates into.
(27) 2.1. Text detection. 17. several larger text regions by analizing their geometrical arrangement on the image and their common features. These methods usually consist of three stages: 1. CC extraction from segmented image. 2. CC analysis to filter out non-text components using heuristic rules or classifiers. 3. Post-processing to group text components into text blocks. Image segmentation is a key step in order to achieve an accurate text detection. Typically, two approaches are used: local and global segmentation methods. The first one generates too many false positives, while the main drawback of the second approach is that it is not suitable to segment images whose illumination of the scenario is not homogeneous. [Yao et al., 2007] use locally adaptive thresholding to segment an image. Then, certain geometric features are extracted from CCs and used to discard most noncharacter CCs by a cascade of threshold classifiers. Non-discarded CCs are fed into a SVM in order to be classified into characters or non-characters. Finally, the character CCs verified by the classifier are merged into candidate text regions according to certain neighboring properties such as proximity, stroke width and height. On the other hand,[Neumann and Matas, 2012] assume characters to be Maximally Stable Extremal Regions (MSERs) [Matas et al., 2002] in certain scalar image projections (intensity, red channel, blue channel, green channel). The resulting CCs of the MSER detection stage are classified into character and non-character based on certain basic features such as aspect ratio, compactness or color consistency. Then, text line candidates are formed based on geometric character attributes. Later, character recognition is applied together with a typographic model to correct inconsistencies. [Merino and Mirmehdi, 2007] use an adaptive thresholding to initially binarize the image and to obtain CCs. However, in a later work ([Merino et al., 2011]), the same authors propose to use MSER for image segmentation. In both works, after the segmentation process, a tree is constructed representing the topological relationship between CCs in the binary image. The outermost region of the image is the root of the tree, while the innermost regions of the image are the leaves of the tree. Then, a hierarchical filtering of the tree nodes is carried out. This allows to reject many candidate regions without classification, because when a node has children already classified as text, it can be discarded as non-text. After that, the remaining tree nodes are filtered using a cascade of text classifiers related to size, aspect ratio, complexity, border energy and texture. Finally, CCs are grouped into text regions or lines taking into account the relative position and size of adjacent regions. [Epshtein et al., 2010] propose the Stroke Width Transform (SWT), a local image operator which computes per pixel the width of the most likely stroke containing the pixel. A stroke is a contiguous part of an image that forms a band of a nearly constant width. The idea under the SWT is to look for matched pairs of pixels in a small region with corresponding opposing gradients. Pixels with similar stroke width are merged into CCs and letter candidates are found from certain geometric basic rules concerning aspect ratio, number of holes or variance of the stroke width. Then, letters are grouped into text lines if they have similar features such as stroke width, height or average color. [Chen et al., 2011] follow the same idea of Ephstein’s work. However, they only apply the SWT on the CCs resulting after a MSER detection stage. In addition, they propose an alternative way of computing the SWT from a binary image. The way of computing the SWT proposed by [Epshtein et al., 2010] relies on calculating the gradients along the edges.
(28) 18. State of the Art. of each CC. However, when the text is badly contrasted, the gradient may not be well determined and the calculation of the stroke width may fail. This problem is overcome by the proposal of [Chen et al., 2011], which calculates the distance that separate each pixel in the considered CC from the background using the distance transform, and then spread the maximum distances along the stroke width. They consider that the real width of the stroke is twice the resulted transform. [Pan et al., 2011] propose an hybrid approach. Firstly, a text region detector is applied to estimate probabilities of the text position and scale information. This detector is based on Histogram of Oriented Gradients (HOG) [Dalal and Triggs, 2005] and a WaldBoost cascade classifier [Sochman and Matas, 2005], on image pyramids. The information extracted from each scale is merged into a single text confidence map and text scale map. Secondly, the gray-level image is segmented using the Niblack’s local binarization algorithm [Niblack, 1986] and a CC analysis is carried out with a conditional random field (CRF) model [Lafferty et al., 2001] to assign candidate components as text and non-text by considering both unary component properties, such as width, height, aspect ratio and compactness, and binary contextual component relationships, such as spatial distance, overlap ratio and gray-level difference. Several works, which have taken part recently in the robust reading competition held in the ICDAR 2011 conference, are presented in [Karatzas et al., 2011]. The one known as TH-TextLoc extracts CCs using an adaptive binarization method and candidates are classified into text or non-text using SVM and geometric, shape and stroke features. Then, text candidates are grouped into text regions analysing projection histograms. On the other hand, the TDM IACAS system computes the And-Ridge and And-Valley images proposed by [Shao et al., 2010] and resulting CCs are classified as character and noncharacter using a set of binary SVM classifiers using gradient features. Then, characters are grouped together using certain neighboring constraints. OTCYMIST binarises each channel R, G and B separately and extracts CCs in each binary image and its complement one. Resulting CCs are filtered using certain geometric characteristics. The system known as SASA is an hybrid approach, as it is explained in [Yi and Tian, 2011]. It extracts CCs from the magnitude gradient difference of the input image and does adjacent character grouping taking into account similar height and horizontal alignment between sibling components. Then, Haar features are extracted from gradient maps and stroke orientation maps by the block patterns presented in [Chen and Yuille, 2004]. These features are the input of an AdaBoost-based text classifier, which determines if the candidate patches are text regions or not. Finally, several works have been recently presented in the 21st International Conference on Pattern Recognition (ICPR) in November 2012. [Fehli et al., 2012] uses MSER to extract text candidates. Then, a graph that connects similar and neighboring CCs is constructed. Geometry and color difference are used for constructing the graph. A text descriptor based on the stroke width variance is applied on each node of the graph in order to eliminate nodes that have very low probability to be text. [Chowdhury et al., 2012] obtain CCs after edge-linking on the Canny edgemap, and geometric, graylevel and color-based features are used to filter non-text regions using a multi-layer perceptron (MLP) classifier. [Li and Lu, 2012] also use a contrast-enhanced MSER algorithm to extract CCs, and simple geometric constraints, including stroke width, are applied to remove false positives. Another work that uses MSER to extract letter candidates is proposed by [Yin et al., 2012]. After elimination of non-letter candidates using geometric information, candidate regions are constructed by grouping similar CCs. Candidate region.
(29) 2.1. Text detection. 19. features based on horizontal and vertical variances, stroke width, color and geometry are extracted. An AdaBoost classifier is built from these features and text regions are identified. [Liu et al., 2012] utilize a multi-scale adaptive local thresholding operator to binarize the original image. CCs are then extracted and filtered using geometric features, and the obtained candidate components are checked on the word level by using a graph to represent spatial relation of different components. Scene text regions are localized by searching the collinear maximum group over the graph. [Zhang and Lai, 2012] use a Laplacian of Gaussian filter to smooth noise and CCs are extracted after applying the Otsu’s binarization method [Otsu, 1979] and morphological closing to merge adjacent characters into whole regions. Then, the minimum moment of inertia of each candidate text region is computed, and the orientation and minimum bounding box of each CC are obtained. Based on the fact that corners are frequent and essential patterns in text regions, the work proposes a geodesic distance between corners and the skeleton of text regions to measure the effective distance between corners and text. Finally, a geodesic distance weighted corner saturation parameter is given to determine which candidate regions are the true text regions. 2.1.2. Edge-based methods. The edge-based methods separate between text and background detecting the borders between these regions as edges follow certain homogeneous patterns. Typically, the edges are detected by an edge filter and then merged by morphological operators. However, it is difficult to draw a distinction between edge-based methods and CC-based algorithms, as typically additional information like color or geometry is necessary to validate or discard the extracted regions in edge-based approaches. [Liu et al., 2005] firstly apply edge detection to get four edge maps in horizontal, vertical, up-right and up-left direction. Secondly, the feature is extracted from these four edge maps to represent the texture property of text. Then k-means algorithm is applied to detect the initial text candidates. Finally, the text areas are identified by some heuristic rules and refined through project profile analysis. [Shivakumara et al., 2008] explore new edge features such as straightness for removing non-significant edges. It identifies text block candidates by combining Arithmetic Mean Filter, Median Filter and edge analysis. [Liu and Sarkar, 2008] use an intensity histogram-based filter and an inner distancebased shape filter to extract text blocks and remove false positives whose intensity histograms are similar to those of their adjoining areas and the components coming from the same object. [Bai et al., 2008] use a multi-scale Harris-corner-based method to extract candidate text blocks. The position similarity and color similarity of Harris corners are used to generate boundaries of text objects. [Zhang and Kasturi, 2010] propose a method based on edge gradients and Graph Spectrum. It firstly extracts text edges from an image and localizes candidate character blocks using HOG. Then, Graph Spectrum is used to capture global relationship among candidate blocks and to cluster candidate blocks into groups to generate bounding boxes of text objects in the image. An edge-based work has taken part in the ICDAR 2011 robust reading competition [Karatzas et al., 2011]. The name of the system is Textorter. It extracts edges from a greyscale image and morphological operators are applied on the image aiming at connecting any broken edges. A filtering stage removes noise components based on their aspect ratio and size. Remaining components are classified as text or non text on the basis of features such as size, aspect ratio and binary transitions. In the same.
(30) 20. State of the Art. competition, but in the other challenge [Shahab et al., 2011], the ECNU-CCG method computes an edge map by combining four inidividual edge maps with typical directions (horizontal, vertical, up-right and up-left) and potential text areas are extracted using CC analysis. Finally, an N-level scale space model is constructed and the spatial responses to the Laplacian-of-Gaussian operator are computed. The scale at which the strongest spatial responses are present, indicates the stroke width of the text characters. Therefore, it uses the distribution of the strongest response and the scale where they appearing to identify the candidate text regions. 2.1.3. Texture-based methods. Texture-based approaches typically extract distinctive texture features from regions on the image and these regions are identified as text or non-text by a classifier trained either with machine learning techniques or by heuristics. Generally, a texture-based approach consists of two stages: 1. Text detection to estimate text existing confidence in local image regions by classification. 2. Text localization to cluster local text regions into text blocks, and text verification to filter out non-text regions. Among texture-based methods, [Chen and Yuille, 2004] is one of the most significant works. It uses a set of informative features based on the intensity, gradient direction and intensity gradient. Weak classifiers, using joint probabilities for feature responses on and off text, are used as input to an AdaBoost cascade classifier. Regions selected by the classifier are clustered into groups according to their location and size. Then, an adaptive binarization algorithm is applied and CCs are extracted. Later, the CCs are grouped into lines followed by an extension algorithm to find missing boundary letters. [Ye et al., 2007] use a color quantization method to separate text from its background and applies a spatial layout analysis. Generalized Learning Vector Quantization (GLVQ) is used to group pixels of similar color into the same cluster in LUV color space. For text and non-text classification of the candidates, histogram features of wavelet coefficients and color variance are extracted to capture the texture properties of text and fed into a SVM classifier. [Wang et al., 2009] employ gray-scale contrast, edge orientation histogram and SVM to verify detected text objects. [Hanif and Prevost, 2009] use a small set of heterogeneous features (Mean Difference Feature (MDF), Standard Deviation (SD) and HOG) which are spatially combined to build a large set of features. A neural-network-based localizer learns the localization rules automatically. This system is known as Text Hunter. [Tu et al., 2006] calculate the average intensity and statistics of the number of edges from training samples. Then, AdaBoost is used to classify the candidate blocks. Text boundaries are matched with pre-generated deformable templates based on shape context and informative features. [Minetto et al., 2010] carry out an image segmentation based on a morphological operator called toggle mapping. It produces a set of regions. Those which contain text are discriminated from those that do not by taking into account three families of descriptors (Fourier moments, pseudo-zernike moments and a polar representation) that are fed into a hierarchical SVM classifier. Then an hypothesis validation scheme based on HOG descriptors is applied over each detected window in order to remove false positives. This.
(31) 2.2. Text recognition. 21. system has been presented to the ICDAR 2011 robust reading competition with the name of LIP6-Retin. A hybrid approach of texture-based and edge-based features is proposed in [Lee et al., 2010]. It generates text region candidates using two assumptions: homogeneity of text color and distinctiveness between text and background regions. A k-means algorithm is used to separate the image into regions of the same color and the regions are constrained using edges. Then, the candidates are verified using a Markov Random Field representation that models spatial relationships among regions as an undirected graphical model. Another hybrid approach of CC-based and texture-based features is presented in [Escalera et al., 2009]. This method is based on learning spatial information of gradient-based features and Census Transform images using a cascade of classifiers. Kim’s method, which has competed in the ICDAR 2011 robust reading competition [Shahab et al., 2011], extracts blobs in an image using MSER, and neighboring blobs are merged when their sizes and colors are similar. A cascade classifier is used to discriminate text from non-text regions using gradient features. In the same competition, the KAIST AIPR system introduces the concept of superpixel, which is a coherent local region that preserves most of the object boundaries, and the concept of segment, which is an enlarged region that has one or more neighboring superpixels together. This system assumes that text regions can be modeled as segments. [Phan et al., 2012] propose to use the Gradient Vector Flow (GVF) [Xu and Prince, 1998] to extract both intra-character and inter-character symmetries. Then, horizontally aligned symmetry components are grouped into text lines based on several constraints on size, position and color. Finally, a classifier based on SVM and HOG is used to remove false positives. Each one of the approaches explained (CC-based, edge-based and texture-based methods) has different advantages and drawbacks. For instance, CC-based and edge-based methods are able to detect text at any scale simultaneously and are not limited to horizontal alignment of the text, but they have problems when the text is in a complex background or in contact with other graphical objects. On the other hand, texture-based methods have difficulty to find accurate boundaries of text areas and need to scan the image at different scales thus leading to higher processing time than CC-based algorithms. An overview of the main characteristics of the above mentioned methods is shown in table 2.1.. 2.2. Text recognition. Text recognition aims at identifying the characters and words detected in an image. The performance of the recognition strongly depends on the accuracy of the detection. The clearer and the more precise the extraction of the bounding boxes of the text and the separation into words and single characters is, the more reliable the recognition is. Therefore, most of the work in the area of automatic text recognition is based on developing very accurate text localization methods and then applying commercial OCRs where text areas have been found in the image. However, due to the huge variability of font styles, thickness, colors, texture, resolution or illumination, among other factors, the number of scenarios where commercial OCRs work well is very limited. Some attempts to develop robust character recognition techniques for natural images have been carried out. Methods for offline recognition of handprinted characters [Plamondon and Srihari, 2000; Pal et al., 2007] successfully tackle the problem of intra-class variation due to.
(32) Approach. Features. Classifier. Evaluation. Table 2.1: A comparison of text detection methods. State of the Art. [Yao et al., 2007] CC Intensity, Geometry SVM ICDAR’03 CC ER, Geometry Heuristics ICDAR’03, ICDAR’11-2 [Neumann and Matas, 2012] [Merino et al., 2011] CC ER, Geometry, Intensity, Texture Cascade ICDAR’03 [Epshtein et al., 2010] CC Geometry, SWT Heuristics ICDAR’03 CC Geometry, MSER, Gradient, SWT Heuristics ICDAR’03 [Chen et al., 2011] [Pan et al., 2011] CC+T HOG, Geometry, Gray-level difference WaldBoost ICDAR’03 TH-TextLoc [Karatzas et al., 2011] CC Geometry, Shape, Stroke SVM ICDAR’11-1, ICDAR’11-2 TDM IACAS [Karatzas et al., 2011] CC Gradient, Geometry SVM ICDAR’11-1, ICDAR’11-2 CC Geometry Heuristics ICDAR’11-1 OCTYMIST [Karatzas et al., 2011] [Fehli et al., 2012] CC ER, Geometry, Color, SWT Heuristics, SVM ICDAR’03, ICDAR’11-2 [Chowdhury et al., 2012] CC Geometry, Intensity, Color, SWT MLP ICDAR’03 CC ER, Geometry, SWT Heuristics ICDAR’03, ICDAR’11-2 [Li and Lu, 2012] [Yin et al., 2012] CC ER, Geometry, SWT, Color, Gradient AdaBoost ICDAR’11-2 [Liu et al., 2012] CC Geometry Heuristics ICDAR’03 [Zhang and Lai, 2012] CC Geometry Heuristics ICDAR’03 CC+T Geometry, Gradient, Haar features AdaBoost ICDAR’11-1, ICDAR’11-2 SASA [Yi and Tian, 2011] [Liu et al., 2005] E Geometry, Edge direction Heuristics Own dataset [Shivakumara et al., 2008] E AF, MF, Edge strength Heuristics ICDAR’03 [Liu and Sarkar, 2008] E Gray-level, Shape Heuristics ICDAR’03 E Harris corners, Geometry, Color Heuristics Own dataset [Bai et al., 2008] [Zhang and Kasturi, 2010] E HOG, Geometry, Edge intensity Heuristics ICDAR’03 Textorter [Karatzas et al., 2011] E Geometry Heuristics ICDAR’11-1 ECNU-CCG [Shahab et al., 2011] E+CC LoG, Geometry Heuristics ICDAR’11-2 T Intensity, Gradient direction, Gradient intensity AdaBoost Own dataset [Chen and Yuille, 2004] [Ye et al., 2007] T Color, Geometry, Wavelet coefficients SVM Own dataset [Wang et al., 2009] T Contrast, Edge direction SVM Own dataset Text Hunter [Hanif and Prevost, 2009] T MDF, SD, HOG Neural Network ICDAR’03, ICDAR’11-1, ICDAR’11-2 T Intensity, Geometry AdaBoost Own dataset [Tu et al., 2006] LIP6-Retin [Minetto et al., 2010] T Fourier moments, Zernike moments, HOG SVM ICDAR’03, ICDAR’11-2 [Lee et al., 2010] E+T Color, Geometry MRF ICDAR’03 CC+T Gradient, Census Transform, Geometry Cascade CoverDB [Escalera et al., 2009] Kim’s method [Shahab et al., 2011] T Color, Geometry Cascade ICDAR’11-2 KAIST AIPR [Shahab et al., 2011] T Color, Geometry Heuristics ICDAR’11-2 [Phan et al., 2012] T Symmetry, Color, Geometry, Gradient direction SVM ICDAR’03 CC: Connected component-based method. E: Edge-based method. T: Texture-based method. MSER: Maximally Stable Extremal Regions. ER: Extremal Regions. SWT: Stroke Width Transform. MLP: Multi-layer Perceptron. AF: Arithmetic mean Filter. MF: Median Filter. HOG: Histogram of Oriented Gradients. MDF: Mean Difference Feature. SD: Standard Deviation. MRF: Markov Random Field. ICDAR’03: ICDAR 2003 Robust Reading Competition dataset. ICDAR’11-1: ICDAR 2011 Robust Reading Competition Challenge 1 dataset. ICDAR’11-2: ICDAR 2011 Robust Reading Competition Challenge 2 dataset.. 22. Method.
(33) 2.2. Text recognition. 23. different writing styles. However, these approaches typically consider only a limited number of appearance classes, not dealing with variations in color and texture, both in foreground and background. For natural scenes, some works integrate text detection and recognition in a single framework. The problem of this kind of works is that they are not able to detect characters in the image that are difficult to be segmented, such as small letters in low resolution images or characters written with fonts that emulate handwriting. For instance, [Tu et al., 2006] model text characters by 62 deformable templates corresponding to the 10 digits and the 26 letters in both upper and lower cases. Shape classification is carried out using nearest neighbor matching. [Jin and Geman, 2006] assume that letters are built with terminal bricks or blobs, which are semantic variables, like edges, strokes, junctions and shapes, obtained using local image filters. Each letter is modeled as a set of bricks. Nevertheless, this method needs to have a huge a priori knowledge of the scenario. Therefore, it works well for well-defined applications, like license plate recognition, but the performance decreases in unrestricted scenarios. [Weinman and Learned-Miller, 2006] propose a method that computes image features using Gabor filters, which decompose geometry into local orientation and scale. This approach assumes certain a priori knowledge of the language with a bigram model, which takes into account the likelihood of appearing two certain letters together, and letter case to improve recognition accuracy in context as English language rarely switches case in the middle of a word. Character classification is carried out using a measure of dissimilarity. This method needs to have a huge in-depth a priori knowledge of the language and it uses a bigram model that only works to model pairs of letters but not whole words, thus it is able to correct typos at syllable level but not at word level. Recognition based on classifying raw images is explored only for digits recognition by [LeCun et al., 1998; Zhang et al., 2006] on the MNIST and USPS datasets. Another approach is based on modeling the recognition as a shape matching problem ( [Belongie et al., 2002]): several shape descriptors are detected and extracted and point-by-point matching is computed between pairs of images. A comparison of this descriptor with other local features (Geometric Blur [Berg et al., 2005], Scale Invariant Feature Transform [Lowe, 1999], Spin image [Lazebnik et al., 2005], Maximum Response of filters [Varma and Zisserman, 2002] and Patch descriptor [Varma and Zisserman, 2003]) is presented in [de Campos et al., 2009]. Using a bag-of-visual-words representation, the authors achieve a performance far superior to commercial OCR systems for images of street scenes containing English and Kannada characters. They show that Geometric Blur and Shape Context achieve the best performance in their experiments. However, the classification time for these descriptors is very low, as achieving a good performance requires to have a huge training set in order to deal with variations in styles, fonts, colors and deformations. In [Neumann and Matas, 2010], character recognition is carried out using contourbased features and a multi-class SVM classifier, which is trained using synthetic data. The method takes into account multiple hypotheses in text localization and recognition stages and selects the best one in the final stage using a unigram language model. However, this unigram model is used only for differentiating between the upper-case and lower-case variants of certain letters, such as “C” and “c” or “P” and “p”, which are ambiguous. Grayscale features and Convolutional Neural Networks (CNNs) are proposed in [Zhu et al., 2012] to achieve character recognition with a very good performance, but they do not apply any method to correct typos. In addition, this approach requires applying an image enhancement method since it works with gray-level values. Grayscale features.
Figure
+7


Documento similar
1) X.Masip-Bruin, S.Sànchez-López, J.Solé-Pareta, J.Domingo-Pascual,, “An Alternative Path Fast Rerouting in MPLS”, in Proceedings of ISCIS XV, pp.304-313, Istambul, Turkey,
The expansionary monetary policy measures have had a negative impact on net interest margins both via the reduction in interest rates and –less powerfully- the flattening of the
Jointly estimate this entry game with several outcome equations (fees/rates, credit limits) for bank accounts, credit cards and lines of credit. Use simulation methods to
In our sample, 2890 deals were issued by less reputable underwriters (i.e. a weighted syndication underwriting reputation share below the share of the 7 th largest underwriter
In this paper we have considered the problem of forecasting the global horizontal irradiance in very short time using a particular dataset obtained from the Plataforma
In this section, we describe the experiments carried out for testing the proposed people system over our video dataset and we compare the results of our approach Edge, with three
As the wheelchair users models were trained using the dataset presented in subsection 4.1.1, the results obtained on its test images are expected to be better than the results
The figure also shows the results obtained using a standard Newton-based optimization method, and with a GA method using a standard minimum-square objective function.. We can see that
