Thyroid Function and Risk of Non-Alcoholic
Fatty Liver Disease in Euthyroid Subjects
Yiting Liu,* Wei Wang,* Xiaosong Yu,** Xingshun Qi***
* Department of Physical Examination Center, The First Affiliated Hospital, China Medical University, Shenyang, Liaoning, China. ** Department of General Practice, The First Affiliated Hospital, China Medical University, Shenyang, Liaoning, China. *** Liver Cirrhosis Study Group, Department of Gastroenterology, General Hospital of Shenyang Military Area, Shenyang, Liaoning, China.
September-October, Vol. 17 No. 5, 2018: 779-788
INTRODUCTION
Non-alcoholic fatty liver disease (NAFLD) is char-acterized as hepatic steatosis in the absence of signifi-cant alcohol use, which will evolve to non-alcoholic steatohepatitis (NASH), liver fibrosis, and cirrhosis.1,2
In this world, the prevalence of NAFLD diagnosed by imaging in the general population is about 25%,3 despite
the data from direct assessment of NAFLD by biopsy is rarely available. The incidence of NAFLD seems to be higher in Asian countries than in Western countries (52.34 vs. 28 per 1,000 person-years).3 According to the
recommendations from recently updated American As-sociation for the Study of Liver Diseases (AASLD) practice guidance and Asia-Pacific Working Party,1,2
metabolic syndrome and its components (i.e., obesity, type 2 diabetes, arterial hypertension, and dyslipi-demia) are established risk factors for NAFLD, and sleep apnea, colorectal cancer, pancreato-duodenal re-section, osteoporosis, psoriasis, and endocrinopathies (i.e., hypothyroidism, hypopituitarism, hypogonadism, and polycystic ovary syndrome) are emerging risk fac-tors.
Nowadays, there is an increasing knowledge regard-ing association between thyroid function and risk of NAFLD, because thyroid dysfunction is associated with weight gain and occurrence of insulin resistance and li-pid metabolism disorders. Until now, two large popu-lation-based studies from the Netherlands supports that free thyroxine (FT4) levels are inversely associated
The Official Journal of the Mexican Association of Hepatology, the Latin-American Association for Study of the Liver and
the Canadian Association for the Study of the Liver
Manuscript received: Manuscript received:Manuscript received:
Manuscript received:Manuscript received: September 11, 2017. Manuscript accepted:Manuscript accepted:Manuscript accepted:Manuscript accepted:Manuscript accepted: October 30 2017.
DOI:10.5604/01.3001.0012.3136
A B S T R A C T A B S T R A C T A B S T R A C T A B S T R A C T A B S T R A C T
Introduction and aims. Introduction and aims. Introduction and aims. Introduction and aims.
Introduction and aims. The association between thyroid function and non-alcoholic fatty liver disease (NAFLD) remained contro-versial. A large cross-sectional study aimed to explore the relationship in euthyroid population. Material and methods. Material and methods. Material and methods. Material and methods. Material and methods. A total of 1773 euthyroid subjects who underwent health check-up during one-year period were enrolled. NAFLD was diagnosed by ultrasound and fatty liver index (FLI). Fibrosis was estimated by BARD score. Thyroid function parameters, including thyroid-stimulating hor-mone (TSH), free triiodothyronine (FT3), and free thyroxine (FT4), were recorded. Multivariate logistic regression analyses were per-formed to identify the independent risk factors. Odds ratios (ORs) with 95% confidence intervals (CIs) were calculated. Results.Results.Results.Results.Results. NAFLD was diagnosed by ultrasound in 638 (35.98%) subjects and by FLI ≥ 60 in 694 (39.14%) subjects. Regardless of ultrasound or FLI, the overall analysis demonstrated that TSH and FT3 levels were significantly higher in subjects with NAFLD than subjects without NAFLD, but FT4 level was not significantly different between them. This association remained in middle-age subjects, but not elderly subjects. In the multivariate logistic regression analysis, TSH (OR = 1.108, 95%CI = 1.056-1.398, P = 0.024) and FT3 (OR = 1.258, 95%CI = 1.123-1.409, P = 0.000) levels were independently associated with the risk of NAFLD diagnosed by ultra-sound; and only FT3 level (OR = 1.252, 95%CI = 1.074 - 1.460, P = 0.004) was independently associated with the risk of NAFLD estimated by FLI ≥ 60. Additionally, FT3 level (OR = 1.178, 95%CI = 1.025 - 1.354, P = 0.021) was independently associated with the risk of fibrosis estimated by BARD score ≥ 2 in NAFLD subjects. Conclusion. Conclusion. Conclusion. Conclusion. Conclusion. Among the euthyroid population, FT3 and TSH levels were positively associated with the risk of NAFLD.
Key words. Key words.Key words. Key words.
with risk of NAFLD. A population-based study, which was based on the Rotterdam study and involved 9,419 individuals, demonstrated that the risk of developing NAFLD was significantly higher in individuals with subclinical and clinical hypothyroidism than in those with euthyroidism.4 In this study, subclinical and
clini-cal hypothyroidisms were characterized as increased thyroid-stimulating hormone (TSH) with normal and increased FT4 levels, respectively. Another population-based study, which was population-based on the Lifelines cohort study and involved 20,289 individuals, found that higher free triiodothyronine (FT3) and lower FT4 levels were significantly associated with higher risk of NAFLD in individuals with euthyroidism.5 Notably, the Fatty
Liv-er Index, which was an indirect diagnostic critLiv-erion for NAFLD with a moderate diagnostic accuracy, was em-ployed in both of the two large studies. Thus, their findings should be further validated.
On the other hand, according to the available evi-dence, the association of thyroid function parameters with risk of NAFLD in euthyroid subjects remains controversial. Xu, et al. conducted a cross-sectional study in 878 elderly (age ≥ 65 years) subjects with eu-thyroidism, of whom all were retried employees from a company in Ningbo, China.6 In line with the findings
from the Lifelines cohort study, the researchers found that subjects with NAFLD had significantly lower FT4 levels and higher TSH levels than subjects without. However, the FT3 levels were statistically similar be-tween the two groups. Similarly, Tao, et al. enrolled 739 subjects with euthyroidism and confirmed the Xu’s findings.7 Liu, et al. also performed a cross-sectional
study in 3,506 middle-age (age 36-60 years) subjects with euthyroidism, of whom all underwent health check-up in Jinan, China.8 In contrast with the
above-mentioned findings, the researchers found that subjects with NAFLD had significantly higher FT3 levels than subjects without. However, the FT4 and TSH levels were similar between the two groups. The accurate rea-sons why the findings were opposite among these Chi-nese studies are lacking.
Based on this background, a cross-sectional study was performed to evaluate the relationship between NAFLD and thyroid function parameters in a euthyroid general population and to further explore this relation-ship according to the different age groups.
MATERIAL AND METHODS
Study design
This is a cross-sectional study. The study was ap-proved by the Ethical Committee of the First Affiliated
Hospital of China Medical University. Inclusion crite-ria were as follows:
• Subjects who visited the Physical Examination Center at the First Affiliated Hospital of China Medical University for a health check-up between January 2015 and December 2015.
• Subjects who underwent thyroid function tests. • Subjects with euthyroidism.
Exclusion criteria were as follows:
• Excessive alcohol consumption > 20 g/day. • A history of hepatitis B or C virus infection. • Autoimmune hepatitis.
• Other liver diseases.
• Taking any hepatotoxic or thyroid medications.
Clinical and laboratory examination
After an overnight fast period, each subject went through a complete health check-up in the early morn-ing. The examination included a health habit question-naire, anthropometric measurements and laboratory tests. Height and weight were measured using an au-toanthropometer without shoes or outerwear. The body mass index (BMI, kg/m2) was calculated as weight (kg)
divided by the square of height (m2). Waist
circumfer-ence (WC) was measured with a calibrated tape posi-tioned midcourt line between the lower costal margin and the iliac crest while the patient breathed smoothly. Blood pressure of the right arm was measured twice us-ing an electronic sphygmomanometer, with participants resting at least 5 min and then in a sitting posture. The two measurements for each subject were acquired 3-min interval, and the average value was figured up as systolic blood pressure (SBP) and diastolic blood pres-sure (DBP).
Fasting whole venous blood specimens were obtained to measure the biochemical parameters of alanine ami-notransferase (ALT), aspartate amiami-notransferase (AST), alkaline phosphatase (ALP), γ-glutamyltransferase (GGT), triglyceride (TG), total cholesterol (TC), high-density lipoprotein cholesterol (HDL-C), low-high-density lipoprotein cholesterol (LDL-C), serum creatinine (Cr), blood urea nitrogen (BUN), and fasting plasma glucose (FPG). All values were measured by standard methods using a Hitachi Cobas 8000 autoanalyzer.
intra-as-say coefficients of variation (CV) for FT3, FT4 and TSH were 6.1%, 5.6% and 5.1%, respectively; and the corresponding inter-assay CV were 3.7%, 2.8% and 3.1%, respectively. Euthyroidism was defined as FT3, FT4 and thyroid-stimulating hormone (TSH) level in the nor-mal range (2.63-5.70 pmol/L for FT3, 9.01-19.05 pmol/L for FT4, and 0.35-4.94 mIU/L for TSH).
Evaluation of NAFLD
NAFLD was diagnosed on the basis of the results of hepatic ultrasonography using a Siemens Acuson X300 machine with a 3.5-MHz probe (Siemens, Erlangen, Germany). Hepatic ultrasound was operated by experi-enced physicians who were blinded to the clinical and laboratory data. Adiposis hepatica was diagnosed based on the characteristic echo patterns, as suggested by the Chinese National Consensus Workshop on NAFLD. Diagnosis of NAFLD was established after excluding excessive alcohol intake (> 20 g/day) or other causes of liver diseases, for instance, viral or autoimmune hepati-tis, drug-induced liver diseases.
Fatty liver index (FLI) is a simple and accurate tool for non-invasive diagnosis of NAFLD, which is devel-oped by Bedogni, et al.9 and externally validated by
Koehler, et al.10 In the present study, we also estimated
the diagnosis of NAFLD by FLI. BARD score is a read-ily available tool for excluding the presence of advanced fibrosis in NAFLD subjects, which is developed and validated by Harrison, et al.11
Statistical analyses
All the statistical analyses were conducted using SPSS software (SPSS Inc., Chicago, IL, USA) in ver-sion 17.0. Continuous variables were represented as mean ± standard deviation or median with interquartile range (IQR) depending on whether continuous data were normally distributed. For comparisons of contin-uous data, independent t-test or Mann-Whitney U-test was used. Chi-squared test was used for comparisons of categorical variables. Spearman rank correlation analysis was conducted to evaluate the correlation between se-rum thyroid hormone levels and other parameters. Multiple logistic regression analysis was performed to discern the independent risk factors relating to NAFLD diagnosed by ultrasound and FLI and significant fibro-sis diagnosed by BARD score. Odds ratios (ORs) with 95% confidence intervals (95%CIs) were calculated. Subgroup analyses were performed according to the different age groups (middle age: 36-60 years; elderly age: > 60 years). A two-tailed value of P < 0.05 was considered statistically significant.
RESULTS
Patients
In total, 1773 subjects were included. Among them, 638 (35.98%) had NAFLD. The mean age was 49.82 ± 10.31 years and 41.51% was male.
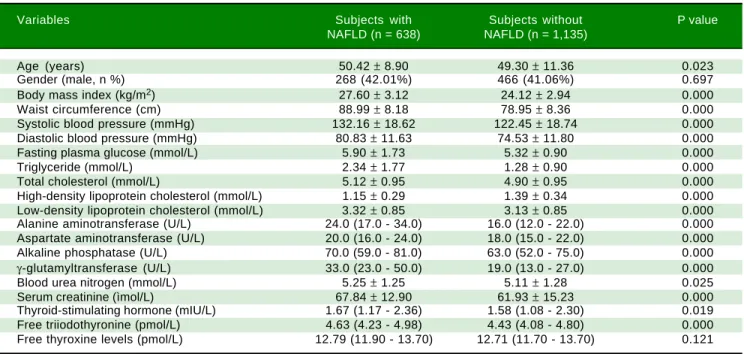
Table 1. Overall comparison between subjects with and without NAFLD diagnosed by ultrasound.
Variables Subjects with Subjects without P value
NAFLD (n = 638) NAFLD (n = 1,135)
Age (years) 50.42 ± 8.90 49.30 ± 11.36 0.023
Gender (male, n %) 268 (42.01%) 466 (41.06%) 0.697
Body mass index (kg/m2) 27.60 ± 3.12 24.12 ± 2.94 0.000
Waist circumference (cm) 88.99 ± 8.18 78.95 ± 8.36 0.000
Systolic blood pressure (mmHg) 132.16 ± 18.62 122.45 ± 18.74 0.000
Diastolic blood pressure (mmHg) 80.83 ± 11.63 74.53 ± 11.80 0.000
Fasting plasma glucose (mmol/L) 5.90 ± 1.73 5.32 ± 0.90 0.000
Triglyceride (mmol/L) 2.34 ± 1.77 1.28 ± 0.90 0.000
Total cholesterol (mmol/L) 5.12 ± 0.95 4.90 ± 0.95 0.000
High-density lipoprotein cholesterol (mmol/L) 1.15 ± 0.29 1.39 ± 0.34 0.000
Low-density lipoprotein cholesterol (mmol/L) 3.32 ± 0.85 3.13 ± 0.85 0.000
Alanine aminotransferase (U/L) 24.0 (17.0 - 34.0) 16.0 (12.0 - 22.0) 0.000
Aspartate aminotransferase (U/L) 20.0 (16.0 - 24.0) 18.0 (15.0 - 22.0) 0.000
Alkaline phosphatase (U/L) 70.0 (59.0 - 81.0) 63.0 (52.0 - 75.0) 0.000
γ-glutamyltransferase (U/L) 33.0 (23.0 - 50.0) 19.0 (13.0 - 27.0) 0.000
Blood urea nitrogen (mmol/L) 5.25 ± 1.25 5.11 ± 1.28 0.025
Serum creatinine (ìmol/L) 67.84 ± 12.90 61.93 ± 15.23 0.000
Thyroid-stimulating hormone (mIU/L) 1.67 (1.17 - 2.36) 1.58 (1.08 - 2.30) 0.019
Free triiodothyronine (pmol/L) 4.63 (4.23 - 4.98) 4.43 (4.08 - 4.80) 0.000
Free thyroxine levels (pmol/L) 12.79 (11.90 - 13.70) 12.71 (11.70 - 13.70) 0.121
Comparison between subjects with and without NAFLD
• Overall subjects. Subjects with NAFLD had
sig-nificantly higher age, BMI, WC, SBP, DBP, FPG, TG, TC, LDL-C, ALT, AST, ALP, GGT, BUN, Cr,
TSH, and FT3 and a significantly lower HDL-C (Table 1). However, the FT4 was not significantly different between subjects with and without NAFLD.
We also compared the difference between subjects with and without NAFLD estimated according to
Table 3. Comparison between middle-aged subjects with and without NAFLD diagnosed by ultrasound.
Variables Subjects with Subjects without P value
NAFLD (n = 488) NAFLD (n = 875)
Age (years) 49.21 ± 5.66 47.72 ± 6.54 0
Gender (male, n %) 228 (46.72%) 366 (41.83%) 0.081
Body mass index (kg/m2) 27.54 ± 3.05 24.17 ± 2.92 0
Waist circumference (cm) 89.60 ± 8.18 79.02 ± 8.31 0
Systolic blood pressure (mmHg) 131.17 ± 18.42 121.30 ± 17.42 0
Diastolic blood pressure (mmHg) 80.95 ± 11.57 74.65 ± 11.62 0
Fasting plasma glucose (mmol/L) 5.88 ± 1.70 5.30 ± 0.87 0
Triglyceride (mmol/L) 2.35 ± 1.73 1.32 ± 0.96 0
Total cholesterol (mmol/L) 5.13 ± 0.94 4.90 ± 0.90 0
High-density lipoprotein cholesterol (mmol/L) 1.15 ± 0.29 1.38 ± 0.33 0
Low-density lipoprotein cholesterol (mmol/L) 3.33 ± 0.84 3.14 ± 0.81 0
Alanine aminotransferase (U/L) 25.0 (18.0-34.5) 16.0 (12.0-23.0) 0
Aspartate aminotransferase (U/L) 20.0 (16.0-24.0) 18.0 (15.0-21.0) 0
Alkaline phosphatase (U/L) 70.0 (59.0-81.0) 62.0 (52.0-74.0) 0
γ-glutamyltransferase (U/L) 34.0 (24.0-52.0) 19.0 (14.0-30.0) 0
Blood urea nitrogen (mmol/L) 5.20 ± 1.15 5.10 ± 1.21 0.115
Serum creatinine (ìmol/L) 68.47 ± 12.49 61.29 ± 12.45 0
Thyroid-stimulating hormone (mIU/L) 1.68 (1.18-2.34) 1.58 (1.09-2.30) 0.047
Free triiodothyronine (pmol/L) 4.65 (4.25-5.00) 4.44 (4.11-4.82) 0
Free thyroxine levels (pmol/L) 12.76 (11.87-13.70) 12.69 (11.59-13.63) 0.146
Data are presented as means±SD or median (IQR) or percentages.
Table 2. Overall comparison between subjects with and without NAFLD estimated by FLI = 60.
Variables FLI ≥ 60 (n = 694) FLI < 60 (n = 1,079) P value
Age (years) 50.33 ± 8.98 49.32 ± 11.44 0.038
Gender (male, n %) 298 (42.94%) 436 (40.41%) 0.291
Body mass index (kg/m2) 27.64 ± 3.08 23.79 ± 2.72 0
Waist circumference (cm) 89.17 ± 7.80 77.94 ± 7.76 0
Systolic blood pressure (mmHg) 132.15 ± 18.55 121.66 ± 18.60 0
Diastolic blood pressure (mmHg) 80.90 ± 11.72 73.92 ± 11.52 0
Fasting plasma glucose (mmol/L) 5.87 ± 1.68 5.30 ± 0.90 0
Triglyceride (mmol/L) 2.35 ± 1.65 1.18 ± 0.95 0
Total cholesterol (mmol/L) 5.12 ± 0.93 4.87 ± 0.96 0
High-density lipoprotein cholesterol (mmol/L) 1.15 ± 0.28 1.42 ± 0.34 0
Low-density lipoprotein cholesterol (mmol/L) 3.31 ± 0.83 3.11 ± 0.87 0
Alanine aminotransferase (U/L) 24.0 (17.0 - 34.0) 15.0 (12.0 - 22.0) 0
Aspartate aminotransferase (U/L) 20.0 (16.0 - 24.0) 18.0 (15.0 - 21.0) 0
Alkaline phosphatase (U/L) 70.0 (59.0 - 81.0) 63.0 (52.0 - 75.0) 0
γ-glutamyltransferase (U/L) 34.0 (24.0 - 53.0) 18.0 (13.0 - 25.0) 0
Blood urea nitrogen (mmol/L) 5.27 ± 1.24 5.08 ± 1.29 0.001
Serum creatinine (ìmol/L) 68.38 ± 12.87 60.89 ± 15.09 0
Thyroid-stimulating hormone (mIU/L) 1.66 (1.16 - 2.37) 1.59 (1.09 - 2.30) 0
Free triiodothyronine (pmol/L) 4.63 (4.21 - 4.98) 4.42(4.07 - 4.78) 0.002
Free thyroxine levels (pmol/L) 12.78 (11.90 - 13.63) 12.71 (11.65 - 13.73) 0.13
FLI. Statistical results remained (Table 2). TSH and FT3, rather than FT4, was significantly associated with NAFLD estimated by FLI ≥ 60.
• Middle-age subjects. Middle-age subjects with
NAFLD had significantly higher age, BMI, WC, SBP, DBP, FPG, TG, TC, LDL-C, ALT, AST, ALP, GGT, Cr, TSH, and FT3 and a significantly lower HDL-C (Table 3). However, the FT4 was not sig-nificantly different between middle-age subjects with and without NAFLD.
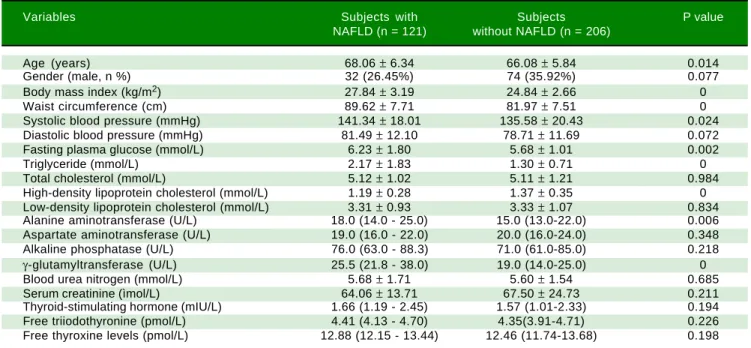
• Elderly subjects. Elderly subjects with NAFLD had
significantly higher age, BMI, WC, SBP, FPG, TG, ALT, GGT, and Cr and a significantly lower HDL-C (Table 4). However, the TSH, FT3, and FT4 were not significantly different between elderly subjects with and without NAFLD.
Prevalence of NAFLD according to the interquartiles of
thyroid function parameters
The subjects were divided according to the inter-quartile of thyroid function parameters (Figure 1). For TSH, quartile 1 (Q1): TSH ≤ 1.14 mIU/L; quartile 2 (Q2): TSH 1.14 - 1.63 mIU/L; quartile 3 (Q3): TSH 1.63 - 2.34 mIU/L; quartile 4 (Q4):TSH ≥ 2.34 mIU/L. Prevalence of NAFLD was significantly different among the four groups (p = 0.007). The prevalence of NAFLD was gradually elevated as TSH increased.
For FT3, Q1: FT3 ≤ 4.16 pmol/L; Q2: FT3 4.16 - 4.51 pmol/L; Q3: FT3 4.51 - 4.90 pmol/L; Q4: FT3 ≥ 4.90 pmol/L. Prevalence of NAFLD was significantly differ-ent among the four groups (p = 0.000). The prevalence of NAFLD was gradually elevated as FT3 increased.
For FT4, Q1: FT4 ≤ 11.80 pmol/L; Q2: FT4 11.80 -12.74 pmol/L; Q3: FT4 -12.74-13.70 pmol/L; Q4: FT4 ≥
13.70 pmol/L. Prevalence of NAFLD was not signifi-cantly different among the four groups. There was no association between FT4 and prevalence of NAFLD. Table 4. Comparison between elderly subjects with and without NAFLD diagnosed by ultrasound.
Variables Subjects with Subjects P value
NAFLD (n = 121) without NAFLD (n = 206)
Age (years) 68.06 ± 6.34 66.08 ± 5.84 0.014
Gender (male, n %) 32 (26.45%) 74 (35.92%) 0.077
Body mass index (kg/m2) 27.84 ± 3.19 24.84 ± 2.66 0
Waist circumference (cm) 89.62 ± 7.71 81.97 ± 7.51 0
Systolic blood pressure (mmHg) 141.34 ± 18.01 135.58 ± 20.43 0.024
Diastolic blood pressure (mmHg) 81.49 ± 12.10 78.71 ± 11.69 0.072
Fasting plasma glucose (mmol/L) 6.23 ± 1.80 5.68 ± 1.01 0.002
Triglyceride (mmol/L) 2.17 ± 1.83 1.30 ± 0.71 0
Total cholesterol (mmol/L) 5.12 ± 1.02 5.11 ± 1.21 0.984
High-density lipoprotein cholesterol (mmol/L) 1.19 ± 0.28 1.37 ± 0.35 0
Low-density lipoprotein cholesterol (mmol/L) 3.31 ± 0.93 3.33 ± 1.07 0.834
Alanine aminotransferase (U/L) 18.0 (14.0 - 25.0) 15.0 (13.0-22.0) 0.006
Aspartate aminotransferase (U/L) 19.0 (16.0 - 22.0) 20.0 (16.0-24.0) 0.348
Alkaline phosphatase (U/L) 76.0 (63.0 - 88.3) 71.0 (61.0-85.0) 0.218
γ-glutamyltransferase (U/L) 25.5 (21.8 - 38.0) 19.0 (14.0-25.0) 0
Blood urea nitrogen (mmol/L) 5.68 ± 1.71 5.60 ± 1.54 0.685
Serum creatinine (ìmol/L) 64.06 ± 13.71 67.50 ± 24.73 0.211
Thyroid-stimulating hormone (mIU/L) 1.66 (1.19 - 2.45) 1.57 (1.01-2.33) 0.194
Free triiodothyronine (pmol/L) 4.41 (4.13 - 4.70) 4.35(3.91-4.71) 0.226
Free thyroxine levels (pmol/L) 12.88 (12.15 - 13.44) 12.46 (11.74-13.68) 0.198
Data are presented as means ± SD or median (IQR) or percentages.
Figure 1. Figure 1.Figure 1. Figure 1.
Figure 1. Prevalence of NAFLD according to the interquartiles of thyroid function parameters.
Q1 Q2 Q3 Q4 Q1 Q2 Q3 Q4 Q1 Q2 Q3 Q4
TSH FT3 FT4
50
40
30
20
10
0
Association of thyroid function parameters with clinical and biochemical variables
TSH was positively correlated with BMI, WC, FPG, TC, AST, GGT and Cr, and negatively correlated with HDL-C. FT3 was positively correlated with BMI, WC, SBP, DBP, FPG, TG, ALT, AST, ALP, GGT, BUN and Cr, and negatively correlated with HDL-C. FT4 was not significantly correlated with clinical and biochemi-cal variables (Table 5).
Table 5. Association of thyroid function parameters with clinical and biochemical variables.
Variables TSH FT3 FT4
r P value r P value r P value
Body mass index 0.051 0.031 0.105 0 -0.027 0.261
Waist circumference 0.081 0.001 0.14 0 0.004 0.875
Systolic blood pressure 0.006 0.811 0.078 0.001 0.005 0.846
Diastolic blood pressure 0.006 0.815 0.106 0 -0.005 0.835
Fasting plasma glucose 0.065 0.006 0.094 0 0.016 0.503
Triglyceride 0.024 0.312 0.143 0 -0.032 0.177
Total cholesterol 0.05 0.035 0.019 0.418 -0.02 0.396
High-density lipoprotein cholesterol -0.066 0.006 -0.092 0 0.008 0.734
Low-density lipoprotein cholesterol 0.041 0.084 0.002 0.922 -0.047 0.05
Alanine aminotransferase 0.032 0.178 0.242 0 0.019 0.417
Aspartate aminotransferase 0.073 0.002 0.163 0 -0.024 0.307
Alkaline phosphatase 0.011 0.64 0.121 0 0.043 0.073
γ-glutamyltransferase 0.066 0.005 0.207 0 -0.005 0.824
Blood urea nitrogen 0.035 0.142 0.083 0 -0.056 0.18
Serum creatinine 0.082 0.001 0.162 0 0.018 0.445
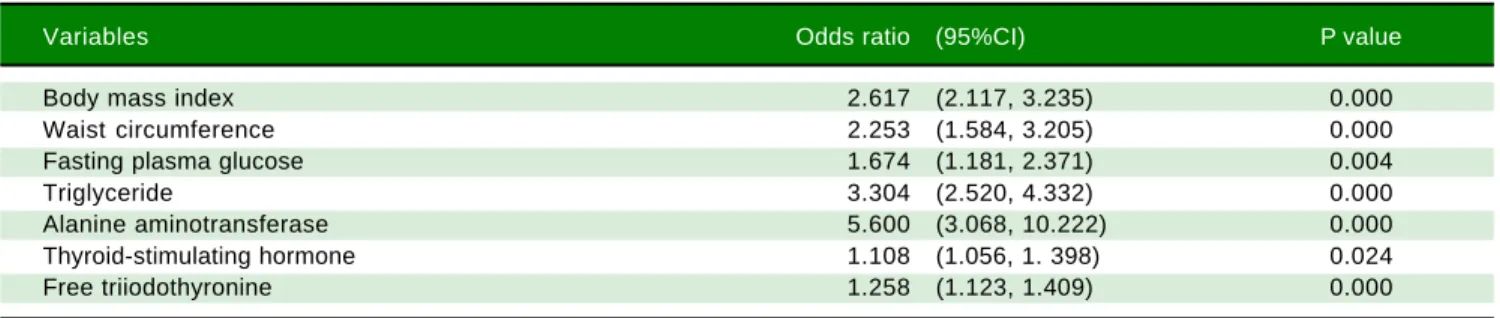
Table 6. Multivariate logistic regression analysis regarding the risk of NAFLD diagnosed by ultrasound.
Variables Odds ratio (95%CI) P value
Body mass index 2.617 (2.117, 3.235) 0.000
Waist circumference 2.253 (1.584, 3.205) 0.000
Fasting plasma glucose 1.674 (1.181, 2.371) 0.004
Triglyceride 3.304 (2.520, 4.332) 0.000
Alanine aminotransferase 5.600 (3.068, 10.222) 0.000
Thyroid-stimulating hormone 1.108 (1.056, 1. 398) 0.024
Free triiodothyronine 1.258 (1.123, 1.409) 0.000
Table 7. Multivariate logistic regression analysis regarding the risk of NAFLD estimated by FLI ≥ 60.
Variables Odds ratio (95%CI) P value
Body mass index 3.263 (2.404, 4.429) 0.000
Waist circumference 2.955 (1.889, 4.623) 0.000
Triglyceride 2.976 (2.050, 4.319) 0.000
Alanine aminotransferase 6.351 (2.426, 16.628) 0.000
γ-glutamyltransferase 2.225 (2.172, 3.851) 0.008
Free triiodothyronine 1.252 (1.074, 1.460) 0.004
Multivariate regression analysis regarding association of thyroid function parameters with NAFLD
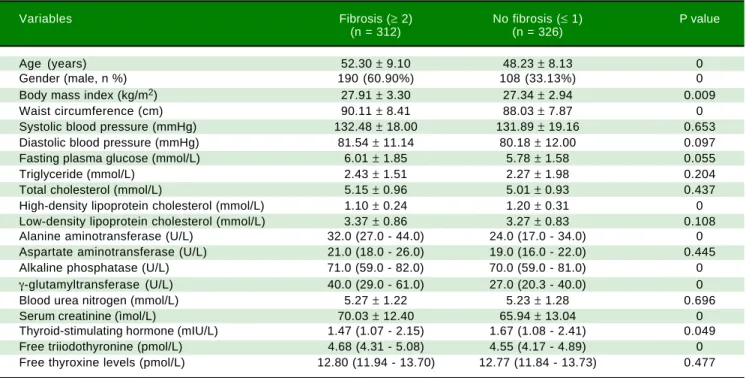
Table 8. Comparison between NAFLD subjects with and without fibrosis according to BARD score.
Variables Fibrosis (≥ 2) No fibrosis (≤ 1) P value
(n = 312) (n = 326)
Age (years) 52.30 ± 9.10 48.23 ± 8.13 0
Gender (male, n %) 190 (60.90%) 108 (33.13%) 0
Body mass index (kg/m2) 27.91 ± 3.30 27.34 ± 2.94 0.009
Waist circumference (cm) 90.11 ± 8.41 88.03 ± 7.87 0
Systolic blood pressure (mmHg) 132.48 ± 18.00 131.89 ± 19.16 0.653
Diastolic blood pressure (mmHg) 81.54 ± 11.14 80.18 ± 12.00 0.097
Fasting plasma glucose (mmol/L) 6.01 ± 1.85 5.78 ± 1.58 0.055
Triglyceride (mmol/L) 2.43 ± 1.51 2.27 ± 1.98 0.204
Total cholesterol (mmol/L) 5.15 ± 0.96 5.01 ± 0.93 0.437
High-density lipoprotein cholesterol (mmol/L) 1.10 ± 0.24 1.20 ± 0.31 0
Low-density lipoprotein cholesterol (mmol/L) 3.37 ± 0.86 3.27 ± 0.83 0.108
Alanine aminotransferase (U/L) 32.0 (27.0 - 44.0) 24.0 (17.0 - 34.0) 0
Aspartate aminotransferase (U/L) 21.0 (18.0 - 26.0) 19.0 (16.0 - 22.0) 0.445
Alkaline phosphatase (U/L) 71.0 (59.0 - 82.0) 70.0 (59.0 - 81.0) 0
γ-glutamyltransferase (U/L) 40.0 (29.0 - 61.0) 27.0 (20.3 - 40.0) 0
Blood urea nitrogen (mmol/L) 5.27 ± 1.22 5.23 ± 1.28 0.696
Serum creatinine (ìmol/L) 70.03 ± 12.40 65.94 ± 13.04 0
Thyroid-stimulating hormone (mIU/L) 1.47 (1.07 - 2.15) 1.67 (1.08 - 2.41) 0.049
Free triiodothyronine (pmol/L) 4.68 (4.31 - 5.08) 4.55 (4.17 - 4.89) 0
Free thyroxine levels (pmol/L) 12.80 (11.94 - 13.70) 12.77 (11.84 - 13.73) 0.477
Data are presented as means ± SD or median (IQR) or percentages.
Table 9. Multivariate logistic regression analysis regarding the risk of fibrosis estimated by BARD score ≥ 2 in NAFLD subjects.
Variables Odds ratio (95%CI) P value
Gender 2.448 (1.712, 3.500) 0.000
Age 2.102 (1.401, 3.152) 0.000
Alanine aminotransferase 5.466 (2.409, 10.820) 0.000
Free triiodothyronine 1.178 (1.025, 1.354) 0.021
We also conducted a multivariate logistic regression analysis regarding the risk of NAFLD estimated according to the FLI. FT3 (OR = 1.252, 95%CI = 1.074 -1.460, P = 0.004) was an independent risk factor for NAFLD estimated by FLI ≥ 60 (Table 7).
Comparison between NAFLD subjects with and without fibrosis
NAFLD subjects with fibrosis had significantly higher age, proportion of male, BMI, WC, ALT, ALP, GGT, Cr, and FT3 and significantly lower TSH and HDL-C (Table 8). However, the FT4 was not signifi-cantly different between NAFLD subjects with and without fibrosis.
Multivariate analysis demonstrated that FT3 (OR = 1.178, 95%CI = 1.025 - 1.354, P = 0.021) was independ-ent risk factor for fibrosis estimated by BARD score ≥ 2 in NAFLD subjects (Table 9).
DISCUSSION
Recent studies have explored the usefulness of se-rum thyroid function levels for the assessment of sever-ity of different liver diseases.12,13 Our present work is a
large Chinese population-based cross-sectional study exploring the association of thyroid function parame-ters with risk of NAFLD in euthyroid subjects. We found the following:
• Regardless of age, the risk of NAFLD estimated by either ultrasound or FLI was positively associated with TSH and FT3 levels.
• This association remained after adjusting well-known risk factors for NAFLD.
• This association remained in middle-age subjects, but not in elderly subjects.
no association of FT4 level with risk of NAFLD was observed; and
• The risk of fibrosis estimated by BARD score was positively associated with FT3 level in NAFLD sub-jects.
Our study found that the prevalence of NAFLD was 35.98%, which seemed to be higher than the general prevalence in Asia (27.4%, 95% confidence interval: 23.3% -31.9%). This might be explained by the fact that all sub-jects who were included in our study and underwent a health check-up might have a better living condition with a higher risk of excessive nutrition, obesity, diabetes, ab-normal lipids and metabolic syndrome.
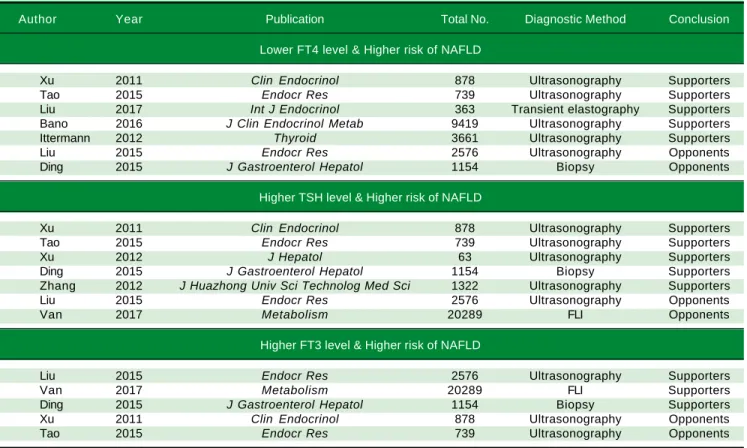
The current controversy regarding association between thyroid function parameters with risk of NAFLD is obvi-ous among studies (Table 10). A majority of studies sup-ported an inverse correlation between FT4 level and risk of NAFLD in individuals with euthyroidism or general population;4,6-7,14,15 by contrast, two studies did not find
any significant association between them.8,16 Also, a
major-ity of studies supported a positive correlation between THS level and risk of NAFLD in individuals with euthy-roidism, hepatitis B virus patients, or general popula-tion;6,7,16-18 by contrast, two studies did not find any
significant association between them.5,8 Three studies
sup-ported a positive correlation between FT3 level and risk of NAFLD in individuals with euthyroidism, hepatitis B virus patients, or general population;5,8,16 by contrast, two
studies did not find any significant association between them.6,7 Such a discrepancy should be deeply analyzed.
First, the regions where the studies were performed were different among studies. The studies by Bano,4 van den
Berg,5 and Ittermann14 were performed in Europe (the
first in Netherlands, and the latter in Germany). The re-maining studies were performed in China. Therefore, the race of subjects might be different among studies. Second, the study design was different among studies. The study by Liu, et al. was a randomized controlled trial exploring the impact of levothyroxine (LT4) supplementation on the prevalence of NAFLD in patients with subclinical hy-pothyroidism.15 The study by Bano, et al. was a cohort
study.4 By comparison, the remaining studies were
cross-sectional studies. Third, the age of subjects was different among studies. In the study by Xu, et al.,6 all subjects were
equal to or more than 65 years. In the study by Tao, et al.,7
the age was unrestricted. In the study by Liu, et al.,8 the age
of subjects ranged from 35 to 60 years. Fourth, the charac-teristics of study population were different among studies. In the studies by Tao,7 Xu,6 van den Berg,5 and Zhang,18
eu-Table 10. An overview of previous studies regarding thyroid function and risk of NAFLD.
Author Year Publication Total No. Diagnostic Method Conclusion
Lower FT4 level & Higher risk of NAFLD
Xu 2011 Clin Endocrinol 878 Ultrasonography Supporters
Tao 2015 Endocr Res 739 Ultrasonography Supporters
Liu 2017 Int J Endocrinol 363 Transient elastography Supporters Bano 2016 J Clin Endocrinol Metab 9419 Ultrasonography Supporters
Ittermann 2012 Thyroid 3661 Ultrasonography Supporters
Liu 2015 Endocr Res 2576 Ultrasonography Opponents
Ding 2015 J Gastroenterol Hepatol 1154 Biopsy Opponents
Higher TSH level & Higher risk of NAFLD
Xu 2011 Clin Endocrinol 878 Ultrasonography Supporters
Tao 2015 Endocr Res 739 Ultrasonography Supporters
Xu 2012 J Hepatol 63 Ultrasonography Supporters
Ding 2015 J Gastroenterol Hepatol 1154 Biopsy Supporters
Zhang 2012 J Huazhong Univ Sci Technolog Med Sci 1322 Ultrasonography Supporters
Liu 2015 Endocr Res 2576 Ultrasonography Opponents
Van 2017 Metabolism 20289 FLI Opponents
Higher FT3 level & Higher risk of NAFLD
Liu 2015 Endocr Res 2576 Ultrasonography Supporters
Van 2017 Metabolism 20289 FLI Supporters
Ding 2015 J Gastroenterol Hepatol 1154 Biopsy Supporters Xu 2011 Clin Endocrinol 878 Ultrasonography Opponents
thyroid subjects were selected. In the studies by Bano4
and Ittermann,14 general population was enrolled. In the
study by Ding,16 hepatitis B virus patients were enrolled.
Therefore, it might be easy to understand the potential discrepancy in the findings among studies.
Compared with previous studies, our study had its own features. First, we had a relatively large sample size. Sec-ond, we selected euthyroid subjects regardless of age. Third, we conducted the subgroup analyses according to the age of subjects (middle-age and elderly subjects). Be-cause most of subjects who underwent health check-up were older, we could not analyze the association in young subjects (< 30 years). Fourth, we conducted the multivar-iate analyses to further confirm the reliability of our find-ings. Fifth, we also conducted the correlation analyses to evaluate the association of thyroid function parameters with well-known risk factors for NAFLD. These analyses contributed to explaining the reasons why FT3 and TSH levels were significantly associated with risk of NAFLD.
Our study had two major limitations. First, we cannot evaluate a direct causal relationship between NAFLD and thyroid function. Further mechanism research is needed to clarify their exact association in prospective cohort studies. Second, liver biopsy is a golden standard for diag-nosing NAFLD and grading the liver fibrosis, but is inva-sive. By comparison, we used the ultrasonography examination and FLI for non-invasive diagnosis of NAFLD and BARD score for non-invasive assessment of fibrosis. Additionally, liver biopsy might be impractical in such a large number of subjects who underwent health check-up examinations.
In conclusion, higher levels of serum FT3 and TSH were independently associated with risk of NAFLD in eu-thyroid subjects. However, this association might be fur-ther compromised as the age of subjects was increased. Additionally, higher level of serum FT3 was positively as-sociated with the risk of fibrosis in NAFLD subjects. Large-scale, multi-ethnic, multi-regional, population-based, prospective studies should be undertaken in the fu-ture.
CONFLICT OF INTEREST
None.
FINANCIAL SUPPORT
None.
AUTHORS’ CONTRIBUTIONS
• Yiting Liu, Wei Wang collected the data. • Yiting Liu performed the statistical analyses.
• Yiting Liu, Wei Wang, Xiaosong Yu, Xingshun Qi wrote the paper.
• Yiting Liu, Xingshun Qi revised the paper. • Xiaosong Yu supervised the work.
• Yiting Liu, Wei Wang, Xiaosong Yu, Xingshun Qi approved the final manuscript.
REFERENCES
1. Chalasani N, Younossi Z, Lavine JE, Charlton M, Cusi K, Rinella M, Harrison SA, et al. The Diagnosis and Manage-ment of Nonalcoholic Fatty Liver Disease: Practice Guid-ance from the American Association for the Study of Liver Diseases. Hepatology 2017.
2. Wong VW, Chan WK, Chitturi S, Chawla Y, Dan YY, Duse-ja A, Fan J, et al. The Asia-Pacific Working Party on Nonal-coholic Fatty Liver Disease Guidelines 2017 Part 1: Definition, risk factors and assessment. J Gastroenterol Hepatol 2017.
3. Younossi ZM, Koenig AB, Abdelatif D, Fazel Y, Henry L, Wymer M. Global epidemiology of nonalcoholic fatty liver disease-Meta-analytic assessment of prevalence, inci-dence, and outcomes. Hepatology 2016; 64: 73-84. 4. Bano A, Chaker L, Plompen EP, Hofman A, Dehghan A,
Franco OH, Janssen HL, et al. Thyroid Function and the Risk of Nonalcoholic Fatty Liver Disease: The Rotterdam Study. J Clin Endocrinol Metab 2016; 101: 3204-11. 5. van den Berg EH, van Tienhoven-Wind LJ, Amini M,
Schreuder TC, Faber KN, Blokzijl H, Dullaart RP. Higher free triiodothyronine is associated with non-alcoholic fatty liver disease in euthyroid subjects: the Lifelines Cohort Study. Metabolism 2017; 67: 62-71.
6. Xu C, Xu L, Yu C, Miao M, Li Y. Association between thy-roid function and nonalcoholic fatty liver disease in euthy-roid elderly Chinese. Clin Endocrinol (Oxf) 2011; 75: 240-6.
7. Tao Y, Gu H, Wu J, Sui J. Thyroid function is associated with non-alcoholic fatty liver disease in euthyroid sub-jects. Endocr Res 2015; 40: 74-8.
8. Liu G, Zheng X, Guan L, Jiang Z, Lin H, Jiang Q, Zhang N, et al. Free triiodothyronine levels are positively associated with non-alcoholic fatty liver disease in euthyroid middle-aged subjects. Endocr Res 2015; 40: 188-93.
9. Bedogni G, Bellentani S, Miglioli L, Masutti F, Passalacqua M, Castiglione A, Tiribelli C. The Fatty Liver Index: a simple and accurate predictor of hepatic steatosis in the general population. BMC Gastroenterol 2006; 6: 33.
10. Koehler EM, Schouten JN, Hansen BE, Hofman A, Stricker BH, Janssen HL. External validation of the fatty liver index for identifying nonalcoholic fatty liver disease in a popula-tion-based study. Clin Gastroenterol Hepatol 2013; 11: 1201-4.
11. Harrison SA, Oliver D, Arnold HL, Gogia S, Neuschwan-der-Tetri BA. Development and validation of a simple NAFLD clinical scoring system for identifying patients without advanced disease. Gut 2008; 57: 1441-7. 12. Wu Y, You S, Zang H, Liu H, Mao Y, Mao P, Zhu B, et al.
Usefulness of serum thyroid-stimulation hormone (TSH) as a prognostic indicator for acute-on-chronic liver fail-ure. Ann Hepatol 2015; 14: 218-24.
14. Ittermann T, Haring R, Wallaschofski H, Baumeister SE, Nauck M, Dorr M, Lerch MM, et al. Inverse association be-tween serum free thyroxine levels and hepatic steatosis: results from the Study of Health in Pomerania. Thyroid 2012; 22: 568-74.
15. Liu L, Yu Y, Zhao M, Zheng D, Zhang X, Guan Q, Xu C, et al. Benefits of Levothyroxine Replacement Therapy on Nonalcoholic Fatty Liver Disease in Subclinical Hypothy-roidism Patients. Int J Endocrinol 2017; 2017: 5753039. 16. Ding WJ, Wang MM, Wang GS, Shen F, Qin JJ, Fan JG.
Thyroid function is associated with non-alcoholic fatty liv-er disease in chronic hepatitis B-infected subjects. J Gastroenterol Hepatol 2015; 30: 1753-8.
17. Xu L, Ma H, Miao M, Li Y. Impact of subclinical hypothy-roidism on the development of non-alcoholic fatty liver
disease: a prospective case-control study. J Hepatol 2012; 57: 1153-4.
18. Zhang J, Sun H, Chen L, Zheng J, Hu X, Wang S, Chen T. Relationship between serum TSH level with obesity and NAFLD in euthyroid subjects. J Huazhong Univ Sci Tech-nolog Med Sci 2012; 32: 47-52.
Correspondence and reprint request: Prof. Xiaosong Yu
Department of General Practice, The First Affiliated Hospital, China Medical University, No. 155 Nanjing North Street,