Fibro-check: a combination of direct and indirect markers
for liver fibrosis staging in chronic hepatitis C patients
Abdelfattah M. Attallah,* Mohamed El-Far,† Camelia A. Abdel Malak,‡ Mohamed M. Omran,§Khaled Farid,|| Mostafa A. Hussien,¶ Mohamed S. Albannan,* Ahmed A. Attallah,* Mohamed S. Elbendary,* Dalia A. Elbesh,* Noha A. Elmenier,* Mohamed O. Abdallah*
* Research & Development Department, Biotechnology Research Center, New Damietta City, Egypt.
† Faculty of Science, Mansoura University, Mansoura, Egypt. ‡ Faculty of Science, Damietta University, New Damietta, Egypt.
§ Faculty of Science, Helwan University, Cairo, Egypt. || Tropical Medicine Department, Faculty of Medicine, Mansoura University, Mansoura, Egypt. ¶ Faculty of Science, Port-Said University, Port-Said, Egypt.
ABSTRACT
Background and rationale for the study. The assessment of liver fibrosis provides useful information not only for diagnosis but also for therapeutic decision. This study was concerned with determining the levels of collagen III and its degrading enzyme matrix metalloproteinase-1 (MMP-1) as direct and complementary markers for liver fibrosis staging. Results. A total of 269 chronic hepatitis C patients constituted this study. Western blotting was used for identifying collagen III and MMP-1 in serum samples. As a result, collagen III and MMP-1 were identified, respectively, at 70 and 245 kDa using their respective mono-specific antibod-ies. These two markers were quantified in sera of patients using ELISA. Next, Fibro-check was constructed combining collagen III and MMP-1 together with other indirect markers which reflect alteration in hepatic functions that proved useful to stage liver fibrosis. Fibro-check produced area under the receiver-operat-ing characteristic curve (AUC) 0.91 and 0.83 for significant (F2-F4) and cirrhosis (F4), respectively. Addition-ally, we estimated the performance of Fibro-check in comparison with aspartate to platelet ratio index (APRI) and fibrosis index. Fibro-check seems to be more efficient than both of them. Fibro-check was then applied to the validation study to test its accuracy and reproducibility showing AUCs 0.90 for F2-F4 and 0.86 for F4. Conclusions. Fibro-check combining ‘direct’ and ‘indirect’ markers using a mathematical for-mula may improve the staging of liver fibrosis with a high degree of accuracy and seems more efficient than APRI and Fibrosis index in this group of Egyptian patients.
Key words. Collagen III. Liver biopsy. Metalloproteinases. Non-invasive.
Correspondence and reprint request: Abdelfattah M. Attallah, Ph.D. Biotechnology Research Center, P.O. Box (14), 23 July St., Industrial Zone, New Damietta 34517, Egypt.
Tel.: 02/057/2402889-2403889-2404889. Fax: 02/057/2401889 E-mail: [email protected]
Manuscript received: August 15, 2014. Manuscript accepted: October 07, 2014. INTRODUCTION
Hepatitis C virus (HCV) infection is a global health burden affecting approximately 160-170 mil-lion people worldwide.1 Once chronic HCV infection
is established, spontaneous HCV clearance rarely occurs. Chronic hepatitis C (CHC) can cause con-tinuous liver damage resulting in liver cirrhosis and subsequently hepatocellular carcinoma (HCC).2
Staging of liver fibrosis is necessary in CHC patients
because it is the important factor for initiation of treatment in patients with hepatitis C infection.3
Liver biopsy is the most commonly used reference standard for assessing liver fibrosis. However, liver biopsy is an invasive and is associated with a signif-icant risk of complications ranged from minor com-plications like pain and transient hypotension to major complications like significant bleeding which may cause death.4 These limitations have stimulated
Fibrosis is characterized by the deposition of colla-gen and other extracellular matrix proteins and their organization in complex polymers, which are insoluble and induce loss of the liver architecture.6
Collagen is synthesized as a procollagen by hepatic stellate cells (HSCs), later it is transformed to colla-gen by enzymatic splitting of the C-terminal and N-terminal end by procollagen C-proteinase and procollagen N-proteinase.7 Matrix
metalloproteinas-es are the main degrading enzyme of thmetalloproteinas-ese ECM pro-teins, and have been implicated in the processes of liver fibrosis. Among them, the matrix metalloprotei-nase-1 (MMP-1) that cleaves the native helix of fi-brillar collagens I, II and III.8 Herein, we aimed to
determine the expression of collagen III and its de-grading enzyme MMP-1 simultaneously and then es-timating their performances as surrogate markers for liver fibrosis diagnosis. Furthermore, we aimed to develop a sensitive function incorporated both collagen III and its degrading enzyme MMP-1 to-gether with other indirect markers which reflect al-teration in hepatic function for liver fibrosis staging in CHC patients and then estimated its performance in comparison with some published noninvasive tests in CHC.9,10
MATERIALS AND METHODS
Samples
Blood samples and liver biopsies of two hundred sixty-nine HCV infected individuals were collected from the Tropical Medicine department, Mansoura University hospitals, Mansoura, Egypt. One hun-dred sixty-eight patients constituted the estimation group whereas 101 patients constituted the valida-tion group. All tissue and serum samples were ob-tained with informed consent. All patients were tested negative for HBsAg (Dia.Pro, Milan, Italy). Also, all patients were tested positive for anti-HCV antibodies (Biomedica, Sorin, Italy). Patients were then confirmed for the presence of HCV-RNA using quantitative polymerase chain reaction assay (CO-BAS Ampliprep/ CO(CO-BAS TaqMan, Roche Diagnos-tics, Pleasanton, USA). Cirrhotic patients were compensated at the time of inclusion. Patients with an evidence of coexistent liver disease, a history of hepatocellular carcinoma, a previous interferon treatment and a decompensated liver disease were excluded from this study. Needle liver biopsy speci-mens were obtained with an 18-gauge or larger nee-dle. To be considered as adequate for scoring, the liver biopsies had to measure at least 15 mm and/or
contain at least five portal tracts, except for cirrho-sis for which no limitation was required. Biopsies were interpreted according to METAVIR scoring system.11 Liver function tests [albumin, total
bi-lirubin, aspartate aminotransferase (AST), alanine aminotransferase (ALT) and alkaline phosphatase (ALP)] were all measured on an automated biochem-istry analyzer (Hitachi 917; Roche Diagnostics, Mannheim, Germany). Complete blood count was performed using KX-21 Sysmex automated hematolo-gy analyzer (Sysmex Corporation, Kobe, Japan). Al-pha fetoprotein (AFP) level was estimated by chemiluminescence, with Immulite (1000) AFP kit (Diagnostic Products Corporation; Los Angeles, CA, USA).
Western blotting and gel electroelution
First, sodium dodecyl sulfate-polyacrylamide gel electrophoresis was carried out in 0.75 mm-thick, 12% vertical slab gels according to the method of Laemmli.12 Next, Western electroblotting was used
for transferring the separated protein bands onto a nitrocellulose membrane (0.45 mm pore size, Sigma) in a protein transfer unit according to Towbin, et al.13 Then, they were immunostained using
mono-specific antibodies corresponding to human collagen type III and MMP-1 separately. Finally, both colla-gen III and MMP-1 bands were cut and electroeluted separately from preparative polyacrylamide gels at 200 V for 3 h in a dialysis bag (Sigma). The protein content of the purified bands was determined14 and
the remainder was stored at -20 °C.
Quantitation of collagen III and MMP-1 using ELISA
dilution 1:500 in PBS was added (50 μL/well) and in-cubated at 37 °C for 2 h. Also, goat rabbit anti-body conjugated with alkaline phosphatase (Sigma) 1:500 in 0.2% BSA in PBS-T20 was incubated at 37 °C for 1 h. The plates were washed with PBS+0.5% Tween 20 after every step. The substrate was 1 mg/ mL p-nitrophenyl phosphate and the intensity of the signal was determined by measuring the absorbance at 450 nm after 10 minutes using a microtiter plate reader (Σ960, Metretech Inc, Germany). The cali-bration curves of the serial concentrations for the purified Collagen III (0.1–30 μg/mL) and MMP-1 (0.5-24 μg/mL) were then determined.
Statistical analysis
All statistical calculations were done by SPSS software v.15.0 (SPSS Inc., Chicago, IL) and Graph-Pad Prism package; v.5.0 (GraphGraph-Pad Software, San Diego, CA). Continuous variables were expressed as mean ± standard error of mean. A value of P < 0.05 was considered statistically significant. There were 2 endpoints in this study: presence of significant fi-brosis and cirrhosis. The correlation was evaluated by Spearman’s rank correlation coefficient. Univari-ate analysis identified the predictors of fibrosis by
using the Student’s t test. The diagnostic value was assessed by calculating the area under the receiver operating characteristic (ROC) curves. An area un-der the curve (AUC) of 1.0 is characteristic of an ideal test, whereas 0.5 indicates a test of no diagnos-tic value. All variables with high AUCs and high significance on univariate analysis were entered in stepwise linear regression analysis to develop a mod-el for identifying significant fibrosis. Based on the ROC analysis, the best cutoff points were selected and diagnostic performances (sensitivity, specificity, positive predictive value (PPV) and negative predic-tive value (NPV)) were determined.
RESULTS
Patient characteristics
One hundred sixty-eight HCV-monoinfected pa-tients fulfilled the selection criteria. The sample comprised one hundred and eleven men and fifty-sev-en womfifty-sev-en. Laboratory characteristics of all patififty-sev-ents at the time of liver biopsy are summarized in table 1. Comparison of the baseline characteristics of patients according to the stage of liver fibrosis are outlined in table 2. As individuals with significant
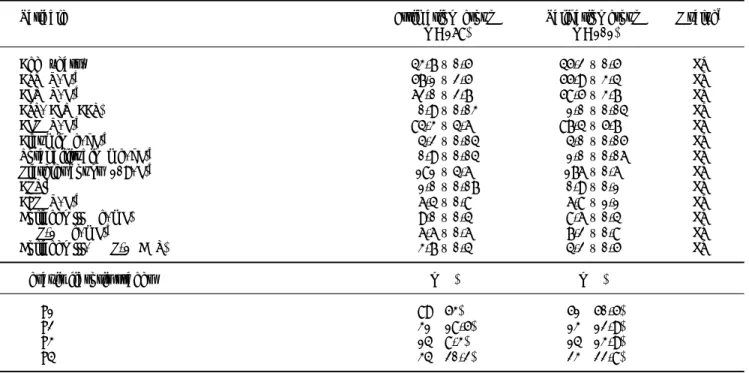
Table1. Comparison of patient characteristics in the estimation and validation groups.
Variable Estimation group Validation group P valuec
(n = 168) (n = 101)
Age (years) 43.7 ± 0.5 45.2 ± 0.5 NS
AST (U/L)a 57.1 ± 2.5 55.9 ± 3.4 NS
ALT (U/L)a 62.0 ± 2.7 58.5 ± 3.7 NS
AST/ ALT (AAR) 0.9 ± 0.03 1.0 ± 0.04 NS
ALP (U/L)a 84.3 ± 4.6 87.4 ± 5.7 NS
Albumin (g/dL)a 4.2 ± 0.04 4.0 ± 0.05 NS
Total bilirubin (mg/dL)a 0.9 ± 0.04 1.0 ± 0.06 NS
Platelet count (109/L)a 181 ± 4.6 176 ± 0.6 NS
APRIb 1.0 ± 0.07 0.9 ± 0.1 NS
AFP (U/L)a 6.4 ± 0.8 6.8 ± 1.1 NS
Collagen III (μg/mL) 9.0 ± 0.4 8.6 ± 0.4 NS MMP-1 (μg/mL)b 6.6 ± 0.6 7.2 ± 0.8 NS
Collagen III/ MMP-1 (CMR) 3.7 ± 0.4 4.2 ± 0.5 NS Metavir fibrosis stages n (%) n (%)
F1 89 (53) 51 (50.5)
F2 31 (18.5) 13 (12.9)
F3 14 (8.3) 14 (13.9)
F4 34 (20.2) 23 (22.8)
Variables were expressed as mean ± SEM. a Reference values: aspartate aminotransferase (AST) (male up to 37 U/L, female up to 31 U/L); alanine
ami-notransferase (ALT) (male up to 41 U/L, female up to 31 U/L); alkaline phosphatase (ALP) 22-92 U/L; albumin 3.8-5.4 g/dL; total bilirubin up to 1 mg/dL; platelet count 150-400 x 109/L; alpha fetoprotein (AFP) up to 10 U/L. b APRI: [(AST (U/L)/upper limits of normal)/platelet count (109/L)] x 100; MMP-1:
fibrosis (F2-F4) are at increased risk of developing cirrhosis and are usually accepted as an indication to commence treatment, the laboratory features of patients with minimal fibrosis (F1) and F2-F4 were compared by univariate analysis based on the Stu-dent’s t test. As a result, patients with F1 were young with a mean (± SEM) of 40.2 (± 0.9) years as compared to those who developed F2-F4. Moreo-ver, patients with F2-F4 were associated with high-er AST, ALT, AAR, ALP, APRI and AFP levels than those with F1. On contrary, the mean value of albu-min and platelet count decreased with the progres-sion of liver fibrosis being lower in patients who developed F2-F4 (Table 2).
Identification and
quantitation of collagen III and MMP-1
SDS-PAGE and Western blotting were used as de-scribed previously to identify the target collagen III and its degrading enzyme MMP-1. As a result, a sin-gle immunoreactive band was shown at 70 kDa and 245 kDa for collagen type III and MMP-1, respec-tively, due to their binding with their respective mono-specific antibodies. Patients with significant fi-brosis (F2-F4) were associated with higher concen-tration of collagen III than those with minimal fibrosis (F1). On the other hand, patients with F2-F4 were associated with lower concentration of MMP-1 than those with F1 (as shown in table 2). The use of collagen III per se could discriminate
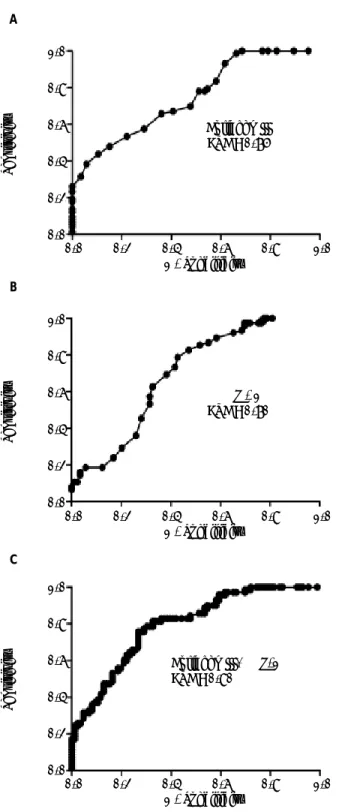
F2-F4 from F1 with an AUC = 0.75 while the use of MMP-1 per se yielded an AUC = 0.70 for identifying F2-F4 (Figures 1A, 1B). Surprisingly, it has been observed that collagen III/MMP-1 ratio (CMR) yield-ed values that increasyield-ed significantly in patients with F2-F4 vs. those with F1 (Table 2) and identi-fied F2-F4 with a better AUC = 0.80 than each marker separately (Figure 1C). Hence, the overlap in collagen III and MMP-1 among patients with F1 and F2-F4 has been diminished and the difference in their value has been amplified. Then, based on ROC curve, a cutoff point greater than 2.5 was selected for CMR for separating patients with F2-F4 from those with F1 yielding a sensitivity of 77% and specificity of 71%.
Development of the Fibro-check
The next step was aimed to enhance the diagnos-tic accuracy of CMR for diagnosing F2-F4. So, it is necessary for this ratio to be combined with other routine marker. On univariate analysis, nine of the ten evaluated routine markers included in this study showed a significant association with fibrosis stages F2-F4 (P < 0.05). They were age, AAR, albumin, to-tal bilirubin, platelet count, APRI, AFP, AST and ALP. Serum ALT did not differentiate between F1 and F2-F4 (P > 0.05) as presented in table 2. How-ever, multivariate regression modeling demonstrated that only AAR, platelet count, and AFP together with CMR retained significance when combined with
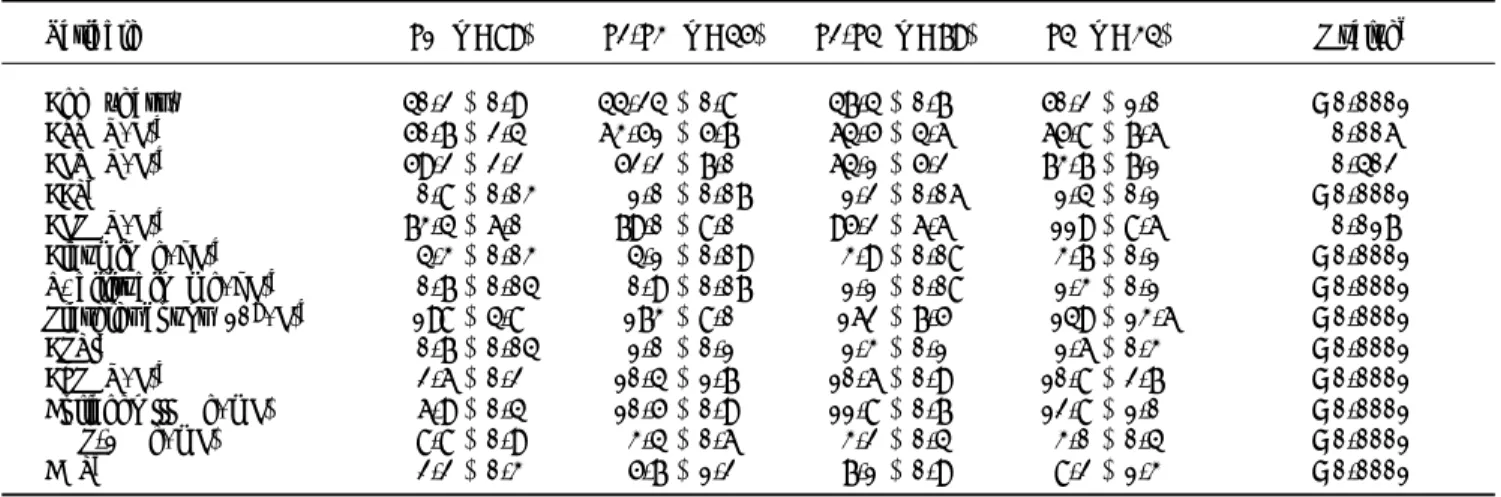
Table 2. Variables associated with the presence of significant fibrosis (F2-F4) by univariate analysis in the estimation group (n = 168).
Variable F1 (n = 89) F2-F3 (n = 45) F2-F4 (n = 79) F4 (n = 34) P valuec
Age (years) 40.2±0.9 44.24±0.8 47.4±0.7 50.2±1.0 < 0.0001 AST (U/L)a 50.7±2.4 63.51±5.7 64.5±4.6 65.8±7.6 0.006
ALT (U/L)a 59.2±2.2 52.2±7.0 64.1±5.2 73.7±7.1 0.402
AARb 0.8±0.03 1.0 ±0.07 1.2 ±0.06 1.4±0.1 < 0.0001
ALP (U/L)a 73.4±6.0 79.0±8.0 95.2±6.6 119±8.6 0.017
Albumin (g/dL)a 4.3±0.03 4.1 ±0.09 3.9 ±0.08 3.7±0.1 < 0.0001
T. bilirubin (mg/dL)a 0.7±0.04 0.9 ±0.07 1.1 ±0.08 1.3±0.1 < 0.0001
Platelet count (109/L)a 198±4.8 173 ±8.0 162 ±7.5 149±13.6 < 0.0001
APRIb 0.7±0.04 1.0 ±0.1 1.3 ±0.1 1.6±0.3 < 0.0001
AFP (U/L)a 2.6±0.2 10.4±1.7 10.6±0.9 10.8±2.7 < 0.0001
Collagen III (μg/mL) 6.9±0.4 10.5±0.9 11.8±0.7 12.8±1.0 < 0.0001 MMP-1 (μg/mL) 8.8±0.9 3.4±0.6 3.2 ±0.4 3.0±0.4 < 0.0001 CMRb 2.2±0.3 5.7±1.2 7.1 ±0.9 8.2±1.3 < 0.0001
Variables were expressed as mean ± SEM. a Reference values: aspartate aminotransferase (AST) (male up to 37 U/L, female up to 31 U/L); alanine
aminotransferase (ALT) (male up to 41 U/L, female up to 31 U/L); alkaline phosphatase (ALP) 22-92 U/L; albumin 3.8-5.4 g/dL; total bilirubin (T. bilirubin) up to 1 mg/dL; platelet count 150-400 x 109/L; alpha fetoprotein (AFP) up to 10 U/L. b APRI: AST level (U/L)/40 (upper limits of normal)/platelets count (109/L) x 100.
CMR: Collagen III/ MMP-1 ratio. c P > 0.05 is considered non significant; P < 0.05 is considered significant; P < 0.001 is considered very significant
Figure 1. Areas under receiver-operating characteristic curve (AUCs) for A. Collagen III with an AUC of 0.75, B. MMP-1 with an AUC of 0.70, C. Collagen/MMP-1 ratio (CMR) with an AUC of 0.80 for predicting significant fibrosis (F2-F4) in chron-ic hepatitis C patients in the estimation study. Each point on the ROC plot represents a sensitivity/specificity pair corre-sponding to a particular decision threshold. An AUC of 1.0 is characteristic of an ideal test whereas an AUC of 0.5 or less indicates a test of no diagnostic value.
each other. Thus, CMR, AFP, AAR and platelet count were selected as the best combination for diag-nosing F2-F4. Then, we put the positive correlation parameters (CMR, AAR and AFP) in the numerator and the negative correlation parameters (platelet count) in the denominator to formulate the follow-ing function (Table 3):
Diagnostic performance of Fibro-check
The diagnostic value of Fibro-check was then as-sessed by calculating the area under the ROC curve that showed a superior AUC of 0.91 for identifying F2-F4. Next, an optimal cutoff point of 0.05 was se-lected based on the ROC curve analysis. For Fibro-check greater than 0.05, 65 out of 79 (82% PPV) would have significant fibrosis and only 14 of 89 without significant fibrosis would be classified false-ly. At this cutoff point, significant fibrosis could be excluded with 84% NPV i.e., 16% of patients with Fibro-check less than 0.05 had significant fibrosis. Furthermore, the effectiveness of Fibro-check in predicting cirrhosis was then preformed using ROC curve producing an AUC of 0.83 lower than that produced in identifying significant fibrosis. An opti-mal cutoff point of 0.1 was selected based on the ROC curve analysis. At this cutoff point, Fibro-check had sensitivity of 74% with PPV of 45% and specificity of 77% with a NPV of 92% for predicting cirrhosis i.e. 8% of patients with Fibro-check value less than 0.1 had cirrhosis (Table 4).
Performance of Fibro-check in comparison with APRI and fibrosis index
Next, our results were compared with those of the previous reports,9,10 ROC curves of APRI9 and
fi-brosis index10 (their calculations are shown in table
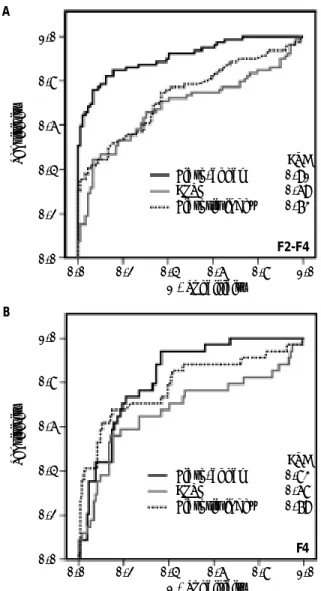
3) vs. Fibro-check were constructed and superim-posed to determine which score would have the most clinical utility to predict significant fibrosis as dis-played in figure 2A. The AUC using the procedure described by Hanley and McNeil15 was better for
Fi-bro-check (AUC = 0.91) than fibrosis index (AUC = 0.73) followed by APRI (AUC = 0.69). Next, ROC curves were also constructed and superimposed to determine which score would have the most clinical utility in predicting cirrhosis. The AUC was higher for Fibro-check (AUC = 0.83) than fibrosis index (AUC = 0.79) followed by APRI (AUC = 0.68) as
Fibro-check = CMR x AAR x AFP (U/L)platelet count (109/L)
1.0
0.8
0.6
0.4
0.2
0.0
Sensitivity
0.0 0.2 0.4 0.6 0.8 1.0 1 - Specificity
Collagen III AUC = 0.75
A
1.0
0.8
0.6
0.4
0.2
0.0
Sensitivity
0.0 0.2 0.4 0.6 0.8 1.0 1 - Specificity
MMP - 1 AUC = 0.70
1.0
0.8
0.6
0.4
0.2
0.0
Sensitivity
0.0 0.2 0.4 0.6 0.8 1.0 1 - Specificity
Collagen III/MMP-1 AUC = 0.80
B
displayed in figure 2.B. Additionally, the sensitivity, specificity, PPV and NPV for these fibrosis tests were calculated using cutoff values exactly as origi-nally described by their authors9,10 which were not
found to be optimal as shown in table 4. Moreover,
Table 3. Calculations of fibrosis tests in comparison with Fibro-check in the present study. Fibrosis testRef. Calculationa
Fibro-check [CMR x AFP (U/L) x AAR/platelet count (109/L)]
APRI9 [(AST/upper limit of normal)/platelet count (109/L)] x 100
Fibrosis index10 [8.0-0.01 x platelet count (109/L)-albumin (g/dL)]
a CMR: collagen III/ MMP-1 ratio; AFP: alpha fetoprotein; AAR: aspartate aminotransferase (AST)/alanine aminotransferase (ALT) ratio.
Figure 2. Area under the ROC curve for Fibro-check and
comparison with APRI and Fibrosis index for predicting (A) sig-nificant fibrosis, (B) cirrhosis in chronic hepatitis C patients in the estimation study (n = 168). Calculations for Fibro-check, APRI and fibrosis index are shown in table 3.
Bivariate Spearman’s rank correlation coefficient (r)
was calculated to measure the relationship between these aforementioned tests and the METAVIR fibro-sis score. As a result, Fibro-check significantly cor-related with liver fibrosis stages with a better correlation coefficient (r = 0.70, P < 0.0001) than those produced by APRI (r = 0.34, P < 0.0001) and fibrosis index (r = 0.43, P < 0.0001). Then, the di-agnostic performances of Fibro-check in discriminat-ing F1 from F2-F3, F1 from F4 and F2-F3 from F4 were evaluated and presented in table 5.
Validation study
The Fibro-check was then applied to a validation cohort comprising one hundred and one patients to test its accuracy and reproducibility. The character-istics of the validation group were similar to that of the estimation group with no significant differences in any of the assessed variables (Table 1). The Fi-bro-check significantly correlated with liver fibrosis stages (r = 0.60, P < 0.0001). The diagnostic power of Fibro-check was assessed in the validation group by ROC curve showing AUCs of 0.90 and 0.86 for identifying significant fibrosis and cirrhosis, respec-tively. At cutoff point > 0.05, Fibro-check produced 80% sensitivity with 83% PPV and 86% specificity with 82% NPV for identifying significant fibrosis. At cutoff point > 0.1, Fibro-check produced 80% sensi-tivity with 50% PPV and 78% specificity with 93% NPV for identifying cirrhosis. Additionally, the diag-nostic performances of Fibro-check in separating be-tween F1, F2-F3 and F4 were validated as seen in table 5.
DISCUSSION
It is worthy noting that serum levels of proteins directly related to the hepatic fibrogenic process could be used as surrogate markers of liver fibro-sis.16 They reflect the greater deposition of ECM in
the liver due to either increased synthesis by acti-vated stellate cells or slow removal by Kupffer and endothelial sinusoidal cells.17 These tests include
1.0
0.8
0.6
0.4
0.2
0.0
Sensitivity
0.0 0.2 0.4 0.6 0.8 1.0 1 - Specificity
AUC Fibro-check 0.91 APRI 0.69 Fibrosis index 0.73
F2-F4 A
1.0
0.8
0.6
0.4
0.2
0.0
Sensitivity
0.0 0.2 0.4 0.6 0.8 1.0 1 - Specificity
AUC Fibro-check 0.83 APRI 0.68 Fibrosis index 0.79
measures of hepatic metabolic activity, extracellular matrix remodeling proteins, collagen synthesis and degradation products, and enzymes involved in matrix degradation. Collagen is considered to be the main component of connective tissue, and is the most abundant protein in mammals.18 Of the many
collagen subtypes described, only five have been de-tected in liver; they are types I, III, IV, V and VI.19
Extracellular degradation of matrix proteins is regulated by a family of zinc-dependent neutral proteases called the matrix metalloproteinases (MMPs). These MMPs are subdivided into 3 groups; collagenases that have a role in degrading and dena-turing interstitial collagens (types I, II and III), type IV collagenases/gelatinases that degrade basement membrane (type IV) collagen and gelatins as well as stromelysins that degrade fibronectin, gelatins, proteoglycans and laminin.20 There is a relatively
large literature suggesting that MMP activity in liv-er decreases as fibrosis progresses. Decreased activi-ty of ECM-removing MMPs is mainly due to an overexpression of their specific inhibitors (TIMPs)
(21). Interstitial collagenase “MMP-1” is one of these MMPs which cleaves the native helix of fibril-lar collagens types I, II and III, specifically at a sin-gle site into one-quarter and three-quarter products; these are susceptible to further degradation by other proteinases.8
Therefore, this work was concerned with the identification and quantitative determination of both collagen III and MMP-1 and then estimating their performances as surrogate markers for accurate di-agnosis of liver fibrosis. Our results showed that pa-tients with F2-F4 were associated with higher collagen III concentration than that observed in pa-tients with F1 with extremely significant difference yielding AUC = 0.75 for diagnosing F2-F4. The lat-ter result may be explained by the fact that ECM is a highly dynamic substratum with a precisely regu-lated balance between synthesis and degradation. But upon injury, the HSCs become activated and se-crete large amounts of ECM. Consequently, ECM production exceeds ECM degradation, and hepatic fibrosis develops as a result of the progressive thick-Table 4. Diagnostic performances for Fibro-check in comparison with APRI and Fibrosis index for predicting significant fibrosis and cirrhosis in chronic hepatitis C patients.
Fibrosis testRef. Cutoffa Sna Spa PPVa NPVa
Significant fibrosis (F2-F4)
Fibro-checka > 0.05 82 84 82 84
APRI9 > 1.5 29 96 85 60
Fibrosis index10 ≥ 2.1 57 73 65 66
Cirrhosis (F4)
Fibro-checka > 0.1 74 77 45 92
APRI9 > 2.0 18 94 43 82
Fibrosis index10 ≥ 3.3 35 99 86 86
a Fibro-check = [CMR x AFP (U/L) x AAR/platelet count (109/L)]; Sn: sensitivity; Sp: specificity; PPV: positive predictive value; NPV: negative predictive value.
Table 5. Performances of Fibro-check in discriminating different stages of fibrosis.
METAVIR stages Cutoff AUCa SEa P valueb (95% CIa) Sna Spa PPVa NPVa
Estimation study (n = 168)
F1 vs. F2-F3 > 0.027 0.87 0.04 < 0.0001 0.80-0.94 80 71 55 88 F1 vs. F4 > 0.046 0.94 0.02 < 0.0001 0.90-0.99 94 84 70 97 F2-F3 vs. F4 > 0.12 0.62 0.07 0.06 0.50-0.57 71 54 57 68 Validation study (n = 101)
F1 vs. F2-F3 > 0.027 0.87 0.05 < 0.0001 0.78-0.96 79 78 63 88 F1 vs. F4 > 0.046 0.97 0.02 < 0.0001 0.93-1.00 78 86 74 93 F2-F3 vs. F4 > 0.12 0.69 0.09 0.03 0.53-0.84 80 50 57 75
a AUC: area under the receiver-operating characteristic curve; SE: standard error; CI: confidence interval; Sn: sensitivity; Sp: specificity; PPV: positive
predic-tive value; NPV: negapredic-tive predicpredic-tive value. b P > 0.05 is considered non significant; P < 0.05 is considered significant and P < 0.0001 is considered extremely
ening of fibrotic septae and chemical cross-linking of collagen.22
On contrary, the mean value of MMP-1 concen-tration decreased with the progression of liver fibro-sis being lower in patients who developed F2-F4 than those with F1 with extremely significant differ-ence yielding AUC = 0.70 for identifying F2-F4. The decreased activity of ECM-removing MMPs may be explained by the fact that TIMPs are co-expressed with MMPs and contribute to the regulation of local metalloproteinase activity. An increased hepatic TIMP expression may thus account for reduced met-alloproteinase activity and is thought to be impor-tant for hepatic fibroproliferation.23
In order to amplify the difference in collagen III and MMP-1 values among patients with F1 and F2-F4 and increase their aptitude, collagen III/MMP-1 ratio was devised that showed a better AUC = 0.80 than that produced by each individually. Indeed, it was necessary for collagen III/MMP-1 ratio to be combined with other variables to improve its diag-nostic ability for F2-F4 diagnosis. In this work, pa-tients with F2-F4 were found to have significant lower platelet count than that observed in patients with F1. The decreased level of platelet count could be interpreted by the fact that hepatic fibrosis may cause thrombocytopenia as a consequence of impaired synthesis of thrombopoietin and/or sequestering of platelets in an enlarged spleen. Many studies sup-ported that platelet count alone may be clinically val-uable as a noninvasive marker for liver fibrosis and cirrhosis.24,25 Ono, et al.26 has reported that platelet
count alone could discriminate F4 from F1-F3 in 75-80% of CHC patients. Consequently, platelet count was identified as a significant predictor of fibrosis.
On the other hand, the clinical use of AAR in the diagnostic workup of patients with chronic liver dis-ease is supported by studies conducted in several countries.27 AAR has been reported as a surrogate
marker of liver fibrosis with values greater than one being suggestive of cirrhosis.28 That’s because of
the increased release of mitochondrial AST, the decreased clearance of AST and/or impaired synthe-sis of ALT in advanced stages of liver disease.29 With
regard to AFP, it is an important marker in diag-nosing HCC. However, elevated AFP level has also been observed in chronic hepatitis C patients.30
As a consequence of these analyses, a discrimi-nant function called Fibro-check composed of colla-gen III, MMP-1 together with platelet count, AAR and AFP was created. The diagnostic value of Fibro-check was then assessed by the ROC curve giving 0.91 AUC for identifying F2-F4 and 0.83 AUC for
identifying F4. The present work was concerned with identifying the presence of F2-F4 and F4. That is because the presence of F2-F4 is accepted as an indication to commence treatment31,32 and the
pres-ence of F4 also has implications regarding screening for HCC.33
Next, we evaluated the diagnostic accuracies of some non-invasive scores for assessing the degree of liver fibrosis in comparison with our developed score in our study group. Among these, APRI9 and
fibrosis index.10 Diagnostic accuracies for these
aforementioned scores were evaluated using catego-ries and cutoff values exactly as originally described which were not found to be optimal and had AUCs lower than those reported previously by their au-thors in their original study. These discrepancies may be related to differences in the prevalence of F2-F4 and F2-F4. Also, they may be related to differences in the patient characteristics and the histopathologi-cal assessment. It is worthy noting that in Egypt, patient delay seeking medical care until symptoms get worsen that explain the lack of patient with F0 from our study population. We acknowledge that there is a limitation to the clinical use of MMP-1 and collagen III because they are not routinely available in all hospital settings.
Finally, we evaluated whether the predictive cri-teria identified in the estimation study were able to reproduce their predictive ability in a subsequent different, but related group of patients. In conclu-sion, we showed that a five-marker model combining collagen III, MMP-1 together with platelet count, AAR and AFP may improve liver fibrosis staging with a high degree of accuracy and seems more effi-cient than APRI and fibrosis index in our hands. Further prospective studies involving a greater number of patients are warranted to validate the usefulness of the produced score in clinical practice.
ABBREVIATIONS
• AAR: AST/ ALT ratio.
• ALT: alanine aminotransferase. • ALP: alkaline phosphatase.
• APRI: aspartate to platelet ratio index. • AST: aspartate aminotransferase. • AFP: alpha fetoprotein.
• CHC: chronic hepatitis C.
• CMR: collagen III/ Matrix metalloproteinase-1 ratio. • ECM: extracellular matrix.
• HCC: hepatocellular carcinoma. • HCV: hepatitis C virus.
CONFLICT OF INTEREST
The authors declared that there is no conflict of interest.
ACKNOWLEDGEMENTS
This study has been completely supported finan-cially and carried out at Biotechnology Research Center, New Damietta, Egypt.
REFERENCES
1. Lavanchy D. Evolving epidemiology of hepatitis C virus.
Clin Microbiol Infect 2011; 17: 107-15.
2. Maasoumy B, Wedemeyer H. Natural history of acute and chronic hepatitis C. Best Pract Res Clin Gastroenterol
2012; 26: 401-12.
3. Lin ZH, Xin YN, Dong QJ, Wang Q, Jiang XJ, Zhan SH, Sun Y, et al. Performance of the aspartate aminotransferase-to-platelet ratio index for the staging of hepatitis C-relat-ed fibrosis: an updatC-relat-ed meta-analysis. Hepatol 2011; 53: 726-36.
4. Martínez SM, Crespo G, Navasa M, Forns X. Noninvasive assessment of liver fibrosis. Hepatol 2011; 53: 325-35. 5. Grigorescu M. Noninvasive Biochemical Markers of Liver
Fibrosis. J Gastrointestin Liver Dis 2006; 15: 149-59. 6. Patrick M, Asselah T, Boyer N. Fibrosis and Disease
Pro-gression in Hepatitis C. Hepatology 2002; 36: S47-S56. 7. Jarcuška P, Janicko M, Veselíny E, Jarcuska P, Skladaný L.
Circulating markers of liver fibrosis progression. Clin Chim Acta 2010; 411: 1009-17.
8. Arthur MJP. Collagenases and liver fibrosis. J Hepatol
1995; 22: 43-8.
9. Wai CT, Greenson JK, Fontana RJ, Kalbfleisch JD, Marrero JA, Conjeevaram HS, Lok AS. A simple noninvasive index can predict both significant fibrosis and cirrhosis in pa-tients with chronic hepatitis C. Hepatol 2003; 38: 518-26. 10. Ohta T, Sakaguchi K, Fujiwara A, Fujioka S, Iwasaki Y, Maki-no Y, Araki Y, et al. Simple surrogate index of the fibrosis stage in chronic hepatitis C patients using platelet count and serum albumin level. Acta Med Okayama 2006; 60: 77-84. 11. Poynard T, Bedossa P, Opolon P. Natural history of liver fi-brosis progression in patients with chronic hepatitis C. The OBSVIRC, METAVIR, CLINIVIR, and DOSVIRC groups.
Lancet 1997; 349: 825-32.
12. Laemmli UK. Cleavage of structural proteins during the as-sembly of the head of bacteriophage T4. Nature 1970; 227: 680-5.
13. Towbin H, Stachlin T, Gordou J. Electrophoretic transfer of proteins from polyacrylamide gels to nitrocellulose sheets procedure and some applications. Proc Natl Acad Sci USA 1979; 76: 4350-4.
14. Lowry OH, Rosenbrough NJ, Farr AL, Randall RJ. Protein measurement with folinphenol reagent. J Biol Chem 1951; 193: 265-75.
15. Hanley JA, McNeil BJ. A method of comparing the areas un-der receiver operating characteristic curves un-derived from the same cases. Radiol 1983; 148: 839-43.
16. Fontana RJ, Lok AS. Noninvasive monitoring of patients with chronic hepatitis C. Hepatol 2002; 36: S57-S64. 17. Ladero JM. Noninvasive evaluation of liver fibrosis in patients
with chronic hepatitis C. Hepat Mon 2011; 11: 698-700. 18. Di Lullo GA, Sweeney SM, Korkko J, Ala-Kokko L, San
Anto-nio JD. Mapping the ligand-binding sites and disease-asso-ciated mutations on the most abundant protein in the human, type I collagen. J Biol Chem 2002; 277: 4223-31. 19. Alcolado R, Arthur MJ, Iredale JP. Pathogenesis of liver
fi-brosis. Clin Sci 1997; 92: 103-12.
20. Arthur MJ. Degradation of Matrix Proteins in Liver Fibro-sis. Pathol Res Pract 1994; 190: 825-33.
21. Bataller R, Brenner DA. Liver fibrosis. J Clin Invest 2005; 115: 209-18.
22. Hernandez-Gea V, Friedman SL. Pathogenesis of liver fi-brosis. Annu Rev Pathol Mech Dis 2011; 6: 425-56. 23. Lichtinghagen R, Bahr MJ, Wehmeier M, Michels D,
Haberkorn CI, Arndt B, Flemming P, et al. Expression and coordinated regulation of matrix metalloproteinases in chronic hepatitis C and hepatitis C virus-induced liver cir-rhosis. Clin Sci 2003; 105: 373-82.
24. Myres RP, De Torres M, Imbert-Bismut F, Ratziu V, Char-lotte F, Poynard T; MULTIVIRC Group. Biochemical mark-ers of fibrosis in patients with chronic hepatitis C: a comparison with prothrombin time, platelet count, and age-platelet index. Dig Dis Sci 2003; 48: 271-8.
25. Ghany MG, Lok AS, Everhart JE, Everson GT, Lee WM, Curto TM, Wright EC, et al. Predicting clinical and histologic out-comes based on standard laboratory tests in advanced chronic hepatitis C. Gasteroenterol 2010; 138: 136-46. 26. Ono E, Shiratori Y, Okudaira T, Imamura M, Teratani T,
Kanai F, Kato N, et al. Platelet count reflects stage of chronic hepatitis C. Hepatol Res 1999; 15: 192-200. 27. Hsieh YY, Tung SY, Lee IL, Lee K, Shen CH, Wei KL, Chang
TS, et al. FibroQ: an easy and useful noninvasive test for predicting liver fibrosis in patients with chronic viral hep-atitis. Chang Gung Med J 2009; 32: 614-22.
28. Williams AL, Hoofnagle JH. Ratio of serum aspartate to alanine aminotransferase in chronic hepatitis. Relation-ship to cirrhosis. Gastroenterol 1988; 95: 734-9.
29. Stauber RE, Lackner C. Noninvasive diagnosis of hepatic fibrosis in chronic hepatitis C. World J Gastroenterol
2007; 13: 4287-94.
30. Chu CW, Hwang SJ, Luo JC, et al. Clinical, virologic and pathologic significance of elevated serum alpha-fetopro-tein levels in patients with chronic hepatitis C. J Clin Gas-troenterol 2001; 32: 240-4.
31. Booth JC, O’Grady J, Neuberger J. Clinical guidelines on the management of hepatitis C. Gut 2001; 49: 11-21. 32. Strader DB, Wright T, Thomas DL, Seeff LB; American
Association for the Study of Liver Diseases. Diagnosis, management, and treatment of hepatitis C. Hepatology
2004; 39: 1147-71.
33. Adams LA, Bulsara M, Rossi E, DeBoer B, Speers D, George J, Kench J, et al. Hepascore: an accurate validated predic-tor of liver fibrosis in chronic hepatitis C infection. Clin Chem 2005; 51: 1867-73.