555
Viral Hepatitis Related Hepatocellular Carcinoma. , 2017; 16 (4): 555-564
Independent Predictors of Mortality and
Resource Utilization in Viral Hepatitis Related
Hepatocellular Carcinoma
Pegah Golabi,* Thomas Jeffers,* Zahra Younoszai,* Munkhzul Otgonsuren,* Mehmet Sayiner,** Alita Mishra,** Chapy Venkatesan,** Zobair M. Younossi*,**
* Betty and Guy Beatty Center for Integrated Research, Inova Health System, Falls Church, VA, United States. ** Center for Liver Disease, Department of Medicine, Inova Fairfax Hospital, Falls Church, VA, United States.
July-August, Vol. 16 No. 4, 2017: 555-564
ORIGINAL ARTICLE
INTRODUCTION
Hepatocellular carcinoma (HCC) is the most common form of liver cancer, and the third leading cause of cancer-related deaths in the world.1,2 Nearly 85% of HCC cases
occur in developing countries, and 80% of these cases are seen in Africa and Asia.3 Additionally, in the United States
(US), the incidence of HCC has almost tripled in the last 20 years and is expected to rise in the near future.4 In fact,
HCC is one of the few solid tumors with increasing inci-dence in the US, and deaths from HCC are increasing at a faster pace than other types of cancer.5-7
In general, the incidence of HCC is influenced by age, gender and ethnicity.8,9 In the US, HCC is twice more
common among Asians than in African Americans, who in
turn, have a higher rate of HCC than Whites.8,9
World-wide, common risk factors for HCC include HBV, HCV, alcoholic liver disease and nonalcoholic fatty liver disease (NAFLD).2,4,10 Although HCV is the leading cause of
HCC in the US, HBV has been implicated as the most common global cause of HCC.2 Additionally, the high
prevalence of obesity and the associated NAFLD have led to increasing number of cases of HCC in NAFLD pa-tients.
In the US, HCV accounts for up to 50-60% of all HCC cases and only 16% of HCC cases are attributed to HBV.11
Although nearly all cases of HCV-related HCC occur in the setting of cirrhosis, patients with HBV can develop HCC without cirrhosis.12-15 This points to potentially
dif-ferent pathogenic pathways responsible for HCC in The Official Journal of the Mexican Association of Hepatology,
the Latin-American Association for Study of the Liver and the Canadian Association for the Study of the Liver
Manuscript received: Manuscript received:Manuscript received:
Manuscript received:Manuscript received: November 06, 2016. Manuscript accepted:Manuscript accepted:Manuscript accepted: December 06, 2016.Manuscript accepted:Manuscript accepted:
DOI: 10.5604/01.3001.0010.0290
A B S T R A C T A B S T R A C T A B S T R A C T A B S T R A C T A B S T R A C T
Introduction. Introduction.Introduction. Introduction.
Introduction. Hepatitis B (HBV) and C viruses (HCV) are important causes of hepatocellular carcinoma (HCC). Our aim was to assess mortality and resource utilization of patients with HCC-related to HBV and HCV. Material and methods.Material and methods.Material and methods.Material and methods.Material and methods. National Can-cer Institute's Surveillance, Epidemiology and End Results (SEER)-Medicare linked database (2001-2009) was used. Medicare claims included patient demographic information, diagnoses, treatment, procedures, ICD-9 codes, service dates, payments, cover-age status, survival data, carrier claims, and Medicare Provider Analysis and Review (MEDPAR) data. HCC related to HBV/HCV and non-cancer controls with HBV/HCV were included. Pair-wise comparisons were made by t-tests and chi-square tests. Logistic regression models to estimate odds ratios (ORs) with 95% confidence intervals (CIs) were used. Results.Results.Results.Results.Results. We included 2,711 cas-es of HCC (518 HBV, 2,193 HCV-related) and 5,130 non-cancer controls (1,321 HBV, 3,809 HCV). Between 2001-2009, HCC cases related to HBV and HCV increased. Compared to controls, HBV and HCV patients with HCC were older, more likely to be male (73.2% vs 48.9% and 57.1% vs. 50.5%), die within one-year (49.3% vs. 20.3% and 52.2% vs. 19.2%), have decompensated cirrhosis (44.8% vs. 6.9% and 53.9% vs. 10.4%) and have higher inpatient ($60.471 vs. $47.223 and $56.033 vs. $41.005) and out-patient charges ($3,840 vs. $3,328 and $3,251 vs. $2,096) (all P < 0.05). In two separate multivariate analyses, independent predic-tors of one-year mortality were older age, being male and the presence of decompensated cirrhosis. Conclusions. Conclusions. Conclusions. Conclusions. Conclusions. The rate of viral hepatitis-related HCC is increasing. Mortality and resource utilization related to HBV and HCV-related HCC is substantial.
Key words. Key words. Key words. Key words.
patients infected with these two viruses. In fact, HBV is a DNA virus which persists in the hepatocyte nucleus while HCV is a RNA virus which replicates in the hepatocyte cytoplasm.12 Because of the high risk of HCC in patients
with cirrhosis, American Association for the Study of Liv-er Diseases (AASLD) recommended pLiv-eriodic HCC sur-veillance.16 The prognosis of HCC depends on the stage of
the tumor and patients with advanced stage HCC have poor prognosis with a 5-year survival rate of 7% and a me-dian survival of less than one year.17,18 In patients with
HCC, the mainstay of treatment is surgical resection, which is unfortunately limited to some cases due to dis-ease burden. Other treatment options include, but not limited to, liver transplantation, radiofrequency ablation, percutaneous alcohol or acetic acid ablation, trans-arterial chemoembolization.19 Previous studies showed that the
most satisfactory outcomes were reached in patients un-dergoing transplantation.20 Total inpatient charges for
HCC management have been doubled in the last decade, reflecting a tremendous burden to national healthcare.21
Over the past 3 decades, there have been important de-mographic changes that have occurred in the US. First, the so called Baby Boomer cohort with a high prevalence of HCV is increasingly developing progressive liver disease which could lead to higher rates of HCC. Additionally, there has been significant immigration to the US from the HBV-endemic areas around the world. A number of these patients with HBV and HCV are now Medicare eligible and could potentially place significant economic burden on society. In order to better understand the impact of these socio-demographic changes in the US, the aim of our study was to assess temporal trends, mortality and resource utilization in patients with HBV and HCV-related HCC in the US.
MATERIAL AND METHODS
Study design and population
The study cohorts were identified from the SEER-Medicare linked database for 2001-2009. This database links cancer registry data from the National Cancer Insti-tute's Surveillance, Epidemiology and End Results (SEER) program with Medicare enrollment and claims files.22,23 The data files included Patient Entitlement and
Diagnosis Summary File (PEDSF), Medicare Provider Analysis and Review (MEDPAR), Physician/Supplier File, and files for outpatient, hospice and carrier data. The PEDSF file contains cancer incidence data from the 15 SEER registries, which cover 26 % of the U.S. population. In addition to patient's demographics and tumor features, it also includes information on cancer treatments, date and cause of death, and Medicare enrollment. Medicare
bene-ficiaries are persons aged 65 and over (95% of people aged 65 and over are eligible), long-term disabled persons, or those with end-stage renal disease (ESRD). Beneficiaries are insured for short stay hospitals services, physician services, and outpatient visits. The linked Medicare claims include patient demographic information, diag-noses/treatment/procedure by International Classification of Diseases, Ninth Revision (ICD-9) codes, service dates, payment, coverage status, and survival in Summarized De-nominator (SUMDENOM) File, outpatient, carrier claims, and MEDPAR data. First, HCC cases were select-ed from PEDSF between 2001 and 2009. Next, we re-quested data on all HCC cases with the ICD-9 codes of 070.7, 070, 41, 070.44, 070.51, 070.54, V02.62 as HCV and 070.2, 070.3, 070.42, 070.52, V02.61 as HBV. Only those pa-tients who enrolled in Medicare Part A&B for at least 12 months before diagnosis of HCC were eligible for inclu-sion to insure adequate time for prior diagnoses to be re-corded. The following groups were excluded: missing information on date of HCC diagnosis and Charlson Co-morbidity Index; diagnosed based on solely death autop-sy; HIV; cancer site not HCC; HCV with HBV; alcoholic liver disease, and No HCV or No HBV, detailed informa-tion on study inclusion and exclusion criteria are de-scribed in Figure 1. From the SEER-registries, a total of 31,149 liver cancer cases were identified, and 2,711 cases were included in the final analytical cohort. Using a 5% random sample of Medicare beneficiaries residing in the geographic regions of the SEER registries, patients with no prior cancer diagnoses were selected as controls. Con-trol selection was based on the same inclusion and/or ex-clusion criteria as used for HCC cohort selection. HCC cases and controls were matched on the year of Medicare service and SEER regions for risk factors to minimize possible clinical trends.
Non-cancer patients (n = 5,130 non-cancer controls) with similar inclusion and exclusion criteria and one to two frequency ratio matched (based on the SEER regis-tries regions and Medicare service use dates) were ob-tained from a 5% random sample of Medicare beneficiaries (a total of 723,020 residing in the SEER are-as) who had not been diagnosed with cancer, see Figure 1. End of follow-up was defined as the earliest of either death date, last day medical service use, or the study end date of December 31, 2009.
Outcome
sepa-557
Viral Hepatitis Related Hepatocellular Carcinoma. , 2017; 16 (4): 555-564
Figure 1. Figure 1.Figure 1.
Figure 1.Figure 1. Flow chart of analytical cohort selection, SEER-Medicare, 2001-2009. * Based on SEER-registry region and Medicare service use date. SUMDENOM (non-cancer) SEER-Medicare records from 2001 to 2009, N = 723,020
Excluded, total N = 716,621 where:
Not continuously enrolled in Medicare Part A&B for at least 12-months except deceased, n = 44,841
Missing information on Charlson Comorbidity Index, n = 100,750
Solid cancer or metastatic cancer, n = 39,219
HIV, n = 2,796
Alcoholic liver disease, n = 18,567
HCV & HBV, n= 1,658
No hepatitis C (HCV) or No hepatitis B virus (HBV), n = 508,790
For random* selection, total N = 6,399
Final analytical cohort, N = 5,130
PEDSF (cancer) SEER-Medicare records from 2001 to 2009,
N = 31,149
Excluded, total N = 28,438 where:
Not continuously enrolled in Medicare Part A&B for at least 12-months except deceased, n= 1,555
Missing information on Charlson Comorbidity Index, n = 2,851
Diagnosed based on solely death autopsy, n = 312
HIV, n = 238
Alcoholic liver disease, n = 1,936
HCV & HBV, n= 1,135
No hepatitis C (HCV) or No hepatitis B virus (HBV), n = 9,431
Cancer site not HCC, n = 10,740
Missing information on date of HCC diagnosis and not matched for the random selection, n = 240
Final analytical cohort, N = 2,711
rately) were calculated as reimbursement amount with to-tal pass through amount. For hospito-tal/outpatient utiliza-tion variables that were time varying, a unique variable was created for each year and averaged from January 2001 through December 2009. For example, fee-for-service Medicare payments vary by episode, so we created 9 pay-ments for each patient representing an average payment for each of the 9 years and further averaged as a yearly average payment. Not all patients were hospitalized/utilized out-patient services during the entire study time-period; thus hospital utilization variables were coded as missing for those above patients and created indicator variables for those who utilized medical service at least once dur-ing entire study time-period. Furthermore, sub-studies involving patients who were hospitalized (approximately 70%) and patients who utilized outpatient service (approx-imately 80%) were conducted in adjusted payments to Medicare. All charges/payments were adjusted by 2009 US dollars consumer price index.
Study variables
Using Part A and B of Medicare enrolment records which had an average longitudinal followup of 5 years (IQR = 3 -8) for HCC cases and 8 (5 - 10) for non-cancer patients, we identified and defined our study variables. The following var-iables were identified: age, gender, race (White, Black, Oth-er), liver transplant recipient status (by ICD-9 diagnosis code V42.7 and ICD-9 procedure codes 505.1, 505.9), Medicare status code (aged, ESRD/ disabled), prior diagnosis of de-compensated cirrhosis, prior diagnosis of HCC (ICD-9 di-agnosis codes 789.5, 572.2, 456.0, 456.2), modified Charlson comorbidity index (CCI) (0/1, 2/3),24 and tumor stage
(local-ized, regional/distant, un-staged using the PEDSF).
Data analyses
con-Golabi P, et al.
, 2017; 16 (4): 555-564
HBV cohort HCV cohort
HBV in No HCC HBV in HCC P-value HCV in No HCC HCV in HCC P-value
Variable Total (Overall) Total (Overall) Total (Overall) Total (Overall)
(n = 1,321) (n = 518) (N = 3,809) (N = 2,193)
Age, years: Mean (SD) 71.84 (12.50) 74.41(8.08) 0.0138 66.04 (13.12) 72.44 (13.12) < 0.0001
Age at HCC diagnosis, years: Mean (SD) - 72.51 (8.14) - - 70.81 (9.47)
-Died within one-year after the last 20.3% 49.3% < 0.0001 19.2% 52.2% < 0.0001
Medicare service use
Hospitalized at least once during entire 66.4% 83.2% < 0.0001 67.0% 81.9% < 0.0001
study time period
Average # of hospital visits per year: 2.08 (1.45) 1.92 (1.24) 0.0246 2.00 (1.37) 2.02 (1.41) 0.6180
Mean (SD)
Average total inpatient charge per year: 47223.67 (77104.56) 60471.46 (92074.89) 0.0042 41005.16 (54724.50) 56033.59 (119877.9) < 0.0001 Mean (SD)
Average inpatient Medicare payment 10981.95 (10828.71) 13877.49 (17570.34) 0.0818 9485.37 (10990.20) 12672.51 (22105.40) < 0.0001 per year: Mean (SD)
Outpatient visit at least once during 88.6% 73.4% < 0.0001 90.9% 73.2% < 0.0001
entire study time period: N (%)
Average # of outpatient visits per year: 7.31 (7.31) 7.61(6.64) 0.0429 6.59 (6.19) 7.39 (6.22) < 0.0001
Mean (SD)
Average total outpatient charge per year: 3328.77 (4117.75) 3840.53(4891.00) < 0.0001 2096.61 (3032.50) 3251.32 (3513.97) < 0.0001 Mean (SD)
Average outpatient Medicare payment 514.30 (585.14) 501.01 (952.59) 0.1782 317.04 (408.81) 423.99 (448.95) < 0.0001
per year: Mean (SD)
Transplant 1.1% 7.3% < 0.0001 2.0% 8.9% < 0.0001
Male 48.9% 73.2% < 0.0001 50.5% 57.1% < 0.0001
Race, < 0.0001 < 0.0001
White 39.1% 23.2% 66.6% 58.4%
Black 13.7% 5.0% 17.6% 15.9%
Other 47.2% 71.8% 15.9% 25.8%
Medicare status code,
Aged 70.9% 88.4% < 0.0001 46.7% 76.8% < 0.0001
Disabled/end stage renal disease (ESRD) 29.1% 11.6% < 0.0001 53.3% 23.2% < 0.0001
CCI,
0/1 30.9% 22.0% 0.0001 38.6% 18.7% < 0.0001
2/3 69.1% 78.0% 0.0001 61.4% 81.3% < 0.0001
Decompensated liver cirrhosis 6.9% 44.8% < 0.0001 10.4% 53.9% < 0.0001
Cancer Stage,
Localized - 54.2% - 53.3%
-Regional/Distant - 38.4% - 36.4%
-Un-staged - 7.3% - 10.4%
559
Viral Hepatitis Related Hepatocellular Carcinoma. , 2017; 16 (4): 555-564
tinuous variables and frequencies (percentage (%)) for cat-egorical variables. Pair-wise comparisons examined be-tween HCC and No-HCC differences stratified by HBV and HCV, using t tests and χ2 tests. Because of the small
sample size of HBV with HCC (n = 518), accumulated three-year temporal trends were examined by Kruskal-Wallis tests for numerical variables and chi-square tests for categorical variables in HBV with HCC and HCV with HCC, separately. We used logistic regression models to estimate the odds ratios (ORs) with 95% confidence in-tervals (CIs) for one-year mortality, and data were evaluat-ed for HBV and HCV, separately. Further, outcomes inpatient/outpatient service payments by Medicare were found to be skewed to the right in a non-normal distribu-tion and therefore were analyzed using generalized linear model (GLM) with a gamma error distribution and a
log-link function. Multivariable regression analyses were used to assess the independent associations of patient clinic-de-mographics characteristics with outcomes. The adjusted relationship between risk factors and each outcome were estimated using coefficients from these models, which were exponentiated to yield a percentage change in the outcomes associated with each risk factor. SAS, version 9.3 (SAS Institute) was used for all our analyses.
RESULTS
After inclusion and exclusion criteria, we included 518 HBV-related HCC and 2193 HCV-related HCC cases. Ad-ditionally, 1321 HBV and 3809 HCV patients without HCC were selected as controls. A summary of demographic and clinical characteristics are summarized in Table 1.
Table 3. Multivariate-adjusted odds ratios (OR) with 95% confidence intervals (CIs) for outcome within one-year mortality from the last date of Medicare use in HBV and HCV with or without HCC.
Effect HBV with or without HCV with or without
HCC cohort OR (95% CI) HCC cohort
Age, years 1.04 (1.03-1.06) 1.05 (1.05-1.06)
Male 1.33 (1.06-1.68) 1.33 (1.17-1.51)
Race,
White Reference Reference
Black 1.35 (0.94-1.94) 1.27 (1.07-1.50)
Other 0.36 (0.28-0.46) 0.89 (0.76-1.04)
Decompensated liver cirrhosis 6.50 (4.93-8.56) 4.87 (4.28-5.55)
OR: odds ratio multivariate-adjusted obtained in the corresponding logistic regression model where other variables were presented in the model.
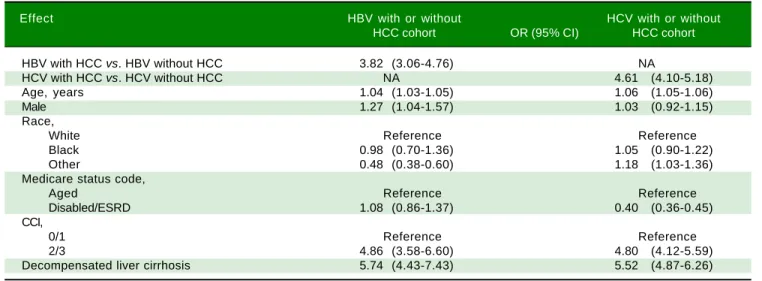
Table 2. Univariate-adjusted odds ratios (OR) with 95% confidence intervals (CIs) for outcome within one-year mortality from the last date of Medicare use in HBV and HCV with or without HCC.
Effect HBV with or without HCV with or without
HCC cohort OR (95% CI) HCC cohort
HBV with HCC vs. HBV without HCC 3.82 (3.06-4.76) NA
HCV with HCC vs. HCV without HCC NA 4.61 (4.10-5.18)
Age, years 1.04 (1.03-1.05) 1.06 (1.05-1.06)
Male 1.27 (1.04-1.57) 1.03 (0.92-1.15)
Race,
White Reference Reference
Black 0.98 (0.70-1.36) 1.05 (0.90-1.22)
Other 0.48 (0.38-0.60) 1.18 (1.03-1.36)
Medicare status code,
Aged Reference Reference
Disabled/ESRD 1.08 (0.86-1.37) 0.40 (0.36-0.45)
CCI,
0/1 Reference Reference
2/3 4.86 (3.58-6.60) 4.80 (4.12-5.59)
Decompensated liver cirrhosis 5.74 (4.43-7.43) 5.52 (4.87-6.26)
Patients with HBV-related HCC
Compared to HBV controls, HBV patients with HCC were significantly older (74.4 vs. 71.8 years). The propor-tion of patients who died within one-year was significant-ly higher in HCC group (49.3% vs. 20.3%) than controls. Although the average number of hospital visits for HCC group was lower than controls (1.92 vs. 2.08, p=.02), the average total inpatient charges were significantly higher in patients with HCC ($60,471 vs. $47,223, p = 0.004). Similarly, average total outpatient charges were higher in HCC group than controls ($3,840 vs. $3,328, p = 0.04). As expected, the rate of liver transplanta-tion (7.3% vs. 1.1%, p < 0.0001) and proportion of males (73.2% vs. 48.9%, p < 0.0001) were higher in HCC group. Furthermore, the rate of decompensated cirrhosis was significantly higher in patients with HCC (44.8% vs. 6.9%).
Patients with HCV-related HCC
For HCV cohort, the mean age of the patients with HCC was higher than controls (72.4 vs. 66 years). The pro-portion of HCV patients who died within one-year was higher in those with HCC (52.2% vs. 19.2%, p < 0.0001). Although both HCC and control groups did not vary in the average number of hospital visits (2.02 vs. 2.00), average total inpatient charges were significantly higher in HCC ($56,033 vs. $41,005, P < 0.0001). Similarly, the average number of outpatient visits (7.39 vs. 6.59) and average total outpatient charges ($3,251 vs. $2,096) were significantly higher in HCC than the controls (all P < 0.0001). Com-pared to HCV controls, the rate of liver transplantation (8.9% vs. 2.0%), proportion of males (57.1% vs. 50.5%) and the presence of decompensated cirrhosis were higher in the HCC group (53.9% vs. 10.4%, all p < .0001).
Predictors of Mortality in HBV and HCV-related HCC
In univariate analysis using the data from the HBV co-hort, presence of HCC (OR: 3.82 [95% CI, 3.06-4.76]), age (OR: 1.04 [95% CI, 1.03-1.05]), male gender (OR: 1.27 [95% CI, 1.04-1.57]), Charlson comorbidity index 2/3 (OR: 4.86 [95% CI, 3.58-6.60]) and presence of decom-pensated cirrhosis (OR: 5.74 [95% CI, 4.43-7.43]) were all associated with increased risk of within one-year mortality (Table 2).
In multivariate analysis for the same group, age (OR: 1.04 [95% CI, 1.03-1.06]), male gender (OR: 1.33 [95% CI, 1.06-1.68]) and presence of decompensated cirrhosis (OR: 6.50 [95% CI, 4.93-8.56]) remained significant (Table 3).
In univariate analysis using the data from the HCV co-hort, presence of HCC (OR: 4.61 [95% CI, 4.10-5.18]), age
(OR: 1.06 [95% CI, 1.05-1.06]), Charlson comorbidity in-dex 2/3 (OR: 4.80 [95% CI, 4.12-5.59]) and presence of de-compensated cirrhosis (OR: 5.52 [95% CI, 4.87-6.26]) were associated with increased risk of within one-year mortality (Table 2). In multivariate analysis of the same group, male gender (OR: 1.33 [95% CI, 1.17-1.51]), age (OR: 1.05 [95% CI, 1.05-1.06]) and presence of decom-pensated cirrhosis (OR: 4.87 [95% CI, 4.28-5.55]) were inde-pendent predictors of within one-year mortality (Table 3).
Predictors of resource utilization in HBV and HCV-related HCC
Univariate analysis of HBV cohort revealed that pres-ence of HCC (26%) and having Charlson score of 2/3 (25%) significantly increased inpatient payments. The strongest contributors in outpatient setting were Medi-care eligibility due to disability or ESRD (46%) and hav-ing a Charlson score of 2/3 (142%) (All P < 0.05) (Table 4).
In multivariate analysis, presence of HCC (20%) and having a Charlson score of 2/3 (31%) remained significant for inpatients, while male gender (15%), being Black (30%) and having a Charlson score of 2/3 (95%) remained significant for outpatients (All P < 0.05) (Table 5).
In univariate analysis of HCV cohort, presence of HCC (35%, 36%), male gender (10%, 19%), having a Charlson score of 2/3 (27%, 65%) and the presence of decompensat-ed cirrhosis (21%, 21%) were associatdecompensat-ed with increasdecompensat-ed in-patient and outin-patient payments (All P < .05) (Table 4). In multivariate analysis, presence of HCC (34%, 33%), male gender (8%, 19%) and having a Charlson score of 2/3 (25%, 35%) remained significant for both inpatients and outpa-tients, respectively (All P < .05) (Table 5).
DISCUSSION
This is a long-term study of Medicare recipients with HBV and HCV who developed HCC in the reported SEER database. Our data showed that for both HBV and HCV groups, compared to non-HCC patients, HCC pa-tients were older, more likely to be male, more likely to be hospitalized, had decompensated cirrhosis and die within one-year. All of these findings are consistent with previous reports.25-28
561
Viral Hepatitis Related Hepatocellular Carcinoma. , 2017; 16 (4): 555-564
Table 5. Multivariate-adjusted percent * (P value) for outcomes inpatient/outpatient service payments by Medicare.
HBV with or without HCC cohort HCV with or without HCC cohort
Inpatient Outpatient Inpatient Outpatient
Payments Payments Payments Payments
Effect Percent (P value)
HBV with HCC vs. HBV without HCC 20.214 (0.001) NA NA NA HCV with HCC vs. HCV without HCC NA NA 33.532 (< 0.001) 32.518 (< 0.001) Age, years -0.579 (0.009) NA -0.528 (< 0.001) NA Average # of hospital visits per year NA NA NA NA Average # of outpatient visits per year NA 3.689 (<.001) NA 3.029 (< 0.001) Male NA 15.200 (0.002) 7.921 (0.007) 18.959 (< 0.001) Race,
White Reference Reference Reference Reference
Black 8.873 (0.291) 30.250 (< 0.001) -3.192 (0.387) 20.636 (< 0.001) Other 23.009 (< 0.001) 6.731 (0.194) 7.953 (0.037) 27.744 (< 0.001) CCI,
0/1 Reference Reference Reference Reference
2/3 30.887 (< 0.001) 94.544 (< 0.001) 24.549 (< 0.001) 34.802 (< 0.001)
* This percent represents the predicted percentage of difference in outcome for one level of the predictor compared to the reference level, while holding all other variables constant.
Table 4. Univariate-adjusted percent * (P value) for outcomes inpatient/outpatient service payments by Medicare.
HBV with or without HCC cohort HCV with or without HCC cohort
Inpatient Outpatient Inpatient Outpatient
Payments Payments Payments Payments
Effect Percent (P value)
HBV with HCC vs.
HBV without HCC 26.123 (<.001) -0.355 (0.951) NA NA
HCV with HCC vs.
HCV without HCC NA NA 34.541 (< 0.001) 35.793 (< 0.001)
Age, years -0.355 (0.115) -0.550 (0.007) -0.130 (0.258) 0.231 (0.023)
Average # of hospital
visits per year 1.331 (0.494) 4.837 (< 0.001) 0.643 (0.527) NA
Average # of outpatient
visits per year NA NA NA 3.685 (< 0.001)
Male -1.289 (0.798) 14.245 (0.008) 10.435 (<.001) 19.302 (< 0.001)
Race,
White Reference Reference Reference Reference
Black 10.043 (0.235) 40.298 (< 0.001) -1.791 (0.633) 34.575 (< 0.001) Other 27.924 (< 0.001) -7.628 (0.138) 10.937 (0.005) 34.114 (< 0.001)
Medicare status code,
Aged Reference Reference Reference Reference
Disabled/ESRD -4.733 (0.404) 46.018 (< 0.001) -3.278 (0.246) -0.385 (0.882)
CCI,
0/1 Reference Reference Reference Reference
2/3 25.229 (< 0.001) 142.166 (<.001) 27.447 (< 0.001) 64.716 (< 0.001)
Decompensated liver cirrhosis 3.318 (0.590) 19.592 (0.009) 20.880 (< 0.001) 21.448 (< 0.001)
not significant. Moreover, when they stratified patients ac-cording to sex, age or Child-Pugh class, survival did not differ between groups. Only in patients with advanced HCC, one-year mortality was significantly higher in HBV group, but this difference was mostly due to the treatment modalities, as most HBV patients underwent palliative therapy whereas HCV patients received transplantation.29
Similarly, Shiratori, et al. reported a higher within one-year mortality rate among HBV patients with HCC (24%) than HCV patients with HCC (17%).The reason for these dif-ferent rates may have been due to differences in tumor stage and the primary etiologic factors in the study popula-tions, as well as the treatment options the patients re-ceived.30 In fact, depending on the underlying etiology,
there were also some differences between HBV and HCV patients in our study. The most important predictor of one-year mortality, the presence of decompensated cir-rhosis, was more common in patients with HCV and HCC. This finding is especially important regarding the fact that approximately 3% of patients with compensated cirrhosis with HBV or HCV infection develop HCC per year.31 A study by Yang, et al. revealed that the prevalence of
histologic cirrhosis was 88% among patients with HBV in-fection and 93% among patients with HCV inin-fection, and when the most inclusive criteria were applied, the rates in-creased to 94% for HBV patients and 97% for HCV pa-tients.14 In our study, the prevalence of decompensated
cirrhosis was in accordance with this study, as 54% of HCV patients with HCC and 45% of HBV patients with HCC had decompensated cirrhosis. Furthermore, 81% of HCV patients with HCC and 78% of HBV patients with HCC had more co-morbidities as indicated by a Charlson comorbidity index of 2/3.
Age and gender are two well-known risk factors for liv-er cancliv-er development. Previous studies clearly showed that compared to females, males had higher liver cancer rates.2,9,32 Parallel to those findings, in our study, being
male increased one-year mortality 1.3 times for both HBV and HCV patients. It was also shown previously that older age was a risk factor for HCC.9 In the US, HCC peaks around 70-75 years of age, which was also found in our study.
Another important finding of our study was related to resource utilization. In fact, both inpatient and outpatient charges in HCC group were significantly higher than non-HCC, both for HBV and HCV cohorts. In patients with HBV, the presence of HCC increased inpatient charges 1.27 times and outpatient charges 1.15 times. For HCV pa-tients, these numbers were 1.36 and 1.55, respectively. Multivariate analysis revealed that beside the presence of HCC, male gender, race (non-White non-Black) and hav-ing a Charlson index of 2/3 were also associated with in-creased resource utilization in both HBV and HCV
cohorts. Indeed, the increase in hospital charges in the US has also been reported by Kim, et al., stating that the esti-mated total charges for HCC hospitalizations increased from $241 million in 1988 to $509 million in 2000, after in-flation adjustment. It was also noted that the increase in inpatient service utilization was in part due to utilization of highly resource-intensive activities such as liver trans-plantation, local ablative therapy or embolization.33,34 In a
more recent study, Mishra, et al. investigated the economic burden of HCC between 2005 and 2009 using data from the Nationwide Inpatient Sample. It was revealed that al-though inpatient mortality decreased and length of stay remained stable, the number of inpatient cases with HCC increased, as well as the inpatient charges associated with HCC. There was a 2-fold increase in total inpatient charg-es, starting from $1 billion in 2005 and reaching up to $2 billion in 2009.21 In another study by Menzin, et al. among
HCV patients utilizing Florida Medicaid program, it was found that HCV patients with advanced liver disease diag-nosis (decompensated cirrhosis, HCC, or transplantation) had significantly higher all-cause resource use and costs compared to HCV patients without an advanced liver dis-ease diagnosis. The mean all-cause cost of HCV patients with advanced liver disease was $4,956, whereas this cost was $1,735 for HCV patients without advanced disease.35 A study by McAdam-Marx, et al. also revealed that health-care charges showed significant increase in patients with HCV infection in the presence of advanced liver disease. While mean all-cause charge was $14,917 for HCV infect-ed patients without advancinfect-ed disease, this number in-creased to $27,000 for decompensated cirrhosis, $58,529 for HCC and $113,116 for patients that undergone liver transplantation.36 In the light of these examples, it is
high-ly likehigh-ly that the reason of HCC to cause higher cost and charges were increased utilization of imaging modalities, expensive treatment options and increased hospitalization costs.
There have been tremendous changes in HCV manage-ment since the beginning of this decade, with the devel-opment of highly effective new antiviral medications. As boceprevir and telaprevir were approved in 2011 and simeprevir and sofosbuvir in 2013, successful treatment of chronic HCV infection will definitely cause a significant reduction in the burden of chronic HCV infection in the US and will decrease the incidence of HCC. However, it is still early to see this projected change in HCV and it can take several years to manifest.
This study is not free of limitations. First, the distribu-tion of HBV and HCV is not uniform among Americans. Contrary to some other parts of the world, like Africa and Asia, the most common viral etiology for HCC in the US is HCV,25 and the number of HBV cases with or without
563
Viral Hepatitis Related Hepatocellular Carcinoma. , 2017; 16 (4): 555-564
transplantation rates of HBV and HCV cohorts were dif-ferent in our study and we were not able to assess other treatment modalities (surgical resection or transarterial chemoembolization) these two groups received, which may possibly had an effect on within one-year mortality rates.
In conclusion, the rate of HCC related to viral hepati-tis is increasing. Mortality and resource utilization related to HBV and HCV-related HCC is substantial.
ABBREVIATIONS
• AASLD: American Association for the Study of Liver Diseases.
• ESRD: end-stage renal disease. • HBV: hepatitis B viruses. • HCC: hepatocellular carcinoma. • HCV: hepatitis C viruses.
• NAFLD: nonalcoholic fatty liver disease.
CONFLICT OF INTERESTS
The authors have nothing to disclose. This study was internally funded without any external fund.
ACKNOWLEDGEMENTS
The authors would like to thank Deena Hallaji, Manirath Srishord and Brian Lam, PA-C, for their great support during the formation of the manuscript.
REFERENCES
1. Singal AG, Li X, Tiro J, Kandunoori P, Adams-Huet B, Nehra MS, Yopp A. Racial, social, and clinical determinants of hepatocellular carcinoma surveillance. Am J Med 2015; 128: 90 e91-97.
2. Younossi ZM, Otgonsuren M, Henry L, Venkatesan C, Mishra A, Erario M, Hunt S. Association of nonalcoholic fatty liver disease (NAFLD) with hepatocellular carcinoma (HCC) in the United States from 2004 to 2009. Hepatology 2015. 3. Younossi ZM, Stepanova M, Saab S, Ahmed A, Lam B,
Srishord M, Venkatesan C, et al. The impact of viral hepatitis-related hepatocellular carcinoma to post-transplant out-comes. J Viral Hepat 2015.
4. El-Serag HB. Hepatocellular carcinoma. N Engl J Med 2011; 365: 1118-27.
5. de Lope CR, Tremosini S, Forner A, Reig M, Bruix J. Manage-ment of HCC. J Hepatol 2012; 56 Suppl. 1: S75-87.
6. Zhu AX. Current status of hepatocellular carcinoma in the United States. Chin Clin Oncol 2013; 2: 45.
7. Altekruse SF, Henley SJ, Cucinelli JE, McGlynn KA. Changing hepatocellular carcinoma incidence and liver cancer mortality rates in the United States. Am J Gastroenterol 2014; 109: 542-53.
8. El-Serag HB. Epidemiology of viral hepatitis and hepatocellu-lar carcinoma. Gastroenterology 2012; 142: 1264-73 e1261. 9. El-Serag HB, Rudolph KL. Hepatocellular carcinoma:
epidemi-ology and molecular carcinogenesis. Gastroenterepidemi-ology 2007; 132: 2557-76.
10. Nordenstedt H, White DL, El-Serag HB. The changing pattern of epidemiology in hepatocellular carcinoma. Dig Liver Dis 2010; 42 Suppl. 3: S206-214.
11. Gambarin-Gelwan M. Viral hepatitis, non-alcoholic fatty liver disease and alcohol as risk factors for hepatocellular carci-noma. Chin Clin Oncol 2013; 2: 32.
12. Hiotis SP, Rahbari NN, Villanueva GA, Klegar E, Luan W, Wang Q, Yee HT. Hepatitis B vs. hepatitis C infection on viral hepatitis-associated hepatocellular carcinoma. BMC Gastro-enterol 2012; 12: 64.
13. Fattovich G, Stroffolini T, Zagni I, Donato F. Hepatocellular carcinoma in cirrhosis: incidence and risk factors. Gastroen-terology 2004; 127: S35-50.
14. Yang JD, Kim WR, Coelho R, Mettler TA, Benson JT, Sander-son SO, Therneau TM, et al. Cirrhosis is present in most pa-tients with hepatitis B and hepatocellular carcinoma. Clin Gastroenterol Hepatol 2011; 9: 64-70.
15. Szpakowski JL, Tucker LY. Causes of death in patients with hepatitis B: a natural history cohort study in the United States. Hepatology 2013; 58: 21-30.
16. Bruix J, Sherman M. Management of hepatocellular carcino-ma: an update. Hepatology 2011; 53: 1020-2.
17. Llovet JM, Bustamante J, Castells A, Vilana R, Ayuso M del C, Sala M, Bru C, et al. Natural history of untreated nonsurgi-cal hepatocellular carcinoma: rationale for the design and evaluation of therapeutic trials. Hepatology 1999; 29: 62-7. 18. Thein HH, Campitelli MA, Yeung LT, Zaheen A, Yoshida EM,
Earle CC. Improved Survival in Patients with Viral Hepatitis-Induced Hepatocellular Carcinoma Undergoing Recommend-ed Abdominal Ultrasound Surveillance in Ontario: A Population-Based Retrospective Cohort Study. PLoS One 2015; 10: e0138907.
19. Yu SJ. A concise review of updated guidelines regarding the management of hepatocellular carcinoma around the world: 2010-2016. Clin Mol Hepatol 2016; 22: 7-17. 20. Wong RJ, Wantuck J, Valenzuela A, Ahmed A, Bonham C,
Gallo A, Melcher ML, et al. Primary surgical resection versus liver transplantation for transplant-eligible hepatocellular car-cinoma patients. Dig Dis Sci 2014; 59: 183-91.
21. Mishra A, Otgonsuren M, Venkatesan C, Afendy M, Erario M, Younossi ZM. The inpatient economic and mortality im-pact of hepatocellular carcinoma from 2005 to 2009: analy-sis of the US nationwide inpatient sample. Liver Int 2013; 33: 1281-6.
22. Warren JL, Klabunde CN, Schrag D, Bach PB, Riley GF. Overview of the SEER-Medicare data: content, research ap-plications, and generalizability to the United States elderly population. Med Care 2002; 40: IV-3-18.
23. Welzel TM, Graubard BI, Zeuzem S, El-Serag HB, Davila JA, McGlynn KA. Metabolic syndrome increases the risk of pri-mary liver cancer in the United States: a study in the SEER-Medicare database. Hepatology 2011; 54: 463-71.
24. Klabunde CN, Potosky AL, Legler JM, Warren JL. Develop-ment of a comorbidity index using physician claims data. J Clin Epidemiol 2000; 53: 1258-67.
25. Parkin DM, Bray F, Ferlay J, Pisani P. Global cancer statis-tics, 2002. CA Cancer J Clin 2005; 55: 74-108.
26. Lu T, Seto WK, Zhu RX, Lai CL, Yuen MF. Prevention of hepatocellular carcinoma in chronic viral hepatitis B and C in-fection. World J Gastroenterol 2013; 19: 8887-94.
28. Lin J, Wu JF, Zhang Q, Zhang HW, Cao GW. Virus-related liver cirrhosis: molecular basis and therapeutic options. World J Gastroenterol 2014; 20: 6457-69.
29. Cantarini MC, Trevisani F, Morselli-Labate AM, Rapaccini G, Farinati F, Del Poggio P, Di Nolfo MA, et al. Effect of the etiol-ogy of viral cirrhosis on the survival of patients with hepato-cellular carcinoma. Am J Gastroenterol 2006; 101: 91-8. 30. Shiratori Y, Shiina S, Imamura M, Kato N, Kanai F, Okudaira
T, Teratani T, et al. Characteristic difference of hepatocellu-lar carcinoma between hepatitis B- and C- viral infection in Japan. Hepatology 1995; 22: 1027-33.
31. Colombo M, de Franchis R, Del Ninno E, Sangiovanni A, De Fazio C, Tommasini M, Donato MF, et al. Hepatocellular carci-noma in Italian patients with cirrhosis. N Engl J Med 1991; 325: 675-80.
32. Degos F, Christidis C, Ganne-Carrie N, Farmachidi JP, Degott C, Guettier C, Trinchet JC, et al. Hepatitis C virus related cir-rhosis: time to occurrence of hepatocellular carcinoma and death. Gut 2000; 47: 131-6.
33. Kim WR, Gores GJ, Benson JT, Therneau TM, Melton LJ, 3rd. Mortality and hospital utilization for hepatocellular carcinoma in the United States. Gastroenterology 2005; 129: 486-93.
34. Wang CH, Wey KC, Mo LR, Chang KK, Lin RC, Kuo JJ. Cur-rent trends and recent advances in diagnosis, therapy, and prevention of hepatocellular carcinoma. Asian Pac J Cancer Prev 2015; 16: 3595-604.
35. Menzin J, White LA, Nichols C, Deniz B. The economic bur-den of advanced liver disease among patients with hepatitis C virus: a large state Medicaid perspective. BMC Health Serv Res 2012; 12: 459.
36. McAdam-Marx C, McGarry LJ, Hane CA, Biskupiak J, Deniz B, Brixner DI. All-cause and incremental per patient per year cost associated with chronic hepatitis C virus and associat-ed liver complications in the Unitassociat-ed States: a managassociat-ed care perspective. J Manag Care Pharm 2011; 17: 531-46.
Correspondence and reprint request:
Zobair M. Younossi, M.D., MPH
Betty and Guy Beatty Center for Integrated Research Claude Moore Health Education and Research Building
3300 Gallows Road, Falls Church, VA 22042 Tel.: (703) 776-2540 Fax: (703) 776-4386