Face pose estimation with automatic 3D model creation for a driver inattention monitoring application
140
0
0
Texto completo
(2)
(3) Agradecimientos Si bien un modelo incremental e iterativo puede ser bueno para muchas aplicaciones y tal vez para el desarrollo de una tesis doctoral, desde luego no lo es tanto para los que tienen la tarea de corregirla, de forma igualmente incremental e iterativa. Es por ello que empiezo agradeciendo la encomiable labor de corrección que han realizado el Dr. Luis Miguel Bergasa y el Dr. Jesús Nuevo. A Luis Miguel por su constante ayuda y apoyo. Sin él, esta tesis corrı́a el riesgo de no haber terminado, y tampoco hubiera evolucionado como lo ha hecho. Le tengo que agradecer enormemente su dedicación e infinita paciencia ya desde los comienzos del doctorado, hace ya más de cuatro años. A Jesús le agradezco sus continuos mensajes de ánimo. Su trabajo sirvió de base para mis investigaciones, y su ayuda con la lengua de Shakespeare ha probado ser inestimable. En definitiva, Jesús ha sido imprescindible para escribir una tesis fuerte y sana. Desde el año 2000 con nuestro primer robot, ha estado ahı́ compartiendo proyectos y trabajando de más por mi culpa. Al resto de miembros de RobeSafe, que hacen las horas de trabajo y desarrollo mucho más llevaderas, también agradecerles su amistad, simpatı́a y apoyo constante. A Pablo, Llorca, Sotelo, Nacho, Revenga por su interminable ayuda teórica y técnica. A Iván, los alcarreños Edu y Raul, y el último en llegar, pero no menos importante, Almazán, por ser tan buenos compañeros, y poner ese grado de humanidad y ¿cordura? necesario en todo laboratorio. A Javi por contribuir con la causa y venir a currar en bici. A Sergio por organizar los partidos de fútbol. Y también al resto de compañeros de laboratorio, Álvaro, Ángel, Carlos, David, Fer, Miguel, Noe y Óscar por su buen humor. En el desarrollo técnico y testeo también ha sido imprescindible la ayuda de los miembros del Consorcio CABINTEC, Beatriz Delgado y Matı́as Sevillano de ESM, y el resto de miembros del CEIT e instituciones implicadas: Universidad Rey Juan Carlos y Universidad de Valencia. Quisiera agradecérselo de todo corazón también a mi familia más cercana: mis padres, mi hermano Santi, mis abuelos que no me ven el pelo, y por supuesto a Loli, que ha dejado de hacer tantas cosas por culpa de la que es nuestra primera tesis (chispas), y que ha acabado por aprendérsela de tanto releerla. Gracias a ella los años de trabajo han pasado más rápido y felices. A mi hermano Santi por sacarme de paseo a hacer un poco de ejercicio, ya que la tesis ayuda a la mente (o no), pero oxida las articulaciones. Gracias a mi madre que tantas veces me ha esperado para comer y yo mientras escribı́a la tesis olvidé la cita. A mi padre, al cual no he podido visitar tan a menudo como me hubiera gustado, y que ha sabido entenderlo. Y aunque ella todavı́a no sea consciente, agradecer también a mi hermana Paula, por hacerme recordar lo feliz que yo era de pequeño, y por ayudarme a ver lo feliz que ahora soy también. Paula, como el resto, me ve con poca frecuencia, pero ella es la única que aún no comprende porqué. Y gracias también a Loli y Diego, pues porque se lo merecen. Me temo que, al igual que mi madre, todavı́a no iii.
(4) iv. tienen muy claro de qué va la tesis (y ası́ seguirá siendo, por culpa del inglés) o para qué sirve, pero eso no ha cambiado su postura de apoyarme y animarme incondicionalmente desde el principio. También quisiera mandar un profundo agradecimiento a todos mis amigos, a los de Alcalá y a los de Guada, que estaban ahı́ antes de la tesis, y siguen estando después, a pesar de las pocas visitas intermedias. Por otro lado, la tesis también a aportado viajes inolvidables como las estancias rodeado de Leprechauns y en Down Under. Algunos de los mejores momentos durante estos más de cuatro años tuvieron lugar en la tierra de Oz, como el atravesar zonas boscosas cada dı́a mientras iba a trabajar en bicicleta. Todo ello compensó el esfuerzo de las reuniones a través de Skype. En resumen, son muchas las personas a las que pertenece una pequeña o gran parte de este trabajo, pero como aún son más las ganas de acabar, los agradecimientos finalizan aquı́. Gracias a todos.. “Los hemos visto. Hemos encontrado a los hombres.” (...) “Caminan sobre cuatro extremidades en forma de ruedas que giran vertiginosamente.” De la Tierra a Halley, Lucı́a Baquedano, 1988.. “We have seen them. We have found men.” (...) “They walk on four extremities in the shape of wheels that run in a giddy way.” From the Earth to Halley, Lucı́a Baquedano, 1988..
(5) Resumen Recientes estudios han identificado la inatención (incluyendo distracción y somnolencia) como la mayor causa de accidentes, siendo responsable de al menos un 25% de ellos. La distracción en conductores se ha estudiado menos, ya que depende de muchos factores, aunque representa un mayor riesgo que la fatiga. Además, la distracción está presente en más de la mitad de los accidentes causados por algún tipo de inatención. Cada dı́a existen más sistemas de información embarcados en los vehı́culos (In Vehicle Information Systems, IVIS), lo que incrementa el riesgo de provocar distracciones y modifica el comportamiento de los conductores. Esto hace que las investigaciones en este ámbito sean de vital importancia. Para abordar el análisis de las distracciones durante la conducción, distintos grupos de investigadores han trabajo en diversas técnicas, entre las que destaca la Visión por Computador dado que permite, mediante el uso de tecnologı́a relativamente barata, la monitorización del conductor de forma no intrusiva. Mediante técnicas de visión como el seguimiento facial se puede evaluar su movimiento con objeto de caracterizar el estado de atención del conductor. En esta tesis se presentan varias técnicas de visión 3D usando una cámara estéreo para obtener en tiempo real y de forma completamente automática la dirección de la cara y de la mirada de una persona. A partir de esta información se infieren las distracciones en el conductor. Los métodos aquı́ mostrados funcionan de forma completamente automática e independiente del usuario. Para detectar la dirección de la cara del conductor, primero se crea un modelo 3D no denso usando las coordenadas de puntos caracterı́sticos de la misma, obtenidos gracias al par de cámaras estéreo. Durante la ejecución del algoritmo, se hace un seguimiento de los puntos caracterı́sticos, mientras el modelo se va ampliando y corrigiendo automáticamente cuando nuevas partes de la cara, previamente ocultas, se hacen visibles a las cámaras. Se evalúan varias técnicas para la determinación y seguimiento de los puntos del modelo. Primeramente se estudia el comportamiento de un seguidor basado en descriptores SURF, por ser una de las técnicas más ampliamente usadas en visión. Sin embargo, debido a las condiciones de baja iluminación y lo suaves que son los contornos de una cara, esta técnica no produce buenos resultados. Este hecho, unido al elevado coste computacional de la misma, hacen que dicha técnica sea descartada. Por ello, se diseña una técnica de seguimiento mediante correlación multisize (multitamaño), basada en el uso de parches de distintos tamaños a una misma escala. Esta técnica ofrece una leve mejora en el posicionamiento y tiempos de ejecución con respecto al uso de parches multiescala. Esta técnica es robusta gracias a la aportación de los parches más grandes, y es de más precisión gracias a los parches más pequeños. La cara puede rotar en un rango horizontal de ±90◦ , lo que hace que la apariencia de los puntos caracterı́sticos cambie notablemente. Para abordar este problema, se introduce una técnica novedosa de re-registering para robustecer el seguimiento de las caracterı́sv.
(6) vi. ticas que forman el modelo, aprovechando las vistas que se tienen de la cara desde las distintas cámaras. La muestra de cada caracterı́stica que se tiene almacenada y se usa para la localización del punto 2D sobre la cara se va actualizando conforme la cara rota, aprovechando los puntos de mı́nimo error en la estimación de la pose. De este modo, cada muestra solo se usa en el tracking en un rango de ±7, 5◦ . Puesto que el modelo se crea inicialmente con una vista frontal de la cara, solo se pueden capturar puntos caracterı́sticos de la parte frontal. Cuando se producen rotaciones, algunos de esos puntos se ocultan, por lo que se hace necesario añadir nuevos puntos al modelo para evitar que el número de puntos visibles disminuya. Tras añadir puntos de partes de la cara previamente ocultas, se ejecuta un Bundle Adjustment para reducir el error acumulativo que se puede producir al añadir puntos. El modelo 3D de la cara sirve de apoyo para reconstruir la posición 3D de la misma usando uno de los dos algoritmos evaluados, bien sea POSIT o Levenberg-Marquardt, siendo el primero más rápido, y LM más preciso. Además, un proceso RANSAC permite detectar puntos incorrectos o outliers, y descartarlos para la estimación de la pose. Gracias a la unión de todos los métodos mencionados, se consigue un sistema de seguimiento que funciona en el rango completo de rotación de la cara, y que mejora los resultados del estado del arte. A la estimación de la pose de la cara se añade una estimación de la dirección de la mirada y del punto de focalización de la misma. Estos datos aportan gran información sobre el comportamiento del conductor y su grado de distracción. En el desarrollo de la tesis se evalúan y comparan las distintas técnicas mencionadas, usando para ello una extensa colección de vı́deos. El algoritmo de estimación de la mirada propuesto en esta tesis se valida mediante un conjunto de experimentos de conducción en un simulador realista, definidos por un equipo de psicólogos. Se han simulado cambios climatológicos, maniobras y distracciones debidas a IVIS. Las pruebas han sido realizadas por conductores profesionales. Los resultados estadı́sticos obtenidos sobre la fijación de la mirada muestran cómo la utilización de IVIS influye en el comportamiento de los conductores, incrementando sus tiempos de reacción y afectando a la fijación de su mirada sobre la carretera y sus alrededores..
(7) Abstract Recent studies have identified inattention (including distraction and drowsiness) as the main cause of accidents, being responsible of at least 25% of them. Driving distraction has been less studied, since it is more diverse and exhibits a higher risk factor than fatigue. In addition, it is present over half of the inattention involved crashes. The increased presence of In Vehicle Information Systems (IVIS) adds to the potential distraction risk and modifies driving behaviour, and thus research on this issue is of vital importance. Many researchers have been working on different approaches to deal with distraction during driving. Among them, Computer Vision is one of the most common, because it allows for a cost-effective and non-invasive driver monitoring and sensing. Using Computer Vision techniques it is possible to evaluate some facial movements that characterise the state of attention of a driver. This thesis presents methods to estimate the face pose and gaze direction of a person in real-time, using a stereo camera as a basic for assessing driver distractions. The methods are completely automatic and user-independent. A set of features in the face are identified at initialisation, and used to create a sparse 3D model of the face. These features are tracked from frame to frame, and the model is augmented to cover parts of the face that may have been occluded before. The algorithm is designed to work in a naturalistic driving simulator, which presents challenging low light conditions. We evaluate several techniques to detect features on the face that can be matched between cameras and tracked with success. Well-known methods such as SURF do not return good results, due to the lack of salient points in the face, as well as the low illumination of the images. We introduce a novel multisize technique, based on Harris corner detector and patch correlation. This technique benefits from the better performance of small patches under rotations and illumination changes, and the more robust correlation of the bigger patches under motion blur. The head rotates in a range of ±90◦ in the yaw angle, and the appearance of the features change noticeably. To deal with these changes, we implement a new re-registering technique that captures new textures of the features as the face rotates. These new textures are incorporated to the model, which mixes the views of both cameras. The captures are taken at regular angle intervals for rotations in yaw, so that each texture is only used in a range of ±7.5◦ around the capture angle. Rotations in pitch and roll are handled using affine patch warping. The 3D model created at initialisation can only take features in the frontal part of the face, and some of these may occlude during rotations. The accuracy and robustness of the face tracking depends on the number of visible points, so new points are added to the 3D model when new parts of the face are visible from both cameras. Bundle adjustment is used to reduce the accumulated drift of the 3D reconstruction. We estimate the pose from the position of the features in the images and the 3D model using POSIT or Levenberg-Marquardt. A RANSAC process detects incorrectly tracked vii.
(8) viii. points, which are not considered for pose estimation. POSIT is faster, while LM obtains more accurate results. Using the model extension and the re-registering technique, we can accurately estimate the pose in the full head rotation range, with error levels that improve the state of the art. A coarse eye direction is composed with the face pose estimation to obtain the gaze and driver’s fixation area, parameter which gives much information about the distraction pattern of the driver. The resulting gaze estimation algorithm proposed in this thesis has been tested on a set of driving experiments directed by a team of psychologists in a naturalistic driving simulator. This simulator mimics conditions present in real driving, including weather changes, manoeuvring and distractions due to IVIS. Professional drivers participated in the tests. The driver’s fixation statistics obtained with the proposed system show how the utilisation of IVIS influences the distraction pattern of the drivers, increasing reaction times and affecting the fixation of attention on the road and the surroundings..
(9) Contents Contents. 1. List of Figures. 5. List of Tables. 7. Notation. 9. 1 Introduction 1.1 Motivation . . . . . . . . . . . . . . . . . . . . . . . . . 1.2 Distraction effects on driving behavioural performance 1.2.1 Driver’s visual behaviour . . . . . . . . . . . . . 1.2.2 Driver’s physiological responses . . . . . . . . . 1.2.3 Driving performance . . . . . . . . . . . . . . . 1.3 Driver distraction monitoring system approaches . . . . 1.3.1 Driver biological measures . . . . . . . . . . . . 1.3.2 Driving performance measures . . . . . . . . . . 1.3.3 Driver visual measures . . . . . . . . . . . . . . 1.3.4 Hybrid measurements . . . . . . . . . . . . . . . 1.4 General objectives of this thesis . . . . . . . . . . . . . 1.5 System requirements . . . . . . . . . . . . . . . . . . . 1.6 Document structure . . . . . . . . . . . . . . . . . . . .. . . . . . . . . . . . . .. . . . . . . . . . . . . .. . . . . . . . . . . . . .. . . . . . . . . . . . . .. . . . . . . . . . . . . .. . . . . . . . . . . . . .. . . . . . . . . . . . . .. . . . . . . . . . . . . .. . . . . . . . . . . . . .. . . . . . . . . . . . . .. . . . . . . . . . . . . .. 11 11 12 12 13 13 14 14 14 15 17 20 21 22. 2 State of the Art 2.1 Face pose estimation methods . . . . 2.1.1 Appearance template methods 2.1.2 Detector arrays . . . . . . . . 2.1.3 Nonlinear regression methods 2.1.4 Manifold embedding methods 2.1.5 Flexible models . . . . . . . . 2.1.6 Geometric methods . . . . . . 2.1.7 Tracking methods . . . . . . . 2.1.8 Hybrid methods . . . . . . . . 2.2 Existing video databases . . . . . . . 2.3 Discussion . . . . . . . . . . . . . . . 2.4 Aim of the thesis . . . . . . . . . . .. . . . . . . . . . . . .. . . . . . . . . . . . .. . . . . . . . . . . . .. . . . . . . . . . . . .. . . . . . . . . . . . .. . . . . . . . . . . . .. . . . . . . . . . . . .. . . . . . . . . . . . .. . . . . . . . . . . . .. . . . . . . . . . . . .. . . . . . . . . . . . .. 23 24 25 25 26 27 28 29 30 32 32 34 38. . . . . . . . . . . . .. . . . . . . . . . . . .. . . . . . . . . . . . .. . . . . . . . . . . . .. . . . . . . . . . . . .. . . . . . . . . . . . .. . . . . . . . . . . . .. . . . . . . . . . . . .. . . . . . . . . . . . .. . . . . . . . . . . . .. 3 Face Pose Estimation Architecture 39 3.1 General architecture . . . . . . . . . . . . . . . . . . . . . . . . . . . . . . 39 1.
(10) 2. CONTENTS. 4 Automatic 3D Face Model Creation 4.1 Initial Features detection and stereo matching . . . . . 4.1.1 Features extraction and matching methods . . . 4.1.2 Multisize matching proposal . . . . . . . . . . . 4.2 3D Face Model . . . . . . . . . . . . . . . . . . . . . . 4.2.1 Cylinder model fitting and feature self-occlusion 4.2.2 Model formation . . . . . . . . . . . . . . . . . 4.3 Conclusions . . . . . . . . . . . . . . . . . . . . . . . .. . . . . . . .. . . . . . . .. . . . . . . .. . . . . . . .. . . . . . . .. . . . . . . .. . . . . . . .. . . . . . . .. . . . . . . .. . . . . . . .. . . . . . . .. 45 46 47 54 55 56 58 59. 5 Face Pose Estimation with Model Corrections 5.1 Feature Tracking . . . . . . . . . . . . . . . . . . . . 5.1.1 Warping of feature points projections . . . . . 5.2 Feature re-registering . . . . . . . . . . . . . . . . . . 5.3 Pose Estimation . . . . . . . . . . . . . . . . . . . . . 5.3.1 POSIT . . . . . . . . . . . . . . . . . . . . . . 5.3.2 Levenberg-Marquardt algorithm . . . . . . . . 5.3.3 RANSAC . . . . . . . . . . . . . . . . . . . . 5.4 Model extension and correction . . . . . . . . . . . . 5.4.1 Model extension with new feature points . . . 5.4.2 Model correction based on bundle adjustment 5.5 Conclusions . . . . . . . . . . . . . . . . . . . . . . .. . . . . . . . . . . .. . . . . . . . . . . .. . . . . . . . . . . .. . . . . . . . . . . .. . . . . . . . . . . .. . . . . . . . . . . .. . . . . . . . . . . .. . . . . . . . . . . .. . . . . . . . . . . .. . . . . . . . . . . .. . . . . . . . . . . .. 61 62 63 66 71 71 72 73 74 74 75 76. . . . . . . . .. . . . . . . . .. 79 80 82 83 83 85 86 87 88. 7 Tests and Results of the Driver Distraction Monitoring Application 7.1 Hardware and software description . . . . . . . . . . . . . . . . . . . . . 7.2 Ground-truth . . . . . . . . . . . . . . . . . . . . . . . . . . . . . . . . . 7.3 Performance evaluation . . . . . . . . . . . . . . . . . . . . . . . . . . . . 7.3.1 Model creation error evaluation . . . . . . . . . . . . . . . . . . . 7.3.2 Feature tracking error evaluation . . . . . . . . . . . . . . . . . . 7.3.3 Pose estimation error evaluation . . . . . . . . . . . . . . . . . . . 7.4 3D Face pose estimation results . . . . . . . . . . . . . . . . . . . . . . . 7.4.1 Performance analysis for different patch sizes . . . . . . . . . . . . 7.4.2 Performance analysis for different patch matching techniques . . . 7.4.3 Performance analysis for different feature detectors . . . . . . . . 7.4.4 Performance of the pose estimation with model correction . . . . 7.5 Distraction analysis using gaze estimation . . . . . . . . . . . . . . . . . 7.5.1 Experimental environment . . . . . . . . . . . . . . . . . . . . . . 7.5.2 Gaze estimation performance evaluation . . . . . . . . . . . . . . 7.5.3 Gaze estimation results . . . . . . . . . . . . . . . . . . . . . . . . 7.6 Conclusions . . . . . . . . . . . . . . . . . . . . . . . . . . . . . . . . . .. . . . . . . . . . . . . . . . .. 89 89 90 91 91 91 92 93 94 95 98 100 103 103 108 108 113. 6 3D Gaze Estimation 6.1 Eye direction estimation . . . . . . . . 6.1.1 Initial eye features location . . 6.1.2 Eye tracking . . . . . . . . . . . 6.1.3 Pupil centre localisation . . . . 6.1.4 Pupil displacement . . . . . . . 6.1.5 3D Gaze vector . . . . . . . . . 6.1.6 Gaze fixation and classification 6.2 Conclusions . . . . . . . . . . . . . . .. . . . . . . . .. . . . . . . . .. . . . . . . . .. . . . . . . . .. . . . . . . . .. . . . . . . . .. . . . . . . . .. . . . . . . . .. . . . . . . . . . . . . . . . . . . .. . . . . . . . .. . . . . . . . .. . . . . . . . .. . . . . . . . .. . . . . . . . .. . . . . . . . .. . . . . . . . .. . . . . . . . .. . . . . . . . ..
(11) CONTENTS. 3. 8 Conclusions and Future works 115 8.1 Main Contributions . . . . . . . . . . . . . . . . . . . . . . . . . . . . . . . 116 8.2 Future work . . . . . . . . . . . . . . . . . . . . . . . . . . . . . . . . . . . 117 Bibliography. 119.
(12)
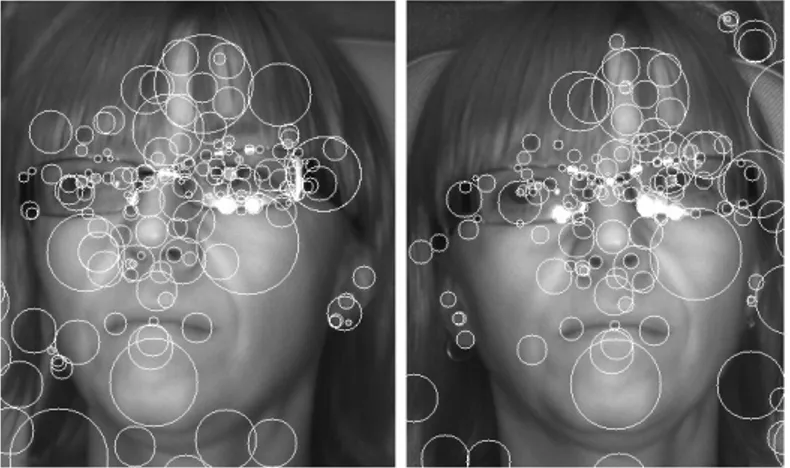
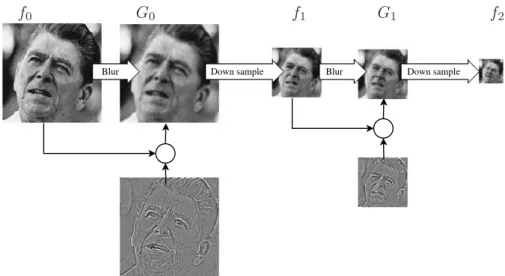
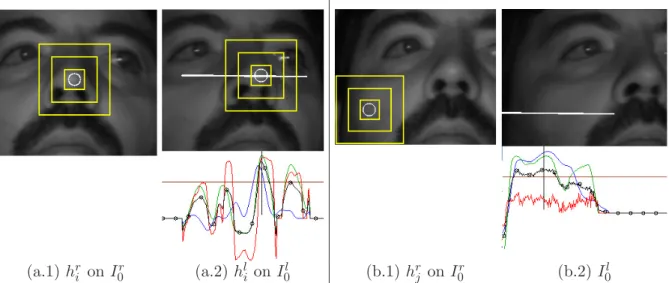
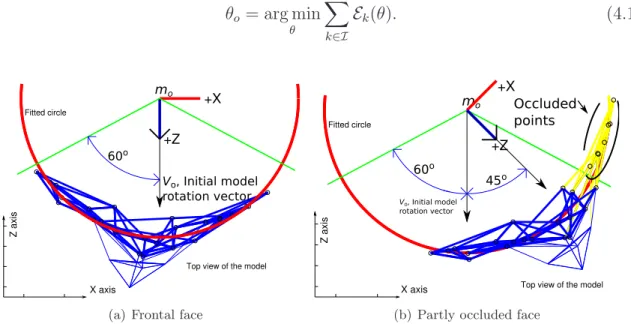
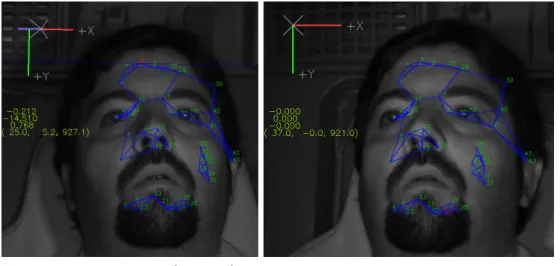
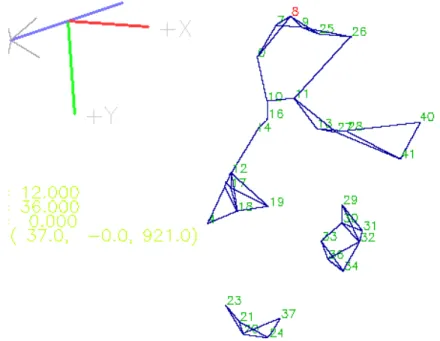
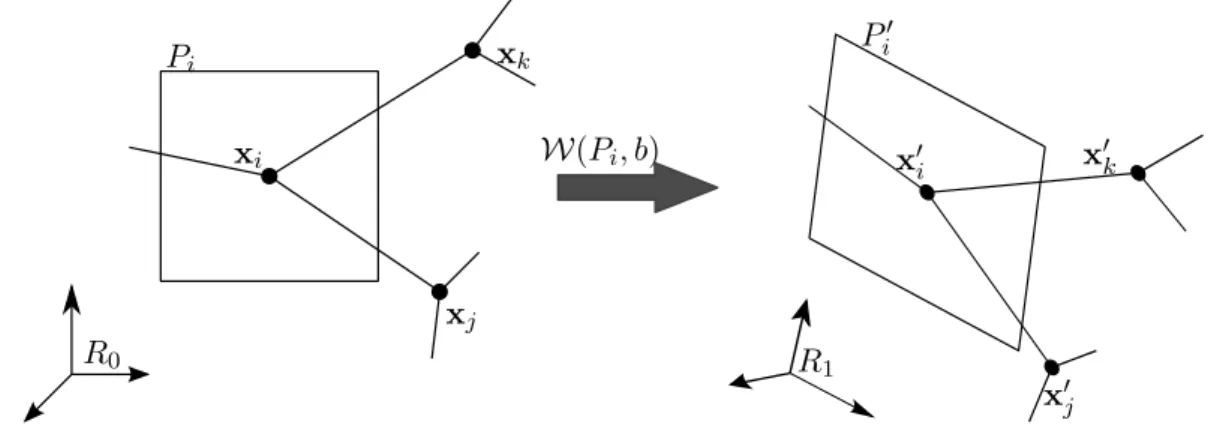
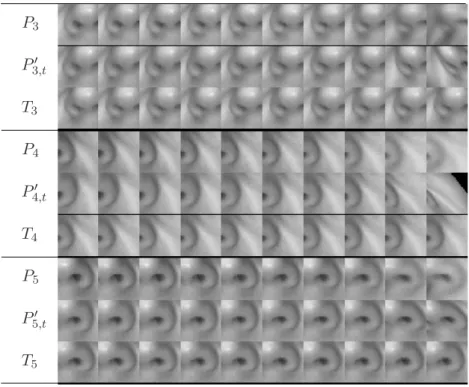
(13) List of Figures 1.1. Driver’s gaze system integration in a vehicle . . . . . . . . . . . . . . . . . 19. 2.1 2.2 2.3 2.4 2.5 2.6 2.7 2.8. Head rotation angles . . . . . . . . . . . . . . . . . . . . . . . Face texture mapped to 3D cylinder . . . . . . . . . . . . . . . Example of a Detector array classifier for face pose estimation Example of a Nonliear regression for face pose estimation . . . Example of a Embedded system for face pose estimation . . . Example of a Flexible model for face pose estimation . . . . . Example of a Geometric approach for face pose estimation . . Example of a Tracking system for face pose estimation . . . .. 3.1 3.2. Main blocks of the face pose estimation algorithm. . . . . . . . . . . . . . . 40 General architecture of the face pose estimation algorithm. . . . . . . . . . 42. 4.1 4.2 4.3 4.4 4.5 4.6 4.7 4.8 4.9 4.10 4.11 4.12 4.13 4.14 4.15. General layout of the model creation process . . . . . . . . . . . . . . . Viola & Jones face detection boxes . . . . . . . . . . . . . . . . . . . . SURF detected interest points . . . . . . . . . . . . . . . . . . . . . . . Stereo correspondences of face features obtained using SURF . . . . . . Harris interest points . . . . . . . . . . . . . . . . . . . . . . . . . . . . Example of Gaussian pyramid image resizing . . . . . . . . . . . . . . . Multiscale images of a driver’s face and detected features at each scale Graphs of the detection rate using SURF and template correlation . . . Graphs of false alarms using SURF and template correlation . . . . . . Examples of Multisize patch correlation . . . . . . . . . . . . . . . . . . Graphs of the detection rate using multiscale and multisize . . . . . . . Circle fitted to the face to get the limit angles . . . . . . . . . . . . . . Graph of feature appearance similarity for different face rotations . . . Projection of 3D face model points over the face images . . . . . . . . . 3D face model . . . . . . . . . . . . . . . . . . . . . . . . . . . . . . . .. . . . . . . . . . . . . . . .. . . . . . . . . . . . . . . .. 45 46 49 49 50 51 51 53 53 55 56 57 58 59 60. 5.1 5.2 5.3 5.4 5.5 5.6 5.7 5.8 5.9. Schematic flow chart of the face tracking and pose estimation algorithm Warping classes . . . . . . . . . . . . . . . . . . . . . . . . . . . . . . . Feature warping process . . . . . . . . . . . . . . . . . . . . . . . . . . Graph of localisation error for various template warping alternatives . . Warping for some face features under different small rotation angles . . Warping for other face features under different small rotation angles . . Graph of feature localisation error using one and two cameras . . . . . Re-registering process when the face is rotating to its left . . . . . . . . Graph of correlation result of a patch applying the re-registering . . . .. . . . . . . . . .. . . . . . . . . .. 61 64 65 66 67 67 68 70 71. 5. . . . . . . . .. . . . . . . . .. . . . . . . . .. . . . . . . . .. . . . . . . . .. . . . . . . . .. . . . . . . . .. 24 26 26 27 28 29 29 31.
(14) 6. LIST OF FIGURES. 5.10 5.11 5.12 5.13. Geometric approach to pose estimation using LM. . . Graph of pose estimation error using POSIT and LM Bundle adjustment corrections to the 3D face model . Graphs of pose estimation error using BA . . . . . .. . . . .. . . . .. . . . .. . . . .. . . . .. . . . .. . . . .. . . . .. . . . .. . . . .. . . . .. . . . .. 72 74 76 76. 6.1 6.2 6.3 6.4 6.5 6.6 6.7 6.8 6.9 6.10. Difference between gaze and face pose . . . . . . . . . . . . . . . . . Gaze with fixation at different locations . . . . . . . . . . . . . . . . Main blocks of the gaze estimation algorithm. . . . . . . . . . . . . Eye features positions obtained using the STASM algorithm . . . . Eye images preprocessing steps for gaze estimation . . . . . . . . . Pupil centre localisation using integral projections . . . . . . . . . . Different samples of aspect-ratio of the eye opening . . . . . . . . . Eye displacement transformation across pose . . . . . . . . . . . . . Effect of the different ocular radio r to the eye direction estimation View of the set of key fixation areas . . . . . . . . . . . . . . . . . .. . . . . . . . . . .. . . . . . . . . . .. . . . . . . . . . .. . . . . . . . . . .. 81 81 82 82 83 84 85 86 86 88. 7.1 7.2 7.3 7.4 7.5 7.6 7.7 7.8 7.9 7.10 7.11 7.12 7.13 7.14 7.15 7.16 7.17 7.18 7.19 7.20 7.21 7.22. Track simulator used to record the video sequences . . . . . . . . . . . . Ground-truth methods . . . . . . . . . . . . . . . . . . . . . . . . . . . . Pose correction to compare different poses with face view-point . . . . . . Graphic of feature localisation error for different patch sizes . . . . . . . Feature views under small rotations, using patch size of 91 pixels . . . . . Comparison of feature localisation using patch size of 61 or 91 pixels . . . Graphic of multisize matching error along rotation . . . . . . . . . . . . . Comparison of matching results using patch warping. . . . . . . . . . . . Comparison of tracking errors for different feature detectors . . . . . . . Graph of error and execution times for multiscale and multisize matching Graphics of pose estimation improvement with BA, using POSIT and LM Face pose estimation results . . . . . . . . . . . . . . . . . . . . . . . . . Examples and graphs of pose estimation . . . . . . . . . . . . . . . . . . Sequence depicting illumination changes, occlusions and talking . . . . . Naturalistic truck cabin simulator . . . . . . . . . . . . . . . . . . . . . . Host and visual area setup . . . . . . . . . . . . . . . . . . . . . . . . . . Exercise B.2 . . . . . . . . . . . . . . . . . . . . . . . . . . . . . . . . . . Gaze and focusing estimation error . . . . . . . . . . . . . . . . . . . . . Driver’s gaze estimation and fixation areas classification during driving . Graphic Exercise D2 gaze estimation and screen-shots . . . . . . . . . . . Other graphic of exercise D2 gaze estimation and screen-shots . . . . . . PRC statistics . . . . . . . . . . . . . . . . . . . . . . . . . . . . . . . . .. . . . . . . . . . . . . . . . . . . . . . .. 90 90 93 95 96 96 97 98 99 99 100 102 102 103 104 105 107 109 109 111 112 114.
(15) List of Tables 2.1 2.2. Comparison of related face pose estimation works . . . . . . . . . . . . . . 35 Comparison of related face pose estimation works, continuation . . . . . . 36. 7.1 7.2 7.3 7.4 7.5. Table of mean face pose estimation error . . . . . . . . . . . Face pose estimation error comparison with other approaches Exercises setup . . . . . . . . . . . . . . . . . . . . . . . . . Test configuration . . . . . . . . . . . . . . . . . . . . . . . . Driver behaviour and reaction time statistics . . . . . . . . .. 7. . . . . .. . . . . .. . . . . .. . . . . .. . . . . .. . . . . .. . . . . .. . . . . .. 101 101 106 107 113.
(16)
(17) Notation Face pose Xi = (xi , yi , zi ) N0 N (M) Xi = (xi , yi , zi ) M= {X(M) }i=1...N i P {R, T } R′ {r,l} It {r,l} I0 xri,t = (uri , vir ) xli,t = (uli , vil ) T(r) Ti Ci = {T(j) i }j=0,1,... Pi′ r Pi,t l Pi,t hri = (uri , vir ) hli = (uli , vil ) n′ Pikr = P (hri , sk ) l ri,k (u, v) l ri (u, v) ssearch. : : : : : :. Coordinates in R3 of the 3D feature point i, in word coordinates Initial number of points 3D points in the face model Number of points 3D points in the face model after any extension. : : : : : : : : : : : : : : : : :. Right/Left camera images, at frame t. Coordinates in R3 of the 3D face model feature point i in object coordinates 3D face model and set of 3D points which from the model, in object coordinates (Vx , Vy , Vz , Tx , Ty , Tz ) 6 DoF parametric pose vector of the face, composed of the rotation vector V and translation T : Rotation and translation matrices, representing the 3D face model pose : 3 × 3 corrected Rotation matrix to diminish the translation effect Right/left camera images at model creation, frame t = 0 (R2 ) Projection on I r of the 3D face model point Xi (R2 ) Projection on I l of the 3D face model point Xi Template descriptor of feature i on image I r , or texture for patch correlation Model stored texture of feature i Cluster of model stored textures for feature i Warped patch Pi → Pi1 Patch in the right camera image Itr Patch in the right camera image Itl Coordinates in R2 of a feature candidate i on I0r Coordinates in R2 of a feature candidate i on I0l Number of feature candidates in the face model Patch template around projection point hri on I r and size sk = skx × sky Correlation results on I l after correlating patches of size sk = skx × sky l Matching result on I l , by composing all the ri,k (u, v) 2 (xsearch × ysearch ) ∈ R . Search area for a feature within the image. Gaze ~g Tg G= {Tg , ~g } ~e ~eof f. : : : : :. Unitary gaze vector Point of origin of the gaze vector Gaze estimation (Origin and direction) Eyes direction in model coordinate frame system Offset to eyes’ centre with respect to the model’s centre mo , in model coordinate frame. 9.
(18)
(19) Chapter 1. Introduction 1.1. Motivation. Since Computer Vision beginnings, one of first challenges that researches have been trying to solve is the Interactive human-machine interfacing. Face pose and the focus of attention include a lot of information on human non-verbal language. People have the innate ability to detect the orientation of a human head, and easily capture the significant and nonverbal communication contained in these movements. Providing a robot with such ability has been and still is an intensive field of study. The face pose gives a lot of information in a communication process, on one hand in the intended movements, such as focusing attention on a area or looking at someone, and in the other hand in the unintended movement, such as face down while talking to other person. For a robot to be able to naturally interact to a person, it first needs to be able to estimate her face pose and her gaze. Gaze estimation can provide a user-machine interface with higher and better user experience, since communication will no be limited to manual interaction. Another important field for the face pose estimation systems is the automotive industry. Since its early start, manufacturers have always dedicated plenty of resources to innovation, leading to many advances in the automotive technology. Better and more efficient engines, reduced production cost and more comfort lead to an important increase in the number of vehicles circulating. This situation has increased demands for safety and manufacturers are now focusing more and more on vehicle safety. Driving inattention is a major factor to traffic crashes. In the EU-27, 42,854 people died in 2007 in traffic accidents [UN-ECE 07], and 44,400 people lost their lives in 2006 [Mahieu 09]. That year, over 1.25 million accidents took place and more than 1.5 million people were injured [SafetyNet 08]. Inattention has been found to be involved in some form in 80% of crashes and 65% of the near crashes within 3 seconds of the event [Dingus 06]. In an effort to reduce these figures, the European Commission set up in 2003 the European Road Safety Action Programme (2003-2010) [EC 03], which aims to halve the number of victims in road accidents by 2010. On the other hand, the National Highway Traffic Safety Administration (NHTSA) estimates that approximately 25% of police-reported crashes involve some form of driving inattention [Ranney 01]. The study of American Automobile Association Foundation for Traffic Safety (AAA FTS) showed the driving attention status has five categories: attentive, distraction, cognitive distraction (looking without seeing), fatigue and unknown [Ranney 01]. In this thesis, we will focus on the distraction category. Driving distraction is defined by the AAA FTS as occurring “when a driver is delayed in the recognition of information needed to safely accomplish the driving task because 11.
(20) 12. Introduction. some event, activity, object or person within or outside the vehicle compelled or tended to induce the driver’s shifting attention away from the driving task” [Young 07]. Thirteen types of potentially distracting activities are listed in [Stutts 01]: eating or drinking, outside person, object or event, talking or listening on cellular phone, dialling cellular phone, using in-vehicle-technologies, etc. Since the distracting activities take many forms, NHTSA classifies distraction into 4 categories from the view of the driver’s functionality: visual distraction, cognitive distraction, auditory distraction (e.g., responding to a ringing cell phone), and biomechanical distraction (e.g., manually adjusting the radio volume) [Ranney 01]. Many distracting activities can involve more than one of these components (e.g., talking to a phone while driving creates a biomechanical, auditory and cognitive distraction). Driving distraction is more diverse and implies a more risky factor that fatigue and it is present in over half of inattention involved crashes, resulting in as many as 5000 fatalities and $40 billion in damages each year [Stutts 01]. Increasing use of invehicle information systems (IVIS) such as cell phones, GPS navigation systems, DVDs and satellite radios and other on-board devices has exacerbated the problem by introducing additional sources of distraction [Ranney 08]. Enabling drivers to benefit from IVIS without diminishing safety is an important challenge. The purpose of a Driver Inattention Monitoring Application (DIMA) is to monitor the attention status of the driver. If driver inattention is detected, different countermeasures should be taken to maintain driving safety, depending on the types and levels of inattention. DIMA has been an active research field for decades. A large amount of scientific work has been done in this field, and various methods have been proposed. Some auto companies have already installed some simple function driver fatigue monitoring systems in their high-end vehicles. Yet, there is still a great need to develop a more reliable and fully functional DIMA, using cost efficient methods for a real driving context. It is believed that the development of signal processing and computer vision techniques will attract more attention to the study of this field in the coming years. With the intention of benefiting those interested in this field, this thesis gives a comprehensive review of the state of the knowledge on driver distraction. It thus provides a clear view of the previous achievements and the issues that still need to be considered.. 1.2. Distraction effects on driving behavioural performance. Performing a cognitively demanding task while driving would influence the driver’s visual and physiological behaviour and the driving performance. 1.2.1. Driver’s visual behaviour. With an increase in the cognitive demand, many drivers change their inspection patterns on the forward view. [Angell 06] indicated that the eye-glance pattern could be used to discriminate driving while performing a secondary task from driving alone, and could be used to discriminate high- from low-workload secondary tasks. More facts associated with cognitive distraction driving can be found in [Harbluk 07] - [Rantanen 99]: drivers narrowed their inspection of the outward view and spent more time looking directly ahead. They reduced their inspection of the instruments and mirrors, and reduced their glances at traffic signals and the area around an intersection. [Rantanen 99] found that the visual field shrank by 7.8% during a moderate-workload counting task and by 13.6% during a cognitively demanding counting task. Drivers had fewer saccades per unit time, which was consistent with a reduction in glance frequency and less exploration of the driving.
(21) 1.2. Distraction effects on driving behavioural performance. 13. environment, and in some cases drivers shed these tasks completely and did not inspect these areas at all [Harbluk 02]. [Hayhoe 04] showed links between eye movement (fixation, saccade, and smooth pursuit), cognitive workload, and distraction. Fixations occur when an observer’s eyes are nearly stationary. Saccades are very fast movements that occur when visual attention shifts from one location to another. Smooth pursuits occur when an observer tracks a moving object such as a passing vehicle. Saccade distance decreases as task complexity increases, which indicates that saccades may be a valuable index of mental workload [Greef 09]. In contrast, the amount of head movement increased when cognitive loads were imposed. It is believed to be a compensatory action by which a driver attempts to obtain a wider field of view [Miyaji 09]. Miyaji proposed that the standard deviations of eye movement and head movement could be suitable for detecting the states of cognitive distraction in subjects. Both cognitive and visual distractions caused gaze concentration and slow saccades when drivers looked at the roadway, and cognitive distraction increased blink frequency [Liang 10]. Liang and Lee found in their work that visual distraction resulted in frequent, long off-road glances. A report from the Safety Vehicle Using Adaptive Interface Technology (SAVEIT) program showed that eyes-off-road glance duration, head-off-road glance time, and Standard Deviation of Lane Position (SDLP) are good measures of visual distraction [Zhang 08]. 1.2.2. Driver’s physiological responses. When cognitive loads (conversation or arithmetic) were imposed on subjects, pupil dilation occurred by the acceleration of the sympathetic nerve [Miyaji 09]. The average heart rate also increased by approximately 8 beats per minute. However, the average value of the heart rate (RRI) decreased under the same situation. [Itoh 09] pointed out that performing a cognitively distracting secondary task (e.g., talking, thinking about something, etc.) during driving caused a decrease in the driver’s temperature at the tip of the nose, and this effect was reproducible. It was reported in [Wesley 10] that a considerable and consistent skin temperature increase in the supraorbital region could be observed during cognitive and visual distractions. [Berka 07] found that the electroencephalography (EEG) signal also contained information about the task engagement level and mental workload. 1.2.3. Driving performance. Significant changes were observed in a driver’s vehicle control as a consequence of performing the additional cognitive tasks while driving. [Ranney 08] found that distraction may be associated with lapses in vehicle control, resulting in unintended speed changes or allowing the vehicle to drift outside the lane boundaries. [Zhou 08] found the influences on the lane changing behaviour when a secondary task was being performed, which included a reduction in the frequency of the checking behaviour (check a side mirror or speedometer), a delay in the checking behaviour, and a longer time for the checking behaviour. [Carsten 05] found that the effects of cognitive distraction on driving performance differed considerably from those of visual distraction. Visual distraction affects a driver’s steering ability and lateral vehicle control, while cognitive distraction affects longitudinal vehicle control, particularly car-following. [Liang 10] also found that cognitive distraction made steering less smooth, but improved lane maintenance. According to them, steering neglect and overcompensation are associated with visual distraction, while under-compensation is associated with cognitive distraction. Overall, visual distraction interferes with driving.
(22) 14. Introduction. performance more than cognitive distraction. An apparently anomalous finding is that when secondary task cognitive demands increased, a driver’s lateral control ability was found to improve [Carsten 05]. [Harbluk 07, Harbluk 02] related an increased incidence of hard braking associated with cognitive distraction driving.. 1.3. Driver distraction monitoring system approaches. In the scientific literature there are four main categories according to the measurement signals they used to detect distractions: biological signals, driving signals, driver images and hybrid measures. In this section, the main researches of the four main types of measures will be explored. 1.3.1. Driver biological measures. Biological signals include electroencephalogram (EEG), electrocardiogram (ECG), electrooculogram (EOG), electromyogram (EMG), etc. These signals are collected through electrodes in contact with the skin of the human body and consequently they are intrusive systems [Berka 07, Skinner 07]. Only few works, focusing in cognitive distractions, have been reported in the literature using this kind of approach. Most of them have been analysed in operational environments and not in driving ones. The reason may be that using biological signal to analyse distraction level is too complicated and no obvious pattern can be found. [Berka 07] tried to use EEG data to continuously and unobtrusively monitor the levels of task engagement and mental workload in an operational environment. An inspection on the EEG data using a second-by-second timescale revealed associations between the workload and engagement levels when aligned with specific task events, which provided preliminary evidence that second-by-second classifications reflect parameters of task performance. In [Liu 10], the Kernel Principal Component Analysis (KPCA ) algorithm was employed to extract nonlinear features from the complexity parameters of EEG (approximate entropy (ApEn) and Kolmogorov complexity (Kc)) and improved the generalisation performance of a Hidden Markov Models (HMM). The result showed that both complexity parameters decreased significantly as the mental workload increased, and the classification accuracy reached was about 84%. 1.3.2. Driving performance measures. Vehicle signal reflects driver’s action, then, measuring vehicle signal driver’s state can be characterised in an indirect way. Force on pedals, vehicle velocity changes, steering wheel motion, lateral position or lane changes are normally used in this category. [Farid 06] tried to distinguish between attentive and inattentive driving in car-following situations by analysing the vehicle following distance and steering angle. They built a real time model using Hidden Markov Models with Gaussian Mixtures to infer the intentions of the driver, and this model was able to detect a lane change half a second earlier than conventional approaches. In [Wakita 05], a Gaussian Mixture Model was adopted to identify the driver based on the driving behaviour signals: forces on the pedals and vehicle velocity. [Torkkola 04] adopted the steering wheel position, accelerator pedal position, lane boundaries, and upcoming road curvature to infer driver status. First, the original signals were preprocessed, which yielded a huge set of features. Then, the Random Forest (RF) technique was employed to select the optimal parameters from the derived features. The classifier was also constructed using RF, and the final accuracy reached 80%. In [Ersal 10],.
(23) 1.3. Driver distraction monitoring system approaches. 15. a radial-basis neural-network-based modelling framework was developed to characterise normal driving behaviour. Then, in conjunction with a Support Vector Machine (SVM), it was able to classify normal and distracted driving. Vehicle dynamics and driving performance data such as: vehicle position, velocity, and acceleration, as well as throttle and brake pedal positions were adopted to model normal driving. The average and standard deviations of the residuals (the differences between the actual and model-predicted driver actions) were chosen as the inputs for the SVM. The results showed that the accuracy varied between individuals. The advantage of these approaches is that the signal is meaningful and the signal acquisition is quite easy. This is the reason because the few commercial systems existing nowadays use this technique [Volvo 10, Mercedes-B. 08]. However, they are subject to several limitations such as vehicle type, driver experience, geometric characteristics, condition of the road, etc. Then, these procedures require a considerable amount of time to analyse user behaviours and therefore, they do not work with the so called micro-sleeps -when a drowsy driver falls asleep for a few seconds on a very straight road section without changing the vehicle signals. 1.3.3. Driver visual measures. Approaches based on image processing are effective because of the occurrence of distraction are reflected through the driver’s face appearance and head/eyes activity. Different kinds of cameras and analysis algorithms have been employed in this approach. We group them according to the camera they adopted, including visible spectrum monochrome cameras, IR cameras or stereo cameras. 1. Methods based on visible spectrum camera The simplest hardware setup is a visible spectrum image acquisition system, but the processing algorithm is relatively complicated, because the problem of face and eyes segmentation could not be avoided. In [Rongben 04] skin colour information is used to segment the face region. This is based on computationally expensive initialisations and is not robust to different lighting conditions and different skin colours. In [Brandt 04] face region is detected with a boosted cascade of Haar-like features, and eyes are extracted by assuming they are the darkest regions in the face, then eye blinks are measured by analysing the optical flow of eye region. But it needed 5s for processing a single image. In [Sun 07] face is detected using adaptive boosting, eyes are located using a template matching method, and gaze is estimated by combining Hough transform and gradient direction. Eye activities do not only contain fatigue information but also distraction information. In [Su 06] a simple approach is proposed to detect driving distraction. After facial area is segmented they perform p-tile algorithm and k-means clustering to locate the eyes. There is a fact that different facial orientations correspond to different types of triangle consist of the locations of the two eyes and the centre of the face. They cluster facial orientation into five clusters: frontal, left, right, up, and down. After facial orientation is obtained, a threshold is made to determine if distraction occurs. Besides analysis of eye activities, mouth activities are also analysed in some researches [Rongben 04, Fan 07, Vural 07] to estimate driving inattention level. In [Rongben 04] they use BP ANN to estimate 3 mouth states from lip features: normal, yawning and talk. [Vural 07] uses a Linear Discriminant Analysis (LDA) to classify the mouth into two states: normal and yawning..
(24) 16. Introduction. Facial expressions also indicate the presence of distraction. In [Rongben 04], the authors use Facial Action Coding System (FACS) to code facial expression. They employ machine learning to discover what facial configurations are predictors of distraction. This system claims to be able to predict sleep and crash episodes with 96% accuracy within subjects and above 90% accuracy across subjects. But this system operates at only 6 frames per second on a Mac G5 dual processor with 2.5GHz. A commercial eyetracker is also employed in some research. [Blaschke 09] uses an off-the-shelf eye-tracker to get head pose and eye gaze signal and it models the visual distraction level as a time dependency of the visual focus, with the assumption that the visual distraction level is nonlinear: visual distraction increases with time (the driver looks away from the road scene) but decreases nearly instantaneously (the driver refocuses on the road scene). Based on the pose/eye signals they established their algorithm for visual distraction detection: first, there is a distraction calculation to compute the instantaneous distraction level, second, there is a distraction decisionmaker to determine if the current distraction level represents a potentially distracted driver. 2. Methods based on IR camera Many researches have adopted image acquisition systems based on infrared illumination (IR). The use of IR serves three purposes: firstly, it minimises the impact of different ambient lighting conditions; secondly, it allows producing the bright pupil effect, which makes the eye detection easier; thirdly, since near-infrared is barely visible to the driver, this will minimise any interference with the driver’s driving. Because of bright pupil effect the eye can be detected directly, which eliminates the face segmentation and reduces time cost. In [Ji 02] driver’s distraction is also detected through face pose estimation. There exists a relationship between face orientation and seven pupil parameters: inter-pupil distance, sizes of left and right pupils, intensities of left and right pupils, and ellipse ratios of left and right pupils. They use eigenspace algorithm to map these seven pupil features to face orientation which is quantised into seven angles: -45, -30, -15, 0, 15, 30 and 45 degree. Besides face orientation, they estimate gaze direction based on information of head movement and relative position between pupil and glint. Like face orientation, gaze direction is quantised into nine zones: left, front, right, up, down, upper left, upper right, lower left, and lower right. [Cudalbu 05] uses a similar image acquisition hardware. To estimate the head pose they employ one headband with IR reflective markers, through which they get a 6 DOF head pose with the average error of 0.2 degree. Incorporated with this headband, they use a simplified 3D eyeball model to estimate the gaze orientation with an accuracy varied from 1 degree to 3 degree. [Huang 07] gets the pupil location from a single image: first, getting pupil candidates through Sobel edges, then identifying pupils using SVM with a Gaussian Kernel. In [Jiao 07] a Round Template Two Values Matching algorithm is proposed to locating the bright pupil, which gets an accuracy of 96.4% but consumes 1.01 seconds per frame on a PIII 800MHz computer. Some commercial products measuring driver’s states are already available on the market, such as SmartEye AntiSleep [Zhou 08, Skinner 07] and SeeingMachines DSS [Carsten 05, Liu 10]. Both of them use two IR illuminators to enhance their robustness to lighting condition, and employ only one camera to give 3D information..
(25) 1.3. Driver distraction monitoring system approaches. 17. However, they are focusing on detecting fatigue, not distraction, and they are still limited to some well controlled environments. 3. Methods Based on Stereo Camera Stereo cameras are also employed to estimate driver state. In [Eren 07] two standard web-cameras are employed to make a 3D image acquisition system. They extract face from the disparity map on the assumption that the driver face has smaller depth than background. After face region is extracted they perform embedded HMM to recognise the forehead, eyes, nose, mouth and chin, from which the driving fatigue level can be estimated. The commercial products based on 3D camera technology such as Smart Eye Pro [Skinner 07] and Seeing Machines faceLAB [SeeingMach. 10], can provide measurements of head pose, eyebrow, eye, nose, and mouth. In conclusion, different kinds of cameras and analysis algorithms have been employed in this approach: methods based on visible spectrum camera, methods based on IR camera, and methods based on stereo camera. Some of them are commercial products as: Smart Eye [Zhou 08], Seeing Machines DSS, Smart Eye Pro and Seeing Machines faceLABr . However, these commercial products are still limited to some well controlled environments, so there is still a long way to go estimate driver’s distraction state. On the other hand, most works existing in the literature were designed for visual distraction detection, less for cognitive and none on auditory and biomechanical distraction detection. 1.3.4. Hybrid measurements. Combining driver physical and driving performance measurements could intuitively increase the inattention detection confidence. On the other hand, road scene analysis and observations of the driver’s face would make it possible to estimate what the driver knows, what the driver needs to know, and when the driver should know it. Combining driver gaze information with road scene information offers several potential benefits: context relevant information selection, unnecessary information suppression, and anticipatory information selection. In [Zhou 08], the standard deviations of eye gaze, head orientation, pupil diameter, and average heart rate (RRI) were combined to improve the accuracy of the driver cognitive distraction detection. The eye and head parameters were obtained using faceLAB, while the RRI data came from ECG. In their work two machine learning techniques, SVM and Adaboost, were implemented under the same conditions. The results showed that the classification performance of Adaboost was slightly better than that of SVM, while the recognition time of Adaboost was approximately 1/26 that of the SVM. [Sathyanara. 08] tried to detect distraction by combining motion signals from the leg and head with vehicle signals. The motion signals included the 3-axis acceleration of the right leg and 2-axis orientation of the head. The vehicle signals adopted included vehicle speed, braking, acceleration, and steering angle. Then, a group of features were derived from these signals based on the nature of the signals. Next, these derived features were analysed using LDA to reduce the dimension. Then, a K-Nearest Neighbours classifier was trained and verified. In order to cope with the variability that exists between drivers and manoeuvres [Sathyanara. 10] utilised a Gaussian Mixture Model (GMM)/Universal Background Model (UBM) and likelihood maximisation learning scheme to first identify the driver through an audio signal and then recognise the manoeuvres (right/left turn and lane change) through.
(26) 18. Introduction. CAN-bus signals. Finally, the CAN-bus signals were also used to detect distraction for a particular driver and particular manoeuvre. It was reported that this system could reach an accuracy of 70% for distraction detection. [Doshi 09] fused head orientation detection and a saliency map of the surroundings to determine whether there was a salient object in the driver’s view, which gave an indication of whether a driver’s head turn was motivated by the goal in his mind or some distracting object/event in the environment. It is known that road geometry influences gaze behaviour and this aspect was taken into account by including road geometry as an additional factor when detecting driver distraction in [Weller 09]. They utilised an analysis of variance (ANOVA) and binary logistic regression to analyse and establish a model for distraction detection based on gaze variables and driving data: fixations (number and duration), scan path, standard deviation of gaze location, speed (minimum, maximum, average and percentage change in speed), lateral acceleration (maximum), and longitudinal deceleration (maximum). The results showed that the road geometry does influence the accuracy of distraction detection based on driving data, but gaze behaviour is mainly influenced by distraction, with little or no influence by road geometry. [Liang 07] tried to detect the driver cognitive distraction caused by interacting with IVIS in real time by fusing eye movement and driving performance using an SVM. The measured signals included fixation, saccade, smooth pursuit of eye (calculated from raw gaze vector obtained using faceLAB [Skinner 07]), steering wheel angle, lane position, and steering error. These measurement were summarised over various windows to create instances that became the SVM model inputs. After training, the SVM model could detect driver distraction with an average accuracy of 81.1% (sd = 9.05%). [Lee 07b] utilised the same conditions as [Liang 07] but adopted a Bayesian network to detect cognitive distraction, showing that compared to an SVM model, the Dynamic Bayesian Network produced better accuracy. [Markkula 05] concentrated on processing head/eye and vehicle performance information to estimate both visual and cognitive distractions. The head/eye information derived from stereo cameras included head position, head orientation, gaze orientation, saccade, and blink identification, as well as confidence values. The vehicle performance information included lane position, vehicle speed, etc. Based on the head/eye information, they developed Gaze-World Mapping and Eyes-Off-Road Detection, which could detect momentary visual distraction. Another algorithm, visual time sharing detection, was developed to measure longer term visual distractions. For cognitive distraction, they used 3 indicators to classify the cognitive tasks with an SVM: the standard deviation of gaze angle, standard deviation of head angle, and standard deviation of lane position. However, in the Gaze-World Mapping phase, which mapped gaze and head angles onto actual world targets of visual attention, the road-ahead target was static and determined offline by inspecting the distribution of gaze angles for road-ahead data, and then manually enclosing the distribution in a rectangle. [Tango 09] proposed a method to derive the distraction level from relevant vehicle and environment data using the Adaptive Neuro-Fuzzy Inference System (ANFIS). Rather than a binary “yes” or “no”, they chose Reaction Time as the output to train, validate, and test their ANFIS model. The candidates to be selected as input for the ANFIS included the environment visibility, traffic density, and the standard deviations in speed, steering angle, lateral position, lateral acceleration, and deceleration jerk. After preprocessing, the level of difficulty of operating an IVIS and the standard deviation of steering angle were found to have the highest correlations with the reaction time. Thus, they were selected as the input. However, no accuracy information was provided. [Fletcher 05].
(27) 1.3. Driver distraction monitoring system approaches. 19. utilised faceLAB to obtain information such as eye gaze direction, eye closure, and blink detection, as well as head position information. In this system, upper and lower bounds were placed on the percentage of time the driver spent observing the road ahead, called the Percentage Road Centre (PRC) [Victor 05]. A percentage that was too high (>90%) could indicate a fatigued state (e.g., vacant staring). A percentage that was too low ( <20%) might indicate a distracted state (e.g., tuning radio). Similar to the PRC metric, they analysed driver gaze to detect even shorter periods of driver distraction. They used gaze direction to reset a counter. When the driver looked forward at the road scene, the counter was reset. If the driver’s gaze diverged, the counter began timing. When the gaze had been diverted for more than a specified time period, a warning was given. The time period for the permitted distraction was a function of the vehicle velocity. As the speed increased, the permitted time period would decrease, either as the inverse (reflecting time to impact) or the inverse squared (reflecting the stopping distance). They tried to integrate driver’s gaze information into other driver assist systems to make the system more acceptable and safer. The framework is shown in figure 1.1. They also spent a significant amount of effort on integrating driver gaze information into lane tracking and sign reading systems. The lane tracking system was used to orient the driver gaze information. A strong correlation was found to exist between the eye gaze direction and the curvature of the road during normal driving [Apostolo 02], with low correlation being a potential indicator of inattention. [Fletcher 05] integrated driver visual information with sign detection to implement a Sign Driver Assist System. This system recognised critical signs in the environment. At the same time, the driver monitoring system verified whether the driver looked in the direction of the sing. If it appeared that the driver was aware of the sign, the information could be made available passively to the driver. In contrast, if it appeared that the driver was unaware of the information, it could be highlighted in some way. A driver’s body posture information is potentially related to driver intent, driver affective state, and driver distraction. [Tran 10] explored the role of 3D driver posture dynamics in relation to other contextual information (e.g., head dynamics, facial features, and vehicle dynamics) for driver assistance. It focused on head pose and upper body posture extraction, but no significant results on driver assistance were found.. Figure 1.1: Systems integration with gaze information [Fletcher 05]..
(28) 20. Introduction. 1.4. General objectives of this thesis. From this review of the State of the art we can conclude that in-vehicle and portable information and entertainment technologies are emerging rapidly, making it increasingly difficult to determine the scope of the potential distraction problem. To date, naturalistic scenarios providing incidence data on distracting activities have been small-scale studied. An effort is needed to study distraction problem using naturalistic situations. There are different proposals to detect distractions but, to date, they are focusing in some kind of distractions and they do not solve the problem in a general way. Few works has been reported for distraction detection using Driver Biological Measures. This is because using biological signal to analyse distraction level is too complicated and no obvious pattern can be found. Then, individual patterns vary between individuals. Driver Physical Measures and Driving Performance Measures are the most promising methods in the real driving context, because neither rely on intrusive measurements that might affect the driver. Vehicle signal reflects driver’s action and the driver’s action is the end stage in the driver’s information process. But when the brain’s automation function works the driver could drive the vehicle as normal even inattention distraction occurs, which means when distraction occurs the vehicle signal may not reflect the occurrence. Then, this is a driver dependable approach. On the other hand, many of the researches claimed very high detection accuracies, which are true only for their particular hypothesis of distraction definitions. These definitions usually cover a limited region of the whole distraction definition. On the other hand, since most of the occurrence of distraction can be reflected through the driver’s face appearance and head/face activity, the Driver Physical Measures based on Image Processing are effective to detect distraction level. Different kinds of cameras and analysis algorithms have been employed in this approach, and two main stages exist: the first one is producing 2D/3D space information of the driver’s head/face organs by image processing, the second one is producing fatigue/distraction level by analysing these 2D/3D information. So far the first stage could produce acceptable result, the research on this stage would focus on improving its robustness, speed cost effectiveness, reducing calibration process , etc. There is large room for the research on the second stage. Same to the other approaches, study on driving distraction is far less active than that on fatigue detection. As to distraction detection using Image Processing techniques, mouth activity, gaze activity and facial expression are employed. Mouth activity is employed to detect distraction of using cell-phone, while gaze activity is employed for visual and cognitive distraction detection. Starting 2004, the RobeSafe Research Group1 from the University of Alcalá, has been working on driver’s assistance and safety projects, such as driver drowsiness estimation [Bergasa 06], hazardous conditions [Alcantarilla 08], and driver’s face tracking [Nuevo 09]. In the last of these works, Nuevo exposed a novelty method to robustly track the face of the driver, using monocular vision. However, the algorithm developed by Nuevo only works for narrow face rotation angles. To accomplish a correct study on the distraction sequence and behaviour patterns, it is necessary to accurately track the driver’s face and gaze over wider rotation angles. This can be achieved with the introduction of a stereo vision system. Other previous works in the group [Bergasa 06] showed that activeillumination system could be applied to face tracking and fatigue detection, based on the 1. http://www.robesafe.com/.
(29) 1.5. System requirements. 21. red-eye effect on the drivers’ pupil. During the last decades, the number of works related to face tracking and pose estimation has increased, making of this aim a very active research field now a days [Yang 02a]. However, this is still an open problem. Little publications refer to driver distraction pattern and behaviour during real driving. There are only some few commercial companies offering their products for face pose estimation [SeeingMach. 10, SmartEye 09]. However, no technical information on their algorithms has been published. Only in recent years methods tested in real driving conditions have appeared, with some of them using video sequences that feature drivers in a vehicle. From this, two closely related problems can be considered. First, to develop pose estimation and tracking techniques able to work properly on drivers’ faces in real driving situations, and second, to infer distraction level by analysing gaze estimation. This thesis presents an unobtrusive driver’s distraction system based on image processing approach. Driver’s gaze direction is obtained from a stereo camera and focalisation of the gaze in the scene over the time is analysed in order to estimate driver distraction. Different distraction activities will be inferred in a naturalistic simulator and a study of the incidence of these distracting activities in the driver will be carried out.. 1.5. System requirements. The work of this thesis is focused on generating the necessary tools to estimate drivers’ face pose and gaze on a naturalistic simulator so that some experts in psychology can analyse driver distractions. This goal implies that the result must be an out-of-the-box component, easy to work with. Since it is intended for a simulator, an initial installation and calibration process by qualified personnel is allowed, but after that the system must be easily operated by non technical personnel. Consequently, operation after installation must be fully automatic, without requiring any specific driver calibration. In addition, simulators usually present low light conditions to increase the user immersion feeling. The developed method must work on low light conditions and with a good precision. We propose to use cameras with high sensibility and an external IR light source to obtain good face appearance without annoying the driver. However, it’s well known that IR illumination can produce visual fatigue. To minimise this effect our proposal is to synchronise an active illumination system with capturing using a relatively low level intensity. Finally, the system must be able to operate in presence of wide head turns and must be robust to partial occlusions, different users —with and without glasses— and slight illumination changes. As conclusion, the requisites of the system to be developed are the following: • Two cameras, of visible spectrum with high sensitivity to near-IR, able to provide at least 30 frames per second. • Synchronisation hardware to drive both cameras and IR illumination. • Real-time operation, at the frame rate of the camera. • Automatic operation with any user. • Night-time operation. • Automatic face model generation..
(30) 22. Introduction. • Robust operation in presence of wide head turns and movements. • Robust operation in presence of partial occlusions, either by the driver’s hands or any other external element. • Automatic and fast localisation of the face after tracking losses. • Analysis of the gaze focalisation in the scene. • Distraction inference from the gaze analysis.. 1.6. Document structure. This document is divided in chapters, of which this introduction is the first one. Chapter 2 reviews the State of the art on face pose estimation techniques, as well as 3D reconstruction and tracking methods. Chapter 3 introduces the general architecture of the method proposed in this thesis for face pose estimation. The details of the proposal are explained in chapters 4 and 5, which describe how a 3D face model is created and the methodology to estimate the pose based on that model, respectively. The gaze estimation calculation, as a composing vector of face and eye direction is presented in chapter 6. Chapter 7 explains the testing methodology, the video sequences used for evaluation and ground-truth, and the results obtained by the method for face pose estimation, gaze direction and distraction parameters inference. Finally, chapter 8 contains the conclusions, summarises the main contributions of this work, and presents future research lines that could help to improve performance and results..
(31) Chapter 2. State of the Art Face pose estimation has been a very active researching subject for more than two decades. During this period, the techniques have evolved together with the increasing computational resources of modern computers. Along with this evolution, the objectives of face estimation systems have also became more enterprising. The first proposed works only aimed to detect a few predefined poses, just enough to allow a coarse pose estimation. Those systems would enabled a machine to discriminate the interlocutors of a conversation inside a room with a controlled light environment. Nowadays, as the basic objective of getting a fine pose estimation is being met, new requisites would be desired depending on specific applications. The technique and technology have evolved, but still there is room for improvement. New systems are much more ambitious. Some modern pose estimators have errors as low as 2◦ , but new applications may require the systems to work in real-time, or changing or low light condition, user independently or other similar very challenging requisites. This new challenges must be addressed by more intelligent face pose estimation systems which are yet to come. Often, the pose estimation algorithm is just a necessary previous step for a gaze estimation. It is actually the gaze what gives the real information of the point of attention of a subject. Having an accurate gaze estimation requires a very precise face pose estimation. Automotive industry provides two examples of very challenging scenarios: driver’s behavioural study and driver’s inattention monitoring. The former, requires a very accurate gaze pose estimation, the collection of time statistics, good level of system integration with other IVIS (on-board and off-board applications), and often low light conditions to work inside driving simulators. Inattention monitoring is probably the worst possible lighting scenario. A user can be driving in a sunny morning, late at night, or throw a forest that projects impossible shadows over the driver’s face. In addition, inattention monitoring requires as well requisites such as accuracy and good integration. Added to this, a consumer on-board application would require completely independence of the user, no matter age, gender or raze, no calibration step, and fast initialisation. The work presented in this thesis focused on providing a system for distraction analysis and driver’s behavioural study inside a simulator. To date, it is not possible to find a system which endorses all the mentioned features, and consequently which could be eligible for an on-board distraction monitoring system, which could be commanded by a group of psychologists and other non-technical qualified personal. Providing such a system is the main goal of this thesis. This chapter presents a review of the most notable methods used for face pose estimation during the last two decades. Several authors have published extended surveys of the literature [Murphy-Ch. 09, Hansen 10]. Main referenced works will be presented below. 23.
(32) 24. State of the Art. For a deeper explanation of the face pose estimation techniques we refer the readers to that surveys. The literature concerned with 3D pose estimation of a generic object is very large and a survey is beyond the scope of this thesis. A review of some existing databases is also presented for reference, since many of the works discusses below base their results in any of these databases.. 2.1. Face pose estimation methods. The pose is generally described as a rotation and a translation transformation. This transformation defines the pose with respect to an initially predefined position and orientation of the observer. Many publications refer to that problem as head pose estimation, while many others name it as face pose estimation. More precisely, the term face pose is most commonly used for every technique that involves detection or recognition of a human face, while the term head pose is more typically used when only pose estimation is needed. However, the face and the head pose are joined together in all sense, since it is assumed that the human head can be modelled as a disembodied rigid object. Consequently, both terms, face pose or head pose, are interchangeable for any practical purpose. In this thesis we will use the term of face pose, which actually means the same of head pose. First, it is important to analyse the motion range of a human head in order to know the range that a vision system must cover. Restricting the motion to only the neck, the range of head motion for an average adult encompasses a sagittal flexion and extension (i.e., forward to backward movement of the neck) from -60.42◦ to 69.6◦ , a frontal lateral bending (i.e., right to left bending of the neck) from -40.9◦ to 36.3◦ , and a horizontal axial rotation (i.e., right to left rotation of the head) from -79.8◦ to 75.3◦ [Ferrario 02]. This ranges are represented on figure 2.1. However, the head can also be affected by other rotations, and specially by translations directed from the chest, so the coverage area of the system must be wider. Indeed, different individuals may perform the same movements with peculiar modalities and diverse contributions from dorsal spine and thoracic girdle. The total range of movement that the system must be capable of depends on the user, the application and the environment where the user is being monitored. It is possible to classify the different approaches to face pose estimation attending to many different criteria. But the important aspect to which this State of the art is Ro o 9.6. ll. Pit. -40.9o. ch. +6. +36.3o. -79.8o o .3. Yaw. +75. -60.4o. Figure 2.1: Head rotation angles.
Figure
![Figure 2.3: Detector array classifier for local face detection [Zhang. 07]](https://thumb-us.123doks.com/thumbv2/123dok_es/7309183.352117/34.892.156.707.417.583/figure-detector-array-classifier-local-face-detection-zhang.webp)
+7
Documento similar