Growth and productive dynamism of business services : EU 15, Spain and the Region of Madrid
27
0
0
Texto completo
(2) Growth and productive dynamism of Business Services: EU-15, Spain and the Region of Madrid. WORKING PAPERS The Institute of Social and Economic Análisis (Servilab) edits Working Papers, where are included advances and results of some research projects done as part of the research done by the Institute’s staff and other researchers in collaboration with the Institute. Those Working papers are available in : http://www.servilab.org/iuaes_sp/publicaciones.htm. ISSN:. 1139-6148. LATEST WORKING PAPERS DT-1/04 MODELO DE EVALUACIÓN Y SELECCIÓN DE PROYECTOS. Justo de Jorge Moreno, Antonio García Tabuenca y Carolina Perondi DT-2/04 PAUTAS CÍCLICAS EN EL DESEMPLEO EUROPEO. Raquel Llorente Heras DT-3/04 BURBUJAS E INESTABILIDAD: EL ESTADO DE LA CUESTIÓN. Antonio Torrero Mañas DT-4/04 EL FENÓMENO DE LA INCUBACIÓN DE EMPRESAS Y LOS CEEIS. Andrés Maroto Sánchez y Antonio García Tabuenca DT-5/04 ¿ES EL FENÓMENO DEL TRABAJO FEMENINO POR CUENTA PROPIA UN BUEN INSTRUMENTO DE POLÍTICA LABORAL?. ANÁLISIS DE ALGUNOS INDICIOS. Carlos Iglesias Fernández y Raquel Llorente Heras DT-6/04 TITULARIDAD Y EFICIENCIA: EL CASO DE SEAT. Nuria Fernández Conejero DT-1/05 LA RELEVANCIA CRECIENTE DE LAS BOLSAS EN EL MUNDO. UN NUEVO ESCENARIO. Antonio Torrero Mañas. Institute of Social and Economic Analysis Plaza de la Victoria, 1. 28802. Alcalá de Henares. Madrid - Telf. (34)918895703 Fax (34)91889 8646 Correos electrónicos de contacto: [email protected] Website: www.servilab.org. Institute of Social and Economic Analysis (Servilab) Working Paper 03/2005 , 27 pages, ISSN: 1139-6148. 2.
(3) Growth and productive dynamism of Business Services: EU-15, Spain and the Region of Madrid. CRECIMIENTO Y DINAMISMO DE LOS SERVICIOS A EMPRESAS : EU-15, ESPAÑA Y LA COMUNIDAD DE MADRID RESUMEN: La dinámica del sector servicios a empresas en el conjunto de la Unión Europea (UE-15) está ligada a la extendida práctica actual de externalización de servicios y actividades integrados en los procesos productivos. Con altas de tasas de crecimiento en los últimos años, se ha convertido en uno de los más importantes y dinámicos de la economía de la UE, con una aportación superior al 10% del valor añadido y el empleo. El trabajo se centra en el análisis de la productividad del sector y de sus principales ramas a partir del estudio específico de la Comunidad de Madrid y bajo el telón de fondo de España y la UE-15. Para profundizar en el comportamiento de la productividad, se examinan algunas variables fundamentales como la estructura de costes por ramas y los costes laborales por ocupado, así como la contribución de cada rama y país a la productividad global del sector. Desde la perspectiva de la localización, se observa el fenómeno de la concentración del sector en la capital madrileña frente al resto de la región, pese a que entre 1991 y 2001 aparece una tendencia, todavía débil, hacia la desconcentración regional. Además, el número de establecimientos crece más rápidamente que el de empleados. PALABRAS CLAVE: Servicios a empresas, productividad, localización.. GROWTH AND PRODUCTIVE DYNAMISM OF BUSINESS SERVICES: EU-15, SPAIN AND THE REGION OF MADRID ABSTRACT: The aim of this study is to evaluate the structure and dynamism of Business Services in the Autonomous Region of Madrid together with the Spanish and the European cases. In particular, it focuses on the comparative analysis of productivity and its components, as well as a specific geographical and location study of these services in the Region of Madrid. The sector productivity structure of countries and regions is similar. From this, it may be deduced that productivity units of the different countries, within the same branch, use fairly similar productivity methods and technologies. Maybe the distinguishing factor is the labour cost in terms of added value per employee. The relative size of the different branches rendering Business Services differs among the regions compared. This not only implies differences among the three cases in question, but also more general economic discrepancies, mainly related to the processes of economic organisation. Regarding the location of the services, the city of Madrid takes almost three quarters of Business Services of the whole region. In spite of this spatial concentration, the comparative evaluation of 1991 and 2001 data proves the existence of a trend, still weak, towards the de-concentration of areas, or geographical growth, of Business Services. Also the dynamic analysis has permitted the discovery of another interesting asset: in the majority of the areas, the establishments have increased faster than the number of employees. This indicates that, on average, the size of new establishments has tended to be reduced. KEY-WORDS: Business Services, productivity, localization AUTORES: ANTONIO GARCÍA TABUENCA, Profesor Titular de Economía Aplicada. Universidad de Alcalá. Investigador de Servilab ([email protected]). FERNANDO CORAL POLANCO, Profesor Asociado de Economía Aplicada. Universidad de Alcalá. Colaborador e Investigador de Servilab ([email protected]).. Institute of Social and Economic Analysis (Servilab) Working Paper 03/2005 , 27 pages, ISSN: 1139-6148. 3.
(4) Growth and productive dynamism of Business Services: EU-15, Spain and the Region of Madrid. INDEX. 1. Introduction, previous matters and aim of the research.......5 2. Profile of the business services sector in the EU .................8 3. A comparative analysis on Business Services productivity: Region of Madrid, Spain and European Union....................... 11 4. Location of Business Services in the Region of Madrid. ...... 21 5. Conclusions ............................................................... 25 6. Bibliographical references ............................................. 26. Institute of Social and Economic Analysis (Servilab) Working Paper 03/2005 , 27 pages, ISSN: 1139-6148. 4.
(5) Growth and productive dynamism of Business Services: EU-15, Spain and the Region of Madrid. 1. INTRODUCTION, PREVIOUS MATTERS AND AIM OF THE RESEARCH. T. he expansion and relative weight of specific activities related to business services have continued growing all along the 90s and the beginning of the 21st century, not only regarding economy as a whole, but also the total of services sector in the UE and in each of its member States1. Consequently, this sector has established a position among the most important and dynamic ones of the European economy, with a contribution higher than 10% of added value and employment. In general terms, business services allow to improve the efficiency of business activity by means of the contribution of ‘intermediate inputs’, which simplify internal resources, outsourcing them, and facilitate that the company concentrate on its most productive activity (Turner, 2002). The theoretical purpose of such inputs is the introduction of improvements regarding quality, time spent, design, innovation or promotion of the final goods or services, promoting at the same time the increase of productivity and gaining competitiveness in terms of business costs (Rubalcaba, 1999). When dealing with a research related to this sector, it is worth considering at least three previous matters. Firstly, the heterogeneity of its classification; these activities –due to their relative newness and emergency– still lack an homogeneous and universally-accepted classification. Several authors have suggested their own classifications or supported previous ones with certain reservations. Among the most famous ones, we can mention Browning and Singelmann (1978), Nusbaumer (1984), and Ochel and Werger (1987). For the Spanish case, we can refer to Rubalcaba et al. (1998). However, normally for practical reasons, the classifications of international specialised organisations become established. This is the case of the European Union classification, called NACE, which has become the one used by mostly Statistics Institutes and the majority of researchers. Even so, the frontiers between the activities are vague in many occasions and the criteria suggested by the NACE are not respected exactly in all the community countries. Below, we will see that, in particular, there are 1. The European Commission (2004) highlighted this important role of business services in its Communication to the Council in 1998, where a framework for the strengthening of competitiveness of EU industry was suggested.. Institute of Social and Economic Analysis (Servilab) Working Paper 03/2005 , 27 pages, ISSN: 1139-6148. 5.
(6) Growth and productive dynamism of Business Services: EU-15, Spain and the Region of Madrid. some differences in the composition of activities in the cases of Spain and Madrid, which generate certain problems when making a comparative analysis. Table 1 includes the NACE classification. Secondly, there is an information problem: Despite the improvements undertaken in the last years and the dynamism of the sector, it is still badly covered in terms of statistics. It is often necessary to use approximations, specially when some specific branches are wanted to be analysed or when comparing any countries. The two main sources used within the European framework are the National Accountancy and the information provided by professional private associations to the European Commission, included in the annual publication Panorama of European Union Trade (more recently, Panorama of the European Union). For the first source, Eurostat has started to facilitate recently some disaggregated statistical data, within the statistical data known as Structural Business Statistics, although without the sufficient regularity and common criteria. Also the OECD contributes specific breakdowns for the business services sector in its compilation of National Accountancies. Due to this lack of information, some regional governments are sometimes getting ahead with particularised statistical studies, so that they offer disaggregated and quality data. This is the case of the Region of Madrid, which tackled the creation of specific directories for the registration and analysis of business services activities as from the late 80s. Finally, it is worth mentioning that neither all the activities nor the productive units of this sector show the general behaviour linearly about dynamism and expressed efficiency. Furthermore, there is a trend within this sector, even within the most emerging activities, towards a growing relative importance of their production in nominal terms, while they maintain such production in real values. This would show the increase in prices of such activities, and therefore, the transfer of cost increase to the final prices (Martínez Serrano and Picazo, 2003).. Institute of Social and Economic Analysis (Servilab) Working Paper 03/2005 , 27 pages, ISSN: 1139-6148. 6.
(7) Growth and productive dynamism of Business Services: EU-15, Spain and the Region of Madrid. Table 1 Business services in the NACE (European Classification of Economic Activities) Business services include those technical, professional and operational services generally rendered to companies and administrations –to the family sector to a lower extent– as supporting their productive or organisational processes. Among them, the most important ones are renting and leasing; research and development; legal, tax and business and management consultancy or advise; advertising and market research; engineering services; human resources, cleaning and security services. The group of these activities are included into NACE Divisions 71, 73 and 74. NACE Section K also includes real estate services (Division 70) and computer activities (Division 72). The NACE Sections are the following ones: Section A: Agriculture, hunting and forestry, Section B: Fishing, Section C: Mining and quarrying, Section D: Manufacturing, Section E: Electricity, gas and water supply, Section F: Construction, Section G: Distributive trades, Section H: Hotels and restaurants, Section I: Transport, storage and communication, Section J: Financial intermediation, Section K: Real Estate, renting and business activities, Codes 70: Real estate activities, 71: Renting, 72: Computer-related activities, 73: Research and development, 74: Other business activities, 74.1: Legal, accounting, book-keeping and auditing activities, consultancy, market research, business and management consultancy, 74.2: Architectural and engineering activities, 74.3: Technical testing and analysis, 74.4: Advertising, 74.5: Labour recruitment and provision of personnel, 74.6: Investigation and security activities, 74.7: Industrial cleaning, 74.8: Other business activities n.e.c., Section L: Public administration and defence. Compulsory social security, Section M: Education, Section N: Health and social work, Section O: Other community, social and personal service activities. tax. The aim of this working papers is to evaluate the behaviour of the business services sector in the Region of Madrid (one of the most dynamic metropolitan regions within Europe), together with the Spanish and the European Union cases. In particular, the study focuses on the analysis of productivity, as well as on the aspects having an influence on it, with the purpose of examining the level of efficiency of the economy of Madrid. For this reason, the process to be used will be as follows: After this introduction, data and profile of the sector within the EU will be presented in the second section; in the third section, a comparative. Institute of Social and Economic Analysis (Servilab) Working Paper 03/2005 , 27 pages, ISSN: 1139-6148. 7.
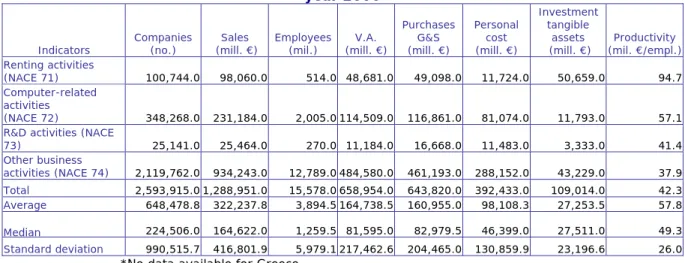
(8) Growth and productive dynamism of Business Services: EU-15, Spain and the Region of Madrid. analysis of the sector productivity in the EU, Spain and the Region of Madrid is carried out; and finally, conclusions are set out.. 2. PROFILE OF THE BUSINESS SERVICES SECTOR IN THE EU. G. reece not being taken into account (there are no data for this Country), in the year 2000, the four activities of the business services sector in the EU-15, i.e., those corresponding to the NACE Divisions 71, 72, 73 and 74 (‘computer activities’ are also included in this section regardless that the EC does not consider them for this purpose), counted on 2,593,915 companies, 15,578,000 employees, generated 658,954 million euros of added value and obtained an apparent average productivity of work that amounted to 42,300 euros per employee. The remuneration of the work factor meant 59.6% of the added value generated and the one corresponding to the gross operating excess (or benefit), to 40.4%. Tables 1 and 2 show this general data. Obviously, these aggregated figures only imply an approach to microeconomic data of the sector. However, differences are substantial among the branches and countries. Firstly, we can observe that the ‘other business activities’–a wide-range branch– registers the highest level of company creation, and in particular, ‘legal, accounting, bookkeeping and auditing activities, tax consultancy, market research, business and management consultancy’ (NACE 74.1) is the most prolific one in business terms, with nearly 900,000 companies and more than 3.3 million employees; it is followed by ‘Architectural and engineering activities; technical testing and analysis’ (NACE 74.2 and 74.3), with more than 560,000 companies and 1.87 million employees; and ‘Computer-related activities’ (NACE 72), with almost 350,000 companies, but with more than two million people employed. On the contrary, R&D activities (NACE 73) only have a few more than 25,000 production units within the group of countries comprising the European Union, and give rise to 270,000 jobs. Leasing and renting activities hold a modest position with a few more than 100,000 companies providing jobs for more than half a million people. However, in terms of productivity, the branch corresponding to renting is the one with the best performance, with 94,700 euros per employee, far from R&D activities (41,400 euros per employee) and mainly from ‘other business activities’ (37,900 euros per employee).. Institute of Social and Economic Analysis (Servilab) Working Paper 03/2005 , 27 pages, ISSN: 1139-6148. 8.
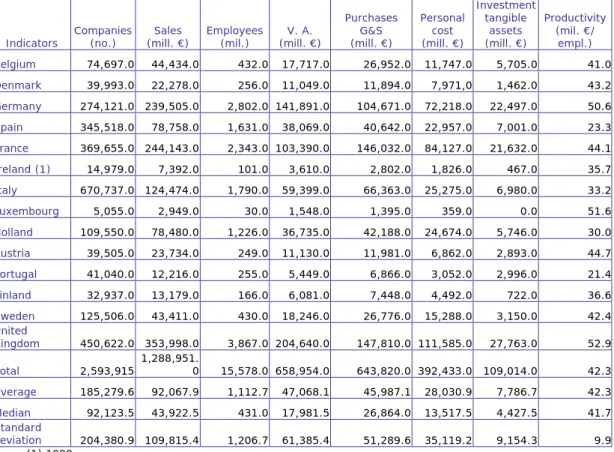
(9) Growth and productive dynamism of Business Services: EU-15, Spain and the Region of Madrid. From the point of view of countries regarding all these four divisions, Italy excels with the highest number of companies, 670,000, followed by the United Kingdom with more than 450,000. The following one is France (about 370,000 companies), then Spain (a few more than 345,000 companies) and Germany (nearly 275,000 companies). In terms of added value, the United Kingdom stands out categorically, providing more than 204,000 million euros, which means almost a third (31%) of the total added value of the sector in the EU; second place is held by Germany, with a contribution of 21.5% over the aggregated total, and France reaches 15.7%. Spanish contribution is reduced to 5.8%. And, in terms of work productivity, the outstanding country is again the United Kingdom, with 52,900 euros per employee in the sector in question, followed very closely by Luxembourg (51,600 euros per employee) and Germany (50,600 euros per employee). Spain and Portugal are down in the list, with 23,300 and 21,400 euros per employee respectively. TABLE NO.1 Volume of business activities (NACE 71, 72, 73 and 74), EU-15* total, year 2000. Indicators Renting activities (NACE 71) Computer-related activities (NACE 72) R&D activities (NACE 73) Other business activities (NACE 74) Total Average. Companies (no.). Sales (mill. €). Employees (mil.). V.A. (mill. €). Purchases G&S (mill. €). Personal cost (mill. €). Investment tangible Productivity assets (mil. €/empl.) (mill. €). 100,744.0. 98,060.0. 514.0 48,681.0. 49,098.0. 11,724.0. 50,659.0. 94.7. 348,268.0. 231,184.0. 2,005.0 114,509.0. 116,861.0. 81,074.0. 11,793.0. 57.1. 25,141.0. 25,464.0. 270.0 11,184.0. 16,668.0. 11,483.0. 3,333.0. 41.4. 2,119,762.0. 934,243.0. 12,789.0 484,580.0. 461,193.0. 288,152.0. 43,229.0. 37.9. 2,593,915.0 1,288,951.0 648,478.8 322,237.8. 15,578.0 658,954.0 3,894.5 164,738.5. 643,820.0 160,955.0. 392,433.0 98,108.3. 109,014.0 27,253.5. 42.3 57.8. Median. 224,506.0. 164,622.0. 1,259.5 81,595.0. 82,979.5. 46,399.0. 27,511.0. 49.3. Standard deviation. 990,515.7. 416,801.9. 5,979.1 217,462.6. 204,465.0. 130,859.9. 23,196.6. 26.0. *No data available for Greece.. Source: Eurostat, Structural Business Statistics. Institute of Social and Economic Analysis (Servilab) Working Paper 03/2005 , 27 pages, ISSN: 1139-6148. 9.
(10) Growth and productive dynamism of Business Services: EU-15, Spain and the Region of Madrid. TABLE NO.2 Volume of business activities (NACE 71, 72, 73 and 74), total per EU15* countries, year 2000. Indicators Belgium Denmark. Companies (no.). Sales (mill. €). 74,697.0. 44,434.0. 39,993.0. 22,278.0. Employees (mil.). V. A. (mill. €). 432.0. 17,717.0. 256.0. Purchases G&S (mill. €) 26,952.0. Personal cost (mill. €) 11,747.0. Investment tangible Productivity assets (mil. €/ (mill. €) empl.) 5,705.0. 41.0. 11,049.0. 11,894.0. 7,971,0. 1,462.0. 43.2. Germany. 274,121.0 239,505.0. 2,802.0 141,891.0. 104,671.0. 72,218.0. 22,497.0. 50.6. Spain. 345,518.0. 1,631.0. 38,069.0. 40,642.0. 22,957.0. 7,001.0. 23.3. France. 369,655.0 244,143.0. 2,343.0 103,390.0. 146,032.0. 84,127.0. 21,632.0. 44.1. Ireland (1) Italy Luxembourg. 14,979.0. 78,758.0. 7,392.0. 101.0. 3,610.0. 2,802.0. 1,826.0. 467.0. 35.7. 670,737.0 124,474.0. 1,790.0. 59,399.0. 66,363.0. 25,275.0. 6,980.0. 33.2. 5,055.0. 2,949.0. 30.0. 1,548.0. 1,395.0. 359.0. 0.0. 51.6. Holland. 109,550.0. 78,480.0. 1,226.0. 36,735.0. 42,188.0. 24,674.0. 5,746.0. 30.0. Austria. 39,505.0. 23,734.0. 249.0. 11,130.0. 11,981.0. 6,862.0. 2,893.0. 44.7. Portugal. 41,040.0. 12,216.0. 255.0. 5,449.0. 6,866.0. 3,052.0. 2,996.0. 21.4. 32,937.0. 13,179.0. 166.0. 6,081.0. 7,448.0. 4,492.0. 722.0. 36.6. 125,506.0. 43,411.0. 430.0. 18,246.0. 26,776.0. 15,288.0. 3,150.0. 42.4. 3,867.0 204,640.0. 147,810.0 111,585.0. 27,763.0. 52.9. 15,578.0 658,954.0. 643,820.0 392,433.0. Finland Sweden United Kingdom Total. 450,622.0 353,998.0 1,288,951. 0 2,593,915. Average. 185,279.6. 109,014.0. 42.3. 92,067.9. 1,112.7. 47,068.1. 45,987.1. 28,030.9. 7,786.7. 42.3. Median 92,123.5 43,922.5 Standard deviation 204,380.9 109,815.4 (1) 1998. 431.0. 17,981.5. 26,864.0. 13,517.5. 4,427.5. 41.7. 1,206.7. 61,385.4. 51,289.6. 35,119.2. 9,154.3. 9.9. *No data available for Greece.. Source: Eurostat, Structural Business Statistics. Institute of Social and Economic Analysis (Servilab) Working Paper 03/2005 , 27 pages, ISSN: 1139-6148. 10.
(11) Growth and productive dynamism of Business Services: EU-15, Spain and the Region of Madrid. 3. A COMPARATIVE ANALYSIS ON BUSINESS SERVICES PRODUCTIVITY: REGION OF MADRID, SPAIN AND EUROPEAN UNION.. T. he Region of Madrid shows remarkable economic dynamism and leadership –and this is especially noticeable within the context of Spanish economy. This feature becomes evident when we compare the apparent productivity standards registered by its Business Services (BS) sector with the rest of Spain. In order to compare BS productivity levels in the Region of Madrid (RM), the European Union and Spain, this study focuses on data from eight activity branches 2 –from which we could obtain the required information for the three geographical areas (EU-15, Spain and RM). This procedure enables an homogeneous comparison. GRAPH NO.1 Business Services productivity. Year 2000. Added Value per employee. Thousand euros. 4 0 .4. 3 4 .5. 2 2 .5. E U -1 5. S p a in. RM. SOURCE: Eurostat, Structural Business Statistics and Statistics Institute of the Region of Madrid.. NOTES: (1) The Business Services sector in this graph includes the following activities: advertising, computer related activities, R&D, economic and legal studies and consultancy, architecture and engineering, labour recruitment and provision of personnel, security and investigation, and industrial cleaning services. (2) The information on ‘economic and legal studies and consultancy’ for EU-15 refers to activity 74.1 of NACE classification shown in table 1.1. As for the RM, it refers to legal consultancy, economic consultancy, and statistics and market studies, which belong to the classification applied by the Statistics Institute of the Region of Madrid. (3) The data shown for the Region of Madrid refer to the year 2001. (4) The EU-15 group does not include Greece, due to the non-availability of data.. 2. See notes (1) and (2) of graph 1.. Institute of Social and Economic Analysis (Servilab) Working Paper 03/2005 , 27 pages, ISSN: 1139-6148. 11.
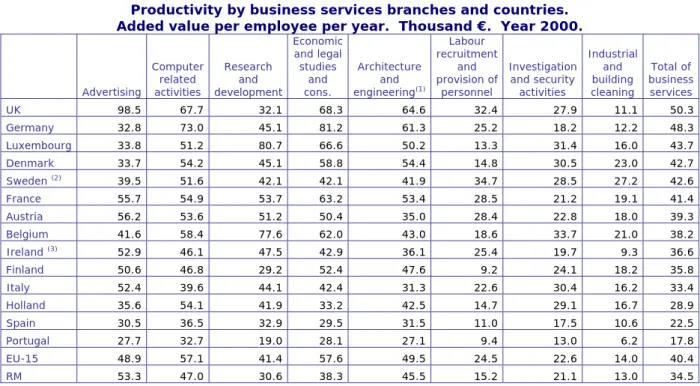
(12) Growth and productive dynamism of Business Services: EU-15, Spain and the Region of Madrid. Graph 1 reveals two aspects. Firstly, BS sector productivity is remarkably higher in the RM than in the whole of Spain. Secondly, the average level of added value generated by Business Services employees for the whole of Spain accounts for nearly half of the European Union (EU-15) average. This emphasizes the different behaviours existing not only among the European regions, but also within the Spanish territory itself. Here we will point out some elements to explain these differences. On the one hand, it is advisable to study the productivity levels registered by the eight Business Services branches considered in the different countries and in the Region of Madrid. This information is given in Table 3. TABLE NO. 3 Productivity by business services branches and countries. Added value per employee per year. Thousand €. Year 2000. Labour Economic recruitment and legal Industrial Computer Research and Investigation studies Architecture and Total of related and provision of and security and and building business Advertising activities development activities cons. engineering(1) personnel cleaning services UK. 98.5. 67.7. 32.1. 68.3. 64.6. 32.4. 27.9. 11.1. 50.3. Germany. 32.8. 73.0. 45.1. 81.2. 61.3. 25.2. 18.2. 12.2. 48.3. Luxembourg. 33.8. 51.2. 80.7. 66.6. 50.2. 13.3. 31.4. 16.0. 43.7. Denmark. 33.7. 54.2. 45.1. 58.8. 54.4. 14.8. 30.5. 23.0. 42.7. 39.5. 51.6. 42.1. 42.1. 41.9. 34.7. 28.5. 27.2. 42.6. France. 55.7. 54.9. 53.7. 63.2. 53.4. 28.5. 21.2. 19.1. 41.4. Austria. 56.2. 53.6. 51.2. 50.4. 35.0. 28.4. 22.8. 18.0. 39.3. Belgium. 41.6. 58.4. 77.6. 62.0. 43.0. 18.6. 33.7. 21.0. 38.2. 52.9. 46.1. 47.5. 42.9. 36.1. 25.4. 19.7. 9.3. 36.6. Finland. 50.6. 46.8. 29.2. 52.4. 47.6. 9.2. 24.1. 18.2. 35.8. Italy. 52.4. 39.6. 44.1. 42.4. 31.3. 22.6. 30.4. 16.2. 33.4. Holland. 35.6. 54.1. 41.9. 33.2. 42.5. 14.7. 29.1. 16.7. 28.9. Spain. 30.5. 36.5. 32.9. 29.5. 31.5. 11.0. 17.5. 10.6. 22.5. Portugal. 27.7. 32.7. 19.0. 28.1. 27.1. 9.4. 13.0. 6.2. 17.8. EU-15. 48.9. 57.1. 41.4. 57.6. 49.5. 24.5. 22.6. 14.0. 40.4. RM. 53.3. 47.0. 30.6. 38.3. 45.5. 15.2. 21.1. 13.0. 34.5. Sweden. Ireland. (2). (3). SOURCE: Eurostat, Structural Business Statistics and Statistics Institute, Treasury Department of the Region of Madrid.. NOTES: (1) Includes ‘technical testing and analysis’, except for the RM; (2) The data on advertising, labour recruitment and provision of personnel, private investigation and security and industrial cleaning refer to 1999; (3) The data refer to 1998.. The countries shown in table 3 are arranged according to their total business services sector productivity level (last column). The United Kingdom heads the list with just over €50,000 of added value per employee. Other countries, such as Germany, Luxembourg, Denmark or. Institute of Social and Economic Analysis (Servilab) Working Paper 03/2005 , 27 pages, ISSN: 1139-6148. 12.
(13) Growth and productive dynamism of Business Services: EU-15, Spain and the Region of Madrid. Sweden also stand out by their high productivity. In the lower positions, and significantly far from the rest of countries, we find Holland, Spain and Portugal. The productivity of Spanish BS, for instance, represents barely 45% of United Kingdom productivity. However, this does not apply to the Region of Madrid. Its productivity, although lower than the EU-15, can be compared to that of countries like Ireland, Finland or Italy. As it can be seen in table 3, productivity varies considerably among the different branches in each country. Generally speaking, there are four activities showing the highest production of added value per employee: advertising, computer related activities, economic and legal studies and consultancy, and architecture and engineering. As a whole, this group of branches offers a wide range of business services, but these can be considered as relatively specialised products. Therefore, their workers have a relatively higher level of qualification. On the other hand, three activities show the lowest productivity indicators in almost all countries and regions studied: labour recruitment and provision of personnel, private investigation and security, and industrial building cleaning. The last three branches offer the simplest operative business services, and also recruitment services –in many cases carried out with elementary procedures or very simple routines. For this reason, we shall not expect high qualification levels among their personnel. At least two featuring aspects can be derived from this diversity in productivity observed within the Business Services sector. First, the wide range of productivity levels which can be found within the companies in the sector3 brings to light the diversity of services –at least regarding the degree of productive specialisation they require. Therefore, business services cannot be approached, by any means, in the same way as an industry – in a more or less strict sense. This makes it particularly hard to set up polices aimed at the sector as a whole. Secondly, the BS sector productivity structures in the countries and regions analysed are similar –in the sense that there is a group of activities which are systematically the most productive ones, and another group which always gathers the less productive ones. Hence, it may be deduced that productivity units located in different countries, and belonging to the same BS branch, apply relatively similar production methods and technologies. Perhaps, the differential factor –referring to added value, in euros, per employee– is the cost of personnel. A way of illustrating the technology. 3. From the average €26,000 difference existing among computing services companies and those of industrial building cleaning in Spain, to the €87,000 among the units working in advertising and industrial building cleaning in England.. Institute of Social and Economic Analysis (Servilab) Working Paper 03/2005 , 27 pages, ISSN: 1139-6148. 13.
(14) Growth and productive dynamism of Business Services: EU-15, Spain and the Region of Madrid. used by a company, or industry, can be obtained through their production costs structure. This information is provided in table 4. As it can be seen in table 4, the proportions represented by the intermediate consumptions and the added value with regard to production (at basic prices) vary in relatively small magnitudes when we look at figures referring to the same branch of business services in the different countries. This would indicate that the BS production generated by the different economies and regions of the European Union follows very similar technological guidelines. For instance, in the EU-15 group, the intermediate consumption and the added value of computer-related activities within the most productive branches represent 51 and 49 per cent of total production, respectively. The same exact proportions apply to the Region of Madrid, whereas production in Spain is equally divided between its two components. The coefficient of variation, shown in the last row of table 4, is an indicator of data variability. The figures of this coefficient for the different branches and components of production can be considered as reasonably reduced: on average, the added value has a variation coefficient of 17.9%, while the intermediate consumptions, excluding the unusual figure of labour recruitment and provision of personnel, reach 18.4%. Table 4 shows another interesting feature of business services. The cost structures of less productive branches –i.e., labour recruitment and provision of personnel, private investigation and security, and industrial and building cleaning– have a common characteristic: the added value is considerably higher than the intermediate consumptions: about three times higher, considering individual data from each country. Whereas in the rest of activities, excluding advertising, the distribution between intermediate consumptions and added value is much more balanced. This feature is coherent to a large extent. Somehow it can be expected that the most productive branches will require not only more qualified labour, but also intermediate inputs –both goods and services– adding a greater degree of technological development. In the case of less productive branches, their production would depend on the reduction of intermediate consumption requirements and a greater exploitation of the low-qualified labour factor. Nevertheless, these production guidelines can only be properly explained by exploring the companies operating within each of the branches. Advertising, a highly productive industry, with a certainly unusual structure, where intermediate consumptions are significantly high, is a good example.. Institute of Social and Economic Analysis (Servilab) Working Paper 03/2005 , 27 pages, ISSN: 1139-6148. 14.
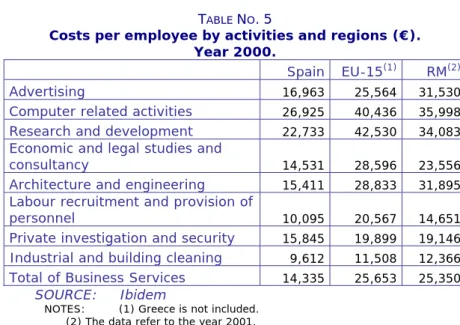
(15) Growth and productive dynamism of Business Services: EU-15, Spain and the Region of Madrid. TABLE NO. 4 Costs structure by BS branches and countries. IC and AV as production percentages. Year 2000. Computer Advertising related activities. Economic Architecture Research and legal and and studies and engineering(1) development consultancy. Labour Security and Industrial recruitment private cleaning and provision investigation of personnel. Total of business services. AV. IC. AV. IC. AV. IC. AV. IC. AV. IC. AV. IC. AV. IC. AV. IC. AV. IC. Belgium. 15. 85. 40. 60. 54. 46. 37. 63. 37. 63. 90. 10. 77. 23. 60. 40. 41. 59. Denmark. 25. 75. 43. 57. 48. 52. 60. 40. 48. 52. 78. 22. 58. 42. 68. 32. 49. 51. Germany. 34. 66. 50. 50. 51. 49. 69. 31. 69. 31. 83. 17. 69. 31. 78. 22. 63. 37. Spain. 20. 80. 50. 50. 47. 53. 62. 38. 48. 52. 88. 12. 78. 22. 82. 18. 50. 50. France. 27. 73. 46. 54. 34. 66. 30. 70. 36. 64. 93. 7. 67. 33. 73. 27. 42. 58. Ireland(1). 23. 77. 68. 32. 46. 54. 70. 30. 49. 51. 53. 47. 78. 22. 77. 23. 60. 40. Italy. 20. 80. 41. 59. 50. 50. 61. 39. 57. 43. 64. 36. 74. 26. 71. 29. 51. 49. Luxembourg. 21. 79. 43. 57. 55. 45. 55. 45. 60. 40. 91. 9. 85. 15. 71. 29. 55. 45. Holland. 28. 72. 52. 48. 42. 58. 62. 38. 48. 52. 42. 58. 75. 25. 69. 31. 50. 50. Austria. 29. 71. 42. 58. 39. 61. 58. 42. 36. 64. 84. 16. 75. 25. 76. 24. 47. 53. Portugal. 13. 87. 38. 62. 36. 64. 48. 52. 39. 61. 73. 27. 83. 17. 73. 27. 41. 59. Finland. 26. 74. 43. 57. 9. 91. 49. 51. 51. 49. 80. 20. 74. 26. 72. 28. 45. 55. Sweden(1). 26. 74. 41. 59. 29. 71. 37. 63. 46. 54. 61. 39. 72. 28. 69. 31. 40. 60. UK. 32. 68. 58. 42. 35. 65. 69. 31. 57. 43. 67. 33. 78. 22. 77. 23. 60. 40. EU-15. 27. 73. 49. 51. 40. 60. 56. 44. 53. 47. 73. 27. 74. 26. 74. 26. 53. 47. RM. 15. 85. 49. 51. 44. 56. 54. 46. 37. 63. 80. 20. 80. 20. 82. 18. 42. 58. V.C. (%). 25.1. 7.8. 27.8. 19.6. 21.7. 26.4. 19.9. 18.2. 19.3. 57.9. 8.5. 25.4. 7.7. 21.0 14.8 14.2. NOTES:. 16.6 14.7. SOURCE: Ibidem.. (1) The same restrictions as in table 3 are applied. (2) V.C. = Variation coefficient. Calculation: (standard deviation)/(arithmetic mean). This coefficient has been obtained with data from the 14 EU countries and the RM.. The differences in productivity must be compensated with labour costs. We shall expect that this will be shown in a reasonably clear way when comparing the indicators relating to the different activities. However, as it has been already said, there are also substantial differences in productivity at regional level –especially when comparing the EU-15 group and the Region of Madrid to the whole of Spain (graph 1)–. Presumably, the latter differences would be explained by the discrepancies in labour costs, rather than as a consequence of technological differences.. Institute of Social and Economic Analysis (Servilab) Working Paper 03/2005 , 27 pages, ISSN: 1139-6148. 15.
(16) Growth and productive dynamism of Business Services: EU-15, Spain and the Region of Madrid TABLE NO. 5 Costs per employee by activities and regions (€). Year 2000. Spain EU-15(1) RM(2) Advertising 16,963 25,564 31,530 Computer related activities 26,925 40,436 35,998 Research and development 22,733 42,530 34,083 Economic and legal studies and consultancy 14,531 28,596 23,556 Architecture and engineering 15,411 28,833 31,895 Labour recruitment and provision of personnel 10,095 20,567 14,651 Private investigation and security 15,845 19,899 19,146 Industrial and building cleaning 9,612 11,508 12,366 Total of Business Services 14,335 25,653 25,350 SOURCE: Ibidem NOTES: (1) Greece is not included. (2) The data refer to the year 2001.. Table 5 compares the costs per employee in the three main areas studied. As expected, there are considerable differences in labour costs between the European Union and the Region of Madrid, and Spain. Besides, the structures of labour costs and productivity at activity level are very similar. Bearing in mind the whole of BS branches, we must stress the similarity of costs per employee in the EU-15 and the Region of Madrid –we could even state that they are equivalent–. If, as we have speculated here, the main differential factor of productivity is the nominal cost of labour, future studies should focus on explaining the factors determining this cost. Another useful approach for the current study is the analysis of the contribution of each branch of business services towards the total sector productivity. This contribution can be explained by two factors: the size of each branch and its individual productivity. So, a highly productive activity with a reduced size, can significantly lose its potential to determine the global productivity of the sector. This kind of analysis allows us to make out which branches have an essential role from the point of view of added value generation –per employee. In order to understand the mechanism of such contribution, we must consider that global productivity can be presented as the weighted sum of the different BS branches productivity. The weighting is given by the relative size of each branch –i.e., depending on the part they take within global employment. As a result, the BS sector productivity can be calculated,. Institute of Social and Economic Analysis (Servilab) Working Paper 03/2005 , 27 pages, ISSN: 1139-6148. 16.
(17) Growth and productive dynamism of Business Services: EU-15, Spain and the Region of Madrid. as it has been mentioned, as the effect of individual productivity rates of the different activities and their own relative sizes.4: L1 P P1 ⎛ = ⋅⎜ L L1 ⎜⎝ L1 + L2 + Λ + Ln. where:. ⎞ P2 ⎛ L2 ⎟⎟ + ⋅ ⎜⎜ L L L + 2 ⎝ 1 2 + Λ + Ln ⎠. ⎞ P ⎟⎟ + Λ + n L n ⎠. ⎛ Ln ⋅ ⎜⎜ L L + 2 + Λ + Ln ⎝ 1. ⎞ ⎟⎟ ⎠. P = global BS production (VAB) L = number of employees in the whole BS sector P/L = global productivity in the BS sector Pi/Li = productivity in the branch i of BS i = 1, 2… n. The results for this exercise are presented in table 6. Only two branches, computer-related activities and economic and legal studies and consultancy, account for about 55% of total sector productivity –both among EU countries and the Region of Madrid. In both cases it is due to the fact that we are dealing with highly productive and relatively big sized activities –in fact, the economic and legal studies and consultancy take 24.3% of BS employment in the EU and 21.2% in the RM, representing the biggest branch of the sector.. 4. This expresion is obtained considering that total productivity results from dividing the sum of individual productivity by the sum of individual employment figures:. P P1 + P2 + Λ + Pn = L L1 + L2 + Λ + Ln. So:. Pn P1 P2 P = + +Λ + L L1 + L2 + Λ + Ln L1 + L2 + Λ + Ln L1 + L2 + Λ + Ln Now, we multiply and divide each of the addends in the right member of the previous expression by the corresponding individual labour figure (Li): P P1 = L L1. ⎛ L1 ⋅ ⎜⎜ ⎝ L1 + L2 + Λ + Ln. ⎞ P2 ⎛ L2 ⎟⎟ + ⋅ ⎜⎜ ⎠ L2 ⎝ L1 + L2 + Λ + Ln. Institute of Social and Economic Analysis (Servilab) Working Paper 03/2005 , 27 pages, ISSN: 1139-6148. 17. ⎞ P ⎟⎟ + Λ + n Ln ⎠. ⎛ Ln ⋅ ⎜⎜ ⎝ L1 + L2 + Λ + Ln. ⎞ ⎟⎟ ⎠.
(18) Growth and productive dynamism of Business Services: EU-15, Spain and the Region of Madrid. TABLE NO. 6 Contribution of each branch to productivity per BS sector employee. Contribution in euros and percentages. Year 2000. Labour Computer Research Architecture recruitment Studies and and Advertising related and and consultancy activities development engineering(1) provision of personnel Contribution in € Belgium 1,672 6,603 975 14,487 4,322 6,730 Denmark 2,615 10,279 972 13,940 8,676 1,659 Germany 2,119 8,159 1,001 20,823 10,205 2,137 Spain 2,358 3,501 353 6,757 4,171 1,906 France 2,781 7,854 748 1,681 5,666 9,167 Ireland(1) 1,867 9,220 0 16,151 5,521 1,793 Italy 1,555 7,325 613 12,474 5,829 1,284 Luxembourg 1,090 6,606 5,206 17,187 6,477 2,574 Holland 1,641 6,139 1,337 8,241 4,333 4,379 Austria 3,528 8,413 689 12,430 6,749 3,821 Portugal 1,378 2,440 0 6,291 2,697 1,684 Finland 2,346 9,918 387 8,328 8,511 1,462 Sweden(1) 3,121 14,763 1,262 10,783 8,563 284 United Kingdom 3,154 11,830 822 17,122 7,368 7,421 EU-15 2,420 8,368 817 14,002 6,762 4,616 RM(2) 4,057 11,398 846 8,104 4,939 1,586 Contribution in % Belgium 4.4 17.3 2.6 37.9 11.3 17.6 Denmark 6.1 24.1 2.3 32.7 20.3 3.9 Germany 4.4 16.9 2.1 43.1 21.1 4.4 Spain 10.5 15.6 1.6 30.1 18.6 8.5 France 6.7 19.0 1.8 28.2 13.7 22.1 Ireland(1) 5.1 25.2 0.0 44.1 15.1 4.9 Italy 4.7 22.0 1.8 37.4 17.5 3.9 Luxembourg 2.5 15.1 11.9 39.3 14.8 5.9 Holland 5.7 21.3 4.6 28.5 15.0 15.2 Austria 9.0 21.4 1.8 31.7 17.2 9.7 Portugal 7.7 13.7 0.0 35.3 15.1 9.5 Finland 6.6 27.7 1.1 23.3 23.8 4.1 Sweden(1) 7.3 34.7 3.0 25.3 20.1 0.7 United Kingdom 6.3 23.5 1.6 34.0 14.6 14.7 UE-15 6.0 20.7 2.0 34.7 16.7 11.4 (2) RM 11.8 33.1 2.5 23.5 14.3 4.6. Private investigation and security. Industrial Total of and Business building Services cleaning. 931 263 793 1,052 1,221 1,391 998 1,013 619 716 1,682 958 1,165. 2,322 4,461 3,051 2,345 2,347 875 3,263 2,581 2,324 2,906 1,511 3,495 2,594. 38,042 42,864 48,289 22,443 41,465 36,818 33,340 42,735 29,014 39,251 17,683 35,405 42,534. 1,200 999 1,452. 1,452 2,407 2,089. 50,370 40,391 34,471. 2.4 0.6 1.6 4.7 2.9 3.8 3.0 2.3 2.1 1.8 9.4 2.7 2.7. 6.1 10.5 6.3 10.4 5.7 2.4 9.8 5.9 8.1 7.4 8.5 9.8 6.1. 100 100 100 100 100 100 100 100 100 100 100 100 100. 2.4 2.5 4.2. 2.9 6.0 6.1. 100 100 100. SOURCE: Ibidem.. NOTES:. (1 The same restrictions as in table 3 are applied. (2) The data refer to the year 2001.. However, the way in which the contribution to global productivity from computer-related activities and economic and legal studies and consultancy is distributed, varies between the EU and the RM. In the first one, the corresponding contributions are of 20.7 and 34.7% respectively, whereas in the latter, they amount to 33.1 and 23.5%. To a large extent, this is the result of the different guidelines used for the distribution of employees. Another important aspect in table 6 is that just over 8 out of 10 euros of added value generated by BS employees. Institute of Social and Economic Analysis (Servilab) Working Paper 03/2005 , 27 pages, ISSN: 1139-6148. 18.
(19) Growth and productive dynamism of Business Services: EU-15, Spain and the Region of Madrid. per year come from only four of the eight branches: economic and legal studies and consultancy (3.5 euros), computer-related activities (2.1), architecture and engineering (1.7) and labour recruitment and provision of personnel (1.1). The same four activities contribute 7.6 out of 10 euros in the Region of Madrid. Labour recruitment and provision of personnel is one of the four branches with the highest contribution in the EU, despite being located within the low productivity group. Nevertheless, it does not take an important position in the RM in this sense. This activity experienced a fast growth during the 90s in the Region of Madrid, but it lost dynamism in the years 2000 and 2001. In general, we can state that there are important differences between the models of contribution to global productivity of BS between the Region of Madrid and the EU. As it has been mentioned, one of the explaining factors is the distribution of employment among the different branches. Table 7 provides this information regarding the EU, the RM and Spain. TABLE NO. 7 Distribution of employees by branches of activity. Percentages. Year 2000. Labour Industrial recruitment and Private and Architecture Studies Research provision of investigation building and and and Computing personnel and security cleaning Advertising activities development consultancy engineering Spain EU15(1) (2). RM. 7.7. 9.6. 1.1. 22.9. 13.2. 17.3. 6.0. 22.1. 4.9. 14.7. 2.0. 24.3. 13.7. 18.8. 4.4. 17.2. 7.6. 24.3. 2.8. 21.2. 10.9. 10.5. 6.9. 16.0. SOURCE: Ibidem. NOTES:. (1) Greece is not included. (2) The data refer to the year 2001.. Table 7 presents an overview of the relative size of each activity in the three geographical areas. Practically, there is only a common criterion between the European Union and the RM: the prominence of economic and legal studies and consultancy activities. Another interesting aspect of the analysis of contributions is the study of country contribution to the BS sector in the whole of the European Union. Table 8 shows the necessary information.. Institute of Social and Economic Analysis (Servilab) Working Paper 03/2005 , 27 pages, ISSN: 1139-6148. 19.
(20) Growth and productive dynamism of Business Services: EU-15, Spain and the Region of Madrid. TABLE NO. 8 Contribution of each country to the EU total productivity. Added value per employee. Contribution in euros and percentages. Year 2000. Employees. Productivity. (thousand) (thousand€/emp.). Size %. Contribution thousand € %. UK. 3,279. 50,3. 24.0. 12,1. 29.9. Germany. 2,523. 48,3. 18.4. 8,9. 22.0. France. 2,083. 41,4. 15.2. 6,3. 15.6. Italy. 1,584. 33,4. 11.6. 3,9. 9.6. Holland. 1,128. 28,9. 8.2. 2,4. 5.9. Spain. 1,397. 22,5. 10.2. 2,3. 5.7. Sweden. 367. 42,6. 2.7. 1,1. 2.8. Belgium. 398. 38,2. 2.9. 1,1. 2.7. Denmark. 232. 42,7. 1.7. 0,7. 1.8. Austria. 223. 39,3. 1.6. 0,6. 1.6. Finland. 151. 35,7. 1.1. 0,4. 1.0. Portugal. 201. 17,8. 1.5. 0,3. 0.6. 85. 36,6. 0.6. 0,2. 0.6. 31. 43,7. 0.2. 0,1. 0.2. 13,682. 40,4. 100.0. 40,4. 100.0. Ireland Luxembourg EU-15. SOURCE: Eurostat, Structural Business Statistics.. In table 8, countries have been arranged according to their contribution. The case of the United Kingdom is certainly remarkable: 3 out of 10 euros of added value per employee generated by the BS sector in the EU come from this country. What is interesting in the previous table is that it allows us to specify the causes of this significant contribution. The United Kingdom is not only the country with highest productivity; it also has the highest relative size (24% of BS employees in the whole of the European Union). Germany and France also present very important contributions to global productivity. Spain comes sixth. It is the penultimate country from the point of view of productivity, but it has a big relative size due to the volume of employees. Graph 2 offers a visual representation of the two factors defining the contribution of each country to global productivity.. Institute of Social and Economic Analysis (Servilab) Working Paper 03/2005 , 27 pages, ISSN: 1139-6148. 20.
(21) Growth and productive dynamism of Business Services: EU-15, Spain and the Region of Madrid GRAPH NO. 2 Factors explaining the contribution of each country to global productivity per BS employee in the EU. Year 2000. 60.0. Productivity (thousand € per employee). L Dk S 40.0. UK. D. 50.0. Irl. F. A B Fin. I NL. 30.0. E 20.0. P. 10.0. 0.0 0.0. 5.0. 10.0. 15.0. 20.0. 25.0. 30.0. dimension (%). SOURCE: Ibidem.. The horizontal line in graph 2 points at the level of productivity per employee for the whole of the EU (40.4 thousand € per employee). The vertical line, however, represents the average participation in employment of the 14 countries (7.1%). Top-right and bottom-left sections represent the areas of higher and lower contribution, respectively. In the other two sections we have located those countries with an intermediate contribution.. 4. LOCATION OF BUSINESS SERVICES IN THE REGION OF MADRID.. T. able 9 shows a first approach of the concentration of business activities in the RM. The three variables considered in the table present a similar distribution model. The city of Madrid absorbs almost two thirds of business activities in the whole of the region. However, within this city, the central and western zones stand out: nearly two thirds of the establishments, employees and gross added value (GAV) correspond to this area. Data included in the table also. Institute of Social and Economic Analysis (Servilab) Working Paper 03/2005 , 27 pages, ISSN: 1139-6148. 21.
(22) Growth and productive dynamism of Business Services: EU-15, Spain and the Region of Madrid. show that the distance to the City of Madrid is a determining factor for the location of business services: for example, while 20% of the regional establishments are located in the four areas surrounding the city – metropolitan north, south, east and west– the rest of areas, i.e. the furthest ones from the metropolitan centre, include only 2%. Distribution of employees and added value present a similar behaviour. TABLE NO. 9 RM: Percentage distribution of the number of establishments, employees and VAB. Year 2001. Cod. 1. Area. Establishments Employees. City of Madrid Central and western Madrid South Madrid Northern and eastern Madrid. GAV. 78.0. 72.8. 75.9. 53.7. 48.5. 51.0. 5.4. 5.7. 5.0. 10.0. 15.3. 16.8. 2. Metropolitan north. 3.4. 5.5. 6.0. 3. Metropolitan east. 4.0. 3.2. 2.5. 4. Metropolitan south. 6.3. 5.3. 3.2. 5. Metropolitan west. 5.8. 2.3. 2.6. 6. Sierra norte. 0.2. 0.0. 0.0. 7. North-eastern region. 0.2. 0.1. 0.1. 8. South-eastern region South-western region. 0.4. 0.1. 0.1. 0.4. 0.2. 0.1. 10. Sierra sur. 0.1. 0.0. 0.0. 11. Sierra central. 1.0. 0.2. 0.2. 9. SOURCE: Statistics Institute of the Region of Madrid. NOTE:. Neither the sum of percentages of the 11 zones equals 100, nor the sum of the 3 zones of Madrid is equivalent to the total of the City due to the fact that there are some data not assigned to any of the zones.. In order to go into the study of concentration into more depth, we will use the location coefficient. This index, with values higher than 0.25, indicates a very high area concentration (Pardos et al, 2004). This measure will be applied to the 13 areas into which the RM has been divided: the 3 areas within the City of Madrid, plus the remaining 10. For its calculation, we will use the variables ‘number of establishments’ and ‘employees’ with the data corresponding to the 13 business services activities. Therefore, it is a spatial-sectorial measure that allows to make a comparative analysis of the concentration level presented by the different branches of Business Services5.. 5. The formula of the location coefficient is as follows:. Institute of Social and Economic Analysis (Servilab) Working Paper 03/2005 , 27 pages, ISSN: 1139-6148. 22.
(23) Growth and productive dynamism of Business Services: EU-15, Spain and the Region of Madrid TABLE NO.10 RM: Coefficient of business services activities location. Year 2001. Activities. Number of Activities Establishments. Industrial cleaning Photography labs and studios Legal consultancy Research and development Computer activities Statistics and market research Investigation and security activities Labour recruitment and provision of personnel Architecture and engineering. Employees. 0.37 Legal consultancy Labour recruitment and 0.20 provision of personnel Photography labs and 0.15 studios. 0.21. 0.15 Industrial cleaning Statistics and market 0.12 research. 0.17. 0.10 Research and development. 0.16. 0.09 Other technical services Investigation and security 0.08 activities. 0.15. 0.08 Economic consultancy. 0.13. 0.19 0.18. 0.16. 0.14. Other technical services. 0.07 Other professional services. 0.12. Other professional services. 0.05 Computer activities. 0.11. Advertising. 0.05 Architecture and engineering. 0.11. Economic consultancy. 0.02 Advertising. 0.07. SOURCE: Statistics Institute of the Region of Madrid and own elaboration. Table 10 shows the activities ordered according to their level of spatial concentration. The location index reflects a great dispersal in the two variables. As regards to the number of establishments, the area concentration is substantial within the activities related to industrial cleaning (0.37) –as they surpass the rate of 0.25 with a wide margin. Also standing out due to their area concentration are the branches ‘photography labs and studios’ (0.20), ‘legal consultancy’ (0.15), and ‘research and development’ (0.15). On the other hand, the less concentrated activities are those in connection with ‘economic consultancy’ (0.02), ‘advertising’ (0.05) and ‘other professional services’ (0.05). In terms of the number of employees, general data reflect higher levels of area concentration of the activities. However, the level of dispersal is lower than in the case of establishments. The branches registering the highest figures of concentration as for the number of employees and establishments are ‘legal consultancy’, ‘photography labs and studios’ and ‘industrial cleaning’ (table 10).. Ls =. 1 k ∑ ( xsj / xs ) − ( x j / x) 2 j =1. Where xsj is the variable on which the index in the activity s is applied. Following this logic, xj equals the total of activities of the variable considered in the area j and x equals the regional total amount (i.e., the RM) of such variable (Pardos et al, 2004).. Institute of Social and Economic Analysis (Servilab) Working Paper 03/2005 , 27 pages, ISSN: 1139-6148. 23.
(24) Growth and productive dynamism of Business Services: EU-15, Spain and the Region of Madrid. As regards to dynamism observed between 1991 and 2001, it is worth mentioning that the lowest absolute increase of the variables ‘number of establishments’ and ‘employees’ corresponds to the City of Madrid, which indicates the existence of a trend, still weak, towards the geographical de-concentration of business services. This favours the location of the activity in the most outlying areas. Figure 3 illustrates the aggregated data of this tendency. FIGURE NO.3 Annual average growth rates of the number of establishments and employees. Region of Madrid: 1991-2001. Percentages. 32.0. 31.6. 25.4 20.7. 20.0. 18.1 15.2 12.8. BUS EMP. City of Madrid. Metropolitan axis. Outlying areas. RM. SOURCE: Statistics Institute of the Region of Madrid.. NOTE: Metropolitan axis: the four areas surrounding the City of Madrid: metropolitan north, south, east and west. Outlying areas: Sierra Norte, North-eastern Region, South-eastern Region, South-western Region, Sierra Sur and Sierra Central.. Figure 3 shows that the establishments have grown faster number of employees. Therefore, spatial de-concentration of services seems to be produced with a particular nuance: establishments created would have a more reduced dimension, say, a lower number of employees per each productive unit.. Institute of Social and Economic Analysis (Servilab) Working Paper 03/2005 , 27 pages, ISSN: 1139-6148. 24. than the business the new that is to.
(25) Growth and productive dynamism of Business Services: EU-15, Spain and the Region of Madrid. 5. CONCLUSIONS. T. his research is about business services, one of the most emerging sectors in advanced economies, particularly in European countries. The study analyses productivity, and compares its behaviour for the year 2000 in three areas: European Union, Spain and the Region of Madrid. The interest aroused by the latter is due to the well-known lead of this metropolitan region within Spain and Europe. The productivity of the sector in Spain represents nearly half of the European average. The indicators reached by the region of Madrid, not reaching the European average, are much higher than the Spanish ones. The sector productivity structure of countries and regions is similar. From this, it may be deduced that productivity units of the different countries, within the same branch, use fairly similar productivity methods and technologies. Maybe the distinguishing factor is the labour cost –in terms of added value per employee.. The most productive branches require more qualified work, which give rise to higher costs per employee. On the other hand, those with a lower productivity are based on low requirements of intermediate inputs and a mass exploitation of the workforce. Three countries are in the lead for their contribution to the global productivity of the EU: United Kingdom, Germany and France. Spain, regardless of its reduced productivity –with a record only above Portugal– is in the sixth position as for this contribution. After analysing the dynamics registered by the business services in the RM between 1991 and 2001, we can confirm a tendency towards the spatial de-concentration of business services production. This implies a transfer –still weak– of the activity towards the most outlying areas of the region. It is also proven that the number of establishments has increased faster than the number of employees. This indicates that the size of establishments has tended to be reduced.. Institute of Social and Economic Analysis (Servilab) Working Paper 03/2005 , 27 pages, ISSN: 1139-6148. 25.
(26) Growth and productive dynamism of Business Services: EU-15, Spain and the Region of Madrid. 6. BIBLIOGRAPHICAL REFERENCES CUADRADO ROURA (J.R.) & RAYMOND (J. L.), 1991, «Consideraciones en torno al crecimiento de los servicios», Economistas, 47, 298-302. CUADRADO ROURA, (J.R.) & RUBALCABA (L.), 2000, «Sector Servicios: Desarrollos Recientes y Futuros Desafios - Los servicios a empresas como actividad estratégica de la economia española», Revista de información comercial española, 747, 53- 68. ELLGER (C.), BRYSON (J.R.) & MONNOYER (M.C.), 1998, Annual Report on the Progress of Research into Service Activities in Europe: Reser Survey, 48-77. EUROPEAN COMMISSION, DG III-INDUSTRY, 1999, The Contribution of Business Services to Industrial Performance, A common Policy Framework, Brussels. EUROPEAN COMMISSION, 2003, European Business. Facts and figures, Panorama of the European Union 2003 Edition, Part 6: Business services, Luxembourg. MARTÍNEZ SERRANO (J. A.) & PICAZO (A. J.), 2003, «Sector servicios», Lecciones de economía española, Madrid, sexta edición, Civitas. MCCONNELL CAMPBELL (R.) & STANLEY (B.), 1995, Contemporary Labor Economics, McGraw-Hill, Fourth Edition. MUÑOZ CIDAD (C.), 2000, Las cuentas de la nación: introducción a la economía aplicada, Madrid, 2ª. Ed., Civitas. PARDOS (E.), RUBIERA MOROLLÓN (F.) & GÓMEZ LOSCOS (A.), 2004, «Localización regional de los servicios empresariales. El caso de Aragón», Universidad de Zaragoza, Mimeo. RUBALCABA (L.) ET AL., 1998, Crecimiento y geografía de los Servicios a Empresas en el contexto de la nueva sociedad servindustrial: el caso de la Comunidad de Madrid, Instituto de Estadística de la Comunidad de Madrid. RUBALCABA (L.), 1999, Business Services in European Industry, Growth, Employment and Competitiveness, European Commission, DG III, Brussels, Luxembourg. SOLOW (R.), 1956, «A Contribution to the Theory of Economic Growth», Quarterly Journal of Economics, February, Vol. 70, 65-94. TURNER (A.), 2002, Just Capital. The Liberal Economy, London, Pan Books.. Institute of Social and Economic Analysis (Servilab) Working Paper 03/2005 , 27 pages, ISSN: 1139-6148. 26.
(27) Growth and productive dynamism of Business Services: EU-15, Spain and the Region of Madrid. THE AUTHORS Antonio García Tabuenca PhD in Economics by the University of Alcalá and B.A. in Law by the University of Deusto. Nowadays is señor lecturer in Applied Economics in the University of Alcalá and subdirector and proyect coordinator in Servilab. Between 1988 and 1996, he was general Subdirector of the Instituto Madrileño de Desarrollo (institute of Development of Madrid), Director of Instituto de la Pequeña y Mediana Empresa Industrial -IMPI- (Institute of Industrial SMEs) , President of the Sociedad Estatal para el Desarrollo del Diseño Industrial (Nacional Society for the Development of Industrial Design) and Vicepresident of the European Association of Economic Development Agencies (EURADA). His main research interests have been financiation and business innovation, focus on SMEs, evaluation of public policies and business development services, entrepreneurship and creation of enterprises.. Fernando Coral Polanco PhD in Economics by the University of Alcalá and Asóciate Lecturer in the same University. He has colaborated in several projects with Servilab, mainly in Lecciones aprendidas en la promoción de mercados de servicios de desarrollo empresarial, un análisis de la experiencia del Banco Interamericano de Desarrollo en el período 1995-2002 (Learned lessons in the market propmotion of business development services, An analysis of the Interamerican Development Bank ‘s experiences for the period 1995-2002) for the Interamerican Development Bank. His main research interest are financiation, economic activity growth and evaluation of public policies.. Institute of Social and Economic Analysis (Servilab) Working Paper 03/2005 , 27 pages, ISSN: 1139-6148. 27.
(28)
Figure
+3


Documento similar
section 3 describes the trigger and event selection; sections 4 and 5 detail the reconstruction and selection of primary vertices and tracks; section 6 explains the characterisation
Concretely, we have explored the detection of malicious HTTP requests (Section 4.1), the identification of spam in SMS messages (Section 4.2), the detection of DGA domains (Section
In the fourth Section we introduce our notion of partial unconditionality and we use some of the combinatorial results from Section 3 and give proofs of several partial
Section 3 details the method used to produce an extinction map of the observed region and to disentangle cloud members from background objects, using the photometric data.. Section
Section 2 develops the methodological proposal and describes the case study: Section 2.1 presents how the analysis was performed for 47 SUMPs carried out in Spain; the
temperature and relative humidity measured at the tran- sition point between the evaporating section and the con- vective section and at the output section, air velocity inside
The next three subsections refer to: (Section 2.1) the spatial area studied, (Section 2.2) the remote sensing data used in the study and (Section 2.3) a justification of why the
This chapter is organised as follows: section 1.1 discusses the importance and the fast and amazing development of surface science and heterogeneous catalysis; section 1.2
