UNIVERSITY OF MILAN'S AUDITORIA: ANALYSIS AND COMPARISON
PACS REFERENCE: 43.55
Beltramini Filippo; Sindoni Elio; Zambon Giovanni
Dipartimento di Scienze dell’Ambiente e del Territorio – Università degli Studi di Milano Bicocca Piazza della Scienza, 1
20126 Milano Italy
Tel: +39 02 6448 2745 Fax: +39 02 6448 2794
Email: filippo.beltramini@unimib.it, elio.sindoni@unimib.it, giovanni.zambon@unimib.it
ABSTRACT
In this paper we present an analysis of the two University of Milan's Auditoria acoustical proprieties and a comparison of the results.
The acoustical parameters involved in the measurements were reverberation time, Early Decay Time (EDT), clarity index C80, definition index D50, Initial time delay gap (ITDG) obtained by analysis of binaural impulse response.
The comparison of the data have pointed out that one of the auditoria is multipurpose, while the second one is best designed for speech only.
The different behavior was explained with consideration on the shape of the hall and on material used in the auditoria.
INTRODUCTION
In 1991 the University of Milan (Unimi) opened a detached site at the Bicocca quarter: the Environmental Science Department. That was the first step toward the birth of the new University of Milano-Bicocca (Unimib).
The style chosen by the designer of this new University reflected the industrial nature already present in the area.
Factories have been restructured to host some Faculties.
The pronounced functional mark of the project caused the Auditorium of Bicocca University to be mainly thought as a conference room. The shape is semicircular and there is a generous use of velvet and sound absorbent materials in the inner of the hall.
The Auditorium showed to be magnificently suitable for this use, but revealed to be inadequate at all for any kind of musical representation, as asserted by performers’ and critics’ opinion after camera music concerts took place.
In order to get round of this limit, the Laboratory for Environmental Acoustics of the University of Milano-Bicocca was engaged to study a solution able to make more equilibrate the acoustical features of the hall.
The first approach to this problem was to look for a hall with similar aim but where the acoustical features were compatible with a multipurpose destination as requested.
The First University of Milan was realized in the ’20. It settles in an ancient convent situated in the center of the city.
The Unimi Auditorium has a slightly sketched trapezoidal shape and it follows the classical scheme with stalls and gallery (Fig. 1, 3).
Assuming the Unimi hall as an optimal reference, we lead a set of measurements in the two halls, looking for a correlation between acoustical parameters and their even different architectonical characteristic and furnishing, in view of eventual improvement interventions.
Fig. 1: Unimi auditorium view Fig. 2: Unimib auditorium view
1 MEASUREMENTS METHOD
The acoustical parameters we decided to calculate in these measurements were Early Decay Time (EDT), Clarity index C80, Definition index D50, Initial time delay gap (ITDG).
These parameters were derived by the study of the impulse response, measured in several point, and obtained by the excitation of the hall with a MLS signal of length 16.
To perform these operations we used a commercial product by 01dB, Symphonie.
All the signals we collected are binaural, and were acquired by a dummy with two microphones set in the inner of the ears.
Through a PCMCIA card and software in bundle, Symphonie may be interfaced to a laptop to handle measurement operations and analyze collected data.
Moreover we calculated RASTI distribution in the two hall, and confronted them with the values of Articulation Index obtained by a spelling test executed with the aid of a professional reader. We got useful information from this comparison, which will be object of further studies.
2 MEASUREMENTS
2.1 Hall Description
The plant of the two halls is deeply different, as we can see, observing the picture reported below with measurement points:
[image:2.596.87.563.184.363.2]
The gallery is deep 12 m and his height is 3 m. The sidewalls are covered with four m. curtains. Over these curtains there is a reflecting zone and, near the roof, sound absorber panels.
On the roof there are wooden reflecting elements. The capacity is 698 seats. The chairs are upholstered.
The auditorium of Unimib, on the contrary, is deep 23 m, large 46 m, and his mean height is 8.4 m.
The walls and the floor are covered with velvet. The capacity is 1000 seat. The chairs are upholstered.
Fig. 3: Plant Unimi and measurement points Fig. 4: Plant Unimi and measurement points
2.2 Measure Presentation
In this section we present the results of our measure for the auditoria:
[image:3.596.145.264.198.391.2]
Table 1: mean values for the halls at 1000 Hz
The following maps show acoustical parameters distribution in the auditoria:
Unimi
The most impressive feature of Unimi hall appears to be the excellent adaptability to any kind of performance. If we analyze the data in the stalls, we can observe that Clarity always lies in the range [–2,2] dB, with a minimum region at the center of the hall. Definition values are distributed between 30 (center) and 50 (front-lateral region).
ITDG assumes values between 15 and 20 ms.
EDT C80 D50 ITDG Unimi stalls 1.31 -0.1 50 18 ms
[image:3.596.370.468.205.387.2] [image:3.596.199.393.507.557.2]To achieve information about intelligibility we performed measure of Articulation Index and we compared them with RASTI. This analysis revealed that even to low values of RASTI corresponds excellent AI in the hall.
Fig. 5: D50 Unimi Fig. 9: C80 Unimi
Fig. 7: EDT Unimi Fig. 8: ITDG Unimi
The gallery doesn’t show any substantial difference
Unimib
The values measured at the Auditorium of University of Milano Bicocca are less exciting.
[image:4.596.85.502.114.522.2] [image:4.596.86.254.135.514.2] [image:4.596.331.498.138.502.2]Fig. 9: D50 Unimib Fig. 10: C80 Unimib
Fig. 11: EDT Unimib Fig. 12: ITDG Unimib
Clarity is always greater than 2 dB, while definition exceeds 50.
ITDG is almost always greater then 30 ms (a too high value for a hall who should be multipurpose) and, as a consequence, the intimacy is very low.
Articulation Index and RASTI assume high value in the seat nearer to podium, but they clearly depend by the distance from it.
In the following plot we show AI/RASTI ratio in the Auditoria:
AI/RASTI Ratio
0.8 0.82 0.84 0.86 0.88 0.9 0.92 0.94 0.96 0.98 1
0.45 0.5 0.55 0.6 0.65 0.7 0.75
RASTI
[image:5.596.103.528.66.331.2]AI
Fig. 13: AI/RASTI Ratio in Auditorium of Unimi (blue) and Unimib (Pink)
3 ANALYSES OF THE MEASUREMENTS
The data presented lead us to a deeply different opinion on the two halls.
[image:5.596.323.532.67.309.2] [image:5.596.116.480.445.661.2]The simplest consideration we can draw is that the acoustic equilibrium is strictly linked to architectonical feature of the halls.
In the Auditorium of the First University of Milan it’s possible to notice that the initial project, already favorable for acoustics in shape and material, has been further optimized through additional studies.
The sidewalls are covered with 4 meters high curtains. Over the curtains there is a reflecting plastered surface, which extends till a region near the roof, where sound-absorber panels were set.
This solution leads the reverberation time to an acceptable value and in addiction it is able to cut excessively delayed reflection, as testified by EDT values.
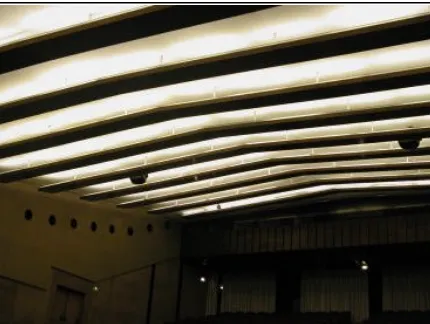
The wooden elements on the roof, as shown in fig. 14, are particularly interesting as they enforce and direct the sound on audience, granting also a good acoustic in the gallery.
A RASTI and Articulation index analysis confirms this hypothesis.
This hall seems to “forgive” the poor valued for RASTI (~0.55): in effect we have observed very good articulation index for all the seats, as shown in fig. 13.
[image:6.596.190.405.322.484.2]This fact may be explained analyzing Clarity and Definition data. The early and late reflection ratio, joined to the low ITDG, suggest that in this hall, the direct sound is enforced in a useful way by early reflections. The harmful effect of very delayed reflections, typical of too reverberant rooms, is therefore negligible.
Fig. 14: particular of wooden reflecting elements in Unimi Auditorium
The situation we found in the Auditorium of University of Milano Bicocca is almost the opposite. Just analyzing the Auditorium plant, we can notice that the absence of real lateral side, due to amphitheatres schema, has the consequence that the only reflections in the hall come from the roof.
The velvet in the furnishing, moreover, strongly reduce sound intensity. Amplification is then required for any kind of performance.
This fact is visible in RASTI distribution, which also gives information on the signal/noise ratio. The decreasing of this parameter may not be evidently due to delayed reflections (which are absent!), but only to the decrease of signal intensity.