Influence of Milling Type on Tef Injera Quality
Yoseph Assefaa,⁎, Shimelis Emirea, Marina Villanuevab, Workineh Abebec, Felicidad Rondab
a Addis Ababa Institute of Technology, School of Chemical Engineering, Food Engineering
Stream, P.O. Box 385, Addis Ababa, Ethiopia
b College of Agricultural and Forestry Engineering, University of Valladolid, Av. Madrid 57,
34004 Palencia, Spain
c Ethiopian Institute of Agricultural Research, P.O. Box 2003, Addis Ababa, Ethiopia
Abstract
Injera is an Ethiopian flat bread that is mostly made from tef flour. Injera making on an
industrial scale holds a significant economic and social interest but requires a thorough study of
how the process variables affect the product quality. The aim of this work was to investigate the
effects of mill type (hammer, disc, and blade) on injera sensory quality and starch digestibility.
The application of software for the determination of injera quality descriptors and its comparison
with visual human eye evaluation was also established. Injera made with disc mill flour had
higher overall acceptability (6.6) than that obtained from hammer mill (4.2) and blade mill (4.1)
flours. The injera made with blade mill flour obtained the lowest rapidly available glucose and
rapidly digestible starch. The outcome of introducing software for the determinations of injera
number of eyes was found effective; its difference with human eye determination was
insignificant.
Keywords: Tef; Milling; Injera quality; Sensory quality evaluation software
1. Introduction
Injera is leavened, flat round Ethiopian traditional bread made from cereals such as tef and
honeycomb-like structure formed due to the production of gas during fermentation and baking.
Injera has a shiny and smooth bottom surface. As stated by the work of Yetneberk et al. (2004),
good injera is expressed as soft and roll-able. A slight sourness is a characteristic taste of injera.
Because injera is leavened bread made from natural gluten-free flour, it has great potential for
commercial production internationally.
Injera prepared from the flour of tef [Eragrostistef (Zucc.) Trotter], a tiny, millet-like grain, is the
most preferred (Yetneberk et al., 2004).Tef is an Ethiopian indigenous tropical cereal crop, and it
has been cultivated for many years in the Ethiopian highlands (Viswanath, 2012). It is the main
staple in the country and is mostly used to make injera. Tef represents 24% of the grain crop area
in Ethiopia and 17.6% of the grain production (Central Statistical Authority, 2015).
The whole tef grain is ground to flour for making injera, local beverage porridges and soup and
unleavened bread (Bultosa and Taylor, 2004).The sizes of the seed are very small, ranging from
0.6–1 mm diameter and 1–1.7 mm long with l000 seed weight averaging 0.3–0.4 g and 150
grains of tef have comparable weight with almost one seed of wheat (Diskstra, 2008).Tef grain
products are nutritionally rich because they are eaten as whole grain with the significantly higher
content of fiber, carbohydrate (USDA, 2007), iron, zinc and calcium than wheat, barley and
sorghum (Abebe et al., 2007). Due to the absence of gluten and gluten-like proteins, tef has
recently been popular globally particularly, as a “healthy food”, making it right for celiac disease
patients (Spaenij-Dekking et al., 2005), and in addition, because of other dietary benefits such as
the slow-release of carbohydrate constituents, it is useful for diabetic patients (Abebe and Ronda,
2014).
Depending on the mechanical forces and temperature during the grinding process, various
particle size and starch damage level(Kadan, Bryant & Miller, 2008).In Ethiopia, mostly disk
millisused to grindtef grain in the homemade injera process. However, other types of mills have
not been checked for their better quality of injera. The effect of milling technique on the sensory
attributes of whole-wheat pan bread was studied by Kihlberg et al. (2004). The result showed
that technique of milling had a greater influence on bread sensory quality and on the slice area
than did the baking technique and farming system. However, techniques of milling on sensory
attributes of tef injera remain lacking.
The number, size, and distribution of holes (commonly called eyes) on the injerasurface
represent one of the most important quality attributes of injera (Yetneberk et al., 2005).
However, determinations of these injera quality descriptors are very difficult due to the nature of
its uncountable eyes, which lead to subjective quality evaluation. Due to this, the injera standard,
which was developed by the Ethiopian standard agency, lacks these quality attributes in
measurable form. Currently, as injera industrialization is emerging, a systematic way of injera
quality determination (injera number of eyes, eye size, and eye distributions) is mandatory for
maintaining uniform quality.
Therefore, the objective of this research was to investigate the effects of three different mill types
(Hammer, Disc, and blade) on injera sensorial quality and starch digestibility and to compare a
software-based evaluation of injera quality descriptors with visual evaluation.
2. Materials and methods 2.1 Materials
Based on its popularity among Ethiopian tef farmers and users, the Qouncho tef variety
Ethiopian Institute of Agricultural Research (EIAR). The tef sample was hermetically stored in a
cool and dry place using polyethylene bag. Before milling, the tef grain was cleaned by sifting.
2.2 Tef milling
Tef grain was milled using three types of mills to obtain the whole flour of the tef sample. The
first one was the Hammer mill (HM) (Perten 120, Finland) with a 0.8 mm sieve fitted inside as
part of the mill, the second mill was the stone-disk mill (DM) (cottage tef grain-milling,
Denmark) and the third mill was the blade mill (BM) (Nutri Bullet NB-101B, China).One kg of
sample was milled by HM and DM for 7 minutes, and five kg of samples were milled by BM for
7 minutes at ambient temperature.
2.3 Injera preparation
The tef injera samples were prepared according to Parker et al. (1989) and Zegeye (1997). An
amount of starter (Ersho) equal to 60 ml was initially added for each kg of flour. Ersho is a small
amount of batter kept from previous dough to start first stage fermentation (Parker et al., 1989).
The tef flour was mixed 2:3 (w/w) with potable water and kneaded by hand in a bowl until
obtaining a homogenous mixture in the traditional way. The dough was allowed to spontaneously
ferment for 60 hours at room temperature (30 5) ºC in an injera baking household in Addis
Ababa, Ethiopia. After this primary fermentation, 10% of the dough was mixed 1:3 (v/v) with
boiling water and heated for 15 min with continuous stirring. The hot cooked dough (absit) was
then mixed back into the fermenting dough, and sufficient potable water was added to make a
batter. The batter was left covered for 2 hours for secondary fermentation. Additional water was
added to thin and form the right consistency of the batter. Finally, half a liter of batter was
poured onto the hot clay griddle in a circular form. After 2-3 min of cooking using traditional
electric injera baking equipment, the injera was removed and placed in a basket.
2.4.1 Proximate analysis
Tef grain was milled using a stone-disc mill and flour proximate composition (Crude protein, fat,
ash, fiber) was determined using AACC methods (AACC, 2000). Total carbohydrate was
determined by difference to 100% (FAO, 2003).
2.4.2 Flour color
Flour color was evaluated according to the methods of Abebe, Collar & Ronda (2015). The
spectrophotometer was used for flour color measurements. CIE L*a*b coordinates were used to
obtain the result by using the D65 standard illuminant and the 2◦standard observer. The hue (h)
and the chroma (C*) were calculated from Eqs. (1) and (2) respectively.
(1)tan 1 * *
a b h
2 (2)1 2 * 2 * *
a b
C
2.4.3 Particle size distribution
According to Sivaramakrishnan, Senge, and Chattopadhyay (2003), the particle size distribution
was evaluated by passing the tef flour through an automatic standard sieve shaker (Retsch,
Germany) that contains 5 sieves. Sieves with the sizes of 710, 500, 250, 125 and 90m were
used. The percentage fraction of the sample retained on each sieve was measured by weighing.
2.4.4 Damaged starch evaluation
The damaged starch level of the tef flour samples was determined according to the AACC
method (AACC, 2012) using a Megazyme starch damage kit (Megazyme International Ireland
Ltd., Co., Wicklow, Ireland). Absorbance was read at 510 nm in a microplate reader from
BIOTEKEPOCH (Izasa, Barcelona, Spain). The damaged starch level of the tef flour was
2.4.5 Scanning electron microscopy (SEM)
Scanning Electron Microscope (SEM) model Quanta 200-F (FEI, Oregon, USA) equipped with
an X-ray detector was used to examine the three tef flours. Samples were directly placed on
stubs, and observations were done by accelerating voltage of 1.5 keV.
2.5. Injera quality analysis
2.5.1 Starch fractions analysis
The method by Englyst, Kingman, and Cummings (1992) was used to measure in vitro starch
digestibility of tef injera with the modifications by Englyst et al.(1999); Englyst et al. (2000).
The hydrolyzed glucose at 20 min (G20) and 120 min (G120) and the total glucose (TG) were
measured by the glucose oxidase colorimetric method. The free sugar glucose (FGS) content was
measured by a separate test according to the procedure proposed by Englyst et al. (2000).
Rapidly digested starch (RDS) = 0.9 * (G20 − FGS), slowly digestible starch (SDS) = 0.9 *
(G120 − G20), resistant starch (RS) = 0.9 * (TG − G120), for total starch, (TS) = 0.9 * (TG −
FGS) and rapidly available glucose of the sample (RAG) = G20 were calculated. As used by
Abebe, Collar, and Ronda (2015), the starch digestibility rate index (SDRI) was computed from
the percentage of RDS in TS in the flours.
2.5.2 Descriptive sensory analysis
The sensory evaluation was conducted by a panel trained according to Einstein (1991). The
selected panelists were tested for their ability to detect basic tastes (Jellinek 1985). The selected
panel comprised 10 people, as recommended by Stone and Sidel (1985). They were females and
males, who were students at Addis Ababa University. Nine injera quality descriptors were used
for evaluation: color, taste, odor, texture (degree of softness), injera number of eyes, eye size, eye
overall acceptability was also evaluated. A score sheet was prepared using the selected
descriptors. Each one of the attribute was evaluated using a 10-point numerical scale (0–9)
anchored on both sides with verbal descriptions (i.e., 0 = unpleasant, 9 = pleasant) to allow the
panel to score the intensity on a framed common scale. Good sensory practices were followed
according to Lawless and Heymann (1999). Injera samples were presented to the panelists on a
tray at ambient temperature (≈25°C) within 3-4 hr after baking. A glass of drinking water was
used for rinsing between samples.
2.5.3 Software based injera quality evaluation
Photos of injera samples were acquired and imported into ImageJ software (version 2)
determining injera number of eyes, eye size, and eye distributions. Injera photos were converted
to gray scale using ImageJ software, and the software converted the image into detectable form
to easily recognize the injera eyes.
2.6 Statistical analysis
Analysis of variance was performed on the data to establish significant (p <0.05) differences
between the samples. All analyses were done in duplicate, and the descriptive categories were
converted to numerical scores. The scores were then subjected to analysis of variance using
SPSS statistical software (Version 16), and the means of duplicate results were compared by
Tukey’s Honestly significant difference test.
3. Results and discussion 3.1. Flour characteristics
3.1.1 Proximate composition
Tef sample has 10.9±1.2% of moisture and 2.13±0.01% of ash content. Baye (2014) presented a
that of the tef sample. The higher ash content of the sample could be due to its higher fiber
content, as tef flour comes from whole grain (Abebe & Ronda 2014). However, the fat
(2.53±0.29%), protein (10.99±0.29%) and carbohydrate (81.35±0.21%) contents of the sample
agreed with those of the report that was compiled by Baye (2014) with 2.5% of fat, 11.0% of
protein and 80% of carbohydrate in dry matter. The higher contribution of bran to the whole tef
grain flour composition could be explained by the smaller size of the tef grain (Bultosa, 2007),
which gives a higher surface area of bran per unit amount of grain, in comparison with whole
wheat. However, the crude protein content of the sample is slightly higher than sorghum (8.3)
and comparable to wheat (11.7).
3.1.2 Flour color
The color coordinates of the tef flours obtained from the three mills are summarized in Table 1.
Although the values of the coordinates show significant differences, the color differences, E,
that resulted were low enough to be appreciated by the human eye (<5), except for the blade mill
flour, which depicted significantly lower lightness than the flours from the two other mills. The
effect of mill type on the color of the tef flours varied significantly; this variation may come
from the difference in milling principles among the three mills. Lightness (L*), hue angle (h*)
and chroma (c*) of samples varied significantly among HM, DM, and BM (Table 1). DMF
(87.7) had significantly higher lightness, which was followed by HMF (85.3) and BMF
(71.0).Such an effect of mill type could probably be related to the degree of breaking and
pulverization of the bran of the tef grains. The hue angle of the three flour varied significantly in
the order BMF (68.9) < HMF (71.4) < DMF (72.7). This seems slightly different from the work
of Abebe et al. (2015) in the case of cyclotech sample mill (L* 83.2, h* 85.3) and disk mill (L*
HMF (17.1) < BMF (18.5). However, the chroma of flour from the disk mill agreed with the
report by Abebe et al. (2015) for cyclotech and disk mill (14.6 and 15.4).
Table 1. Tef flour color
Mill L* a* b* h* c*
HMF 85.3 ± 0.0b 5.45± 0.0b 16.2 ± 0.0b 71.4± 0.04b 17.1 ± 0.0b DMF 87.7± 0.0c 4.50 ± 0.0a 14.5± 0.01a 72.7± 0.03c 15.1 ± 0.0a BMF 71.0± 0.02a 6.68± 0.01c 17.3 ± 0.01c 68.9± 0.04a 18.5± 0.0c
HMF, DMF, and BMF stand for flour from hammer, disk and blade mills, respectively. Data are expressed as the mean ± standard deviations; different superscripts in the same column indicate statistically significant differences (P < 0.05). L*, a*, and b* are CIE coordinates, h = hue, and C* = chroma.
3.1.3 Particle size distribution
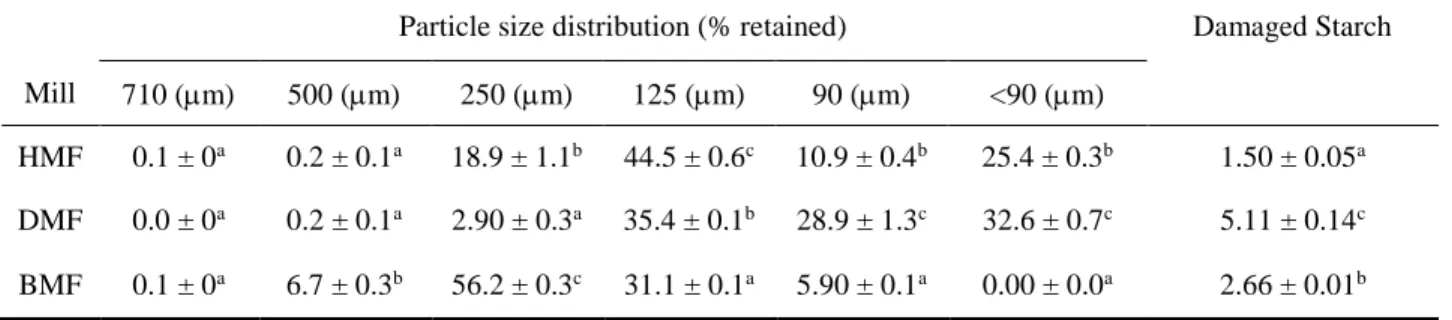
Particle size distributions of the three tef flour (HMF, DMF, and BMF) showed a significant
difference in percent retention at all sieve sizes used, except at 710m (Table 2). In particular, at
500 and 250m sieve, 6.7 and 56.2% of BMF was retained, respectively, which was significantly
higher than that of HMF (0.2 and 18.9%) and DMF (0.2 and 2.9%). However, DMF was retained
significantly in a lower amount than that of HMF on 250m sieve. Flour retention on125m
sieve varied significantly in the order BMF (31.1%) < DMF (35.4%) < HMF (44.5%). For sieve
size (90 and < 90m), flour particles varied significantly in the order BMF (5.9 and 0%) < HMF
(10.9, 25.4) < DMF (28.9, 32.6), respectively. The reason for having different particle size
distributions is perhaps due to the difference in milling procedures among the three mills. The
hammer mill crushed the grain repeatedly until it passed through the sieve that was fitted inside
the mill. Tef grain was ground between two stone-discs in the case of disc mill. The blade mill
had rotary blades to grind the grain.
The damaged starch level of tef flour obtained from the three mills varied significantly in the
order HMF (1.50%) < BMF (2.66%) < DMF (5.11%) (Table 2). The inverse relationship
between flour particle size and damaged starch was noted on DMF: as particle size decreased
(<90m), the damaged starch level increased (5.11%).This agrees with a report by Abebe, Collar
and Ronda (2015). However, due to the difference in milling principle among the three mills
(HM, DM, BM), this relationship was not seen on HMF. The reason for having different starch
damage levels was a result of grinding conditions such as milling force (Nowakowski et al., 1986
and Tran et al., 2011) and temperature and grain moisture content (Li et al., 2014).
Table 2. Particle size distribution and damaged starch level of tef flour
Particle size distribution (% retained) Damaged Starch Mill 710 (m) 500 (m) 250 (m) 125 (m) 90 (m) <90 (m)
HMF 0.1 ± 0a 0.2 ± 0.1a 18.9 ± 1.1b 44.5 ± 0.6c 10.9 ± 0.4b 25.4 ± 0.3b 1.50 ± 0.05a
DMF 0.0 ± 0a 0.2 ± 0.1a 2.90 ± 0.3a 35.4 ± 0.1b 28.9 ± 1.3c 32.6 ± 0.7c 5.11 ± 0.14c
BMF 0.1 ± 0a 6.7 ± 0.3b 56.2 ± 0.3c 31.1 ± 0.1a 5.90 ± 0.1a 0.00 ± 0.0a 2.66 ± 0.01b
HMF, DMF, and BMF stand for flour from hammer mill, flour from disk mill and flour from blade mill, respectively. Data are expressed as the mean ± standard deviations; different superscripts in the same column indicate statistically significant differences (P < 0.05).
3.1.5 Scanning electron microscopy (SEM)
The effects of mill type on tef grain were seen by scanning electron microscope (SEM) (fig. 4.1).
Starch granule pulverizations and the release of individual starch granules were seen on flour
from HM and DM. However, the extent of pulverization on DMF was more as its average
particle size is smaller than that of HMF and BMF. This result agrees with a report by Abebe et
al. (2015).As to the release of individual starch granules on BMF seen less than DMF and HMF,
most effective in releasing individual starch granules than the rotary blades of blade mill. Less
release of individual starch granules was noted during the use of rotary blades compared to the
hammer. According to Jane et al. (2003), the damage, which forms pinholes on granule surface
and channels inside the granules, is probably from the effect of endogenous enzymes hydrolysis
inside the grain.
3.2 Injera characteristics
3.2.1 In vitro starch digestibility
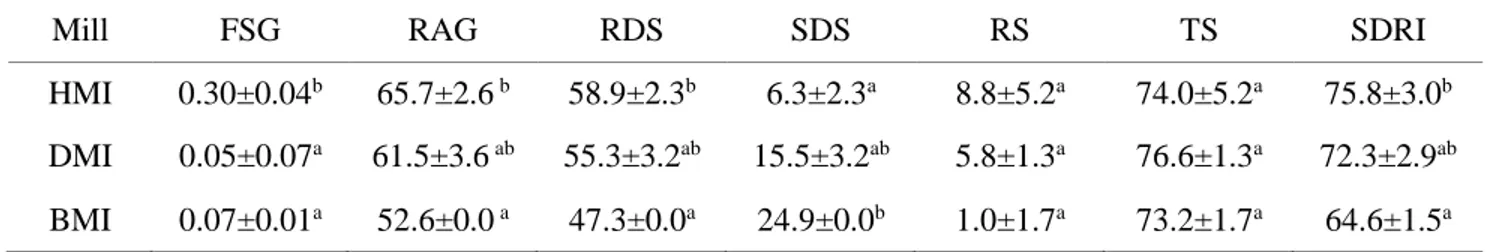
The three tef injeras had similar content of resistant starch (RS) and total starch (TS) (Table
3).The effects of mill type on starch hydrolysis of tef injera were significantly varied; HMI leads
to higher FSG, RAG, and RDS than that of BMI. However, there was no significant difference
in RAG, RDS and SDS content between DMI and HMI except for FSG, and DMI and BMI. Tef
grain milled repeatedly until the flour pass-through the 0.8 mm sieve size that was fitted on the
hammer mill. This difference in milling principle between blade and hammer mill justifies the
results. However, this principle was not reflected on DMI, which had higher damaged starch
with smaller particle size. This agreed with Li et al. (2014), who asserted that cereal flour starch
digestibility is highly influenced by the degree of damaged starch and flour particle size. Due to
starch fragmentation, damaged starch granules have larger relative surface area for enzyme
attack than intact native starch granules. However, it has not yet been proven whether the same
principle applies to the digestibility of gelatinized starch in cooked cereal flour, but the SDS of
BMI (24.9) was significantly higher than that of HMI (6.3). The inverse correlation between
flour particle size and RAG, RDS and SDS were seen on BMI, as its flours (BMF) have a higher
mean particle size lead to the lower content of RAG and RDS, with the higher content of the
al. (2009). It has been understood that the flour starch digestibility is controlled by enzyme
diffusion inside flour particles. However, with similar particle sizes, the rate of starch digestion
was seen to be different between barley and sorghum flours (Mahasukhonthachat et al., 2010)
and between sorghum flours from the hammer and cryogenic mill (Al-Rabadi et al., 2009). As
reported by Ronda et al. (2015) the RAG (82.7) and the RDS (74.3) content of wheat bread was
significantly higher than that of HMI (65.7, 58.9), DMI (61.5, 55.3) and BMI (52.6, 47.3).
According to Miao et al. (2015), the health implication of moderate postprandial glycemic and
insulinemic response due to slowly digestible starch (SDS) implies that foods with a high amount
of SDS may provide wide health advantages by reducing common chronic diseases related to
diet, such as diabetes and pre-diabetes, cardiovascular diseases, and obesity (metabolic
syndromes). The SDRI of BMI (64.6) varied greatly from HMI (75.8). This may be a result of
the difference in particle size of the tef flour; however, the same principle was lacking in
justifying DMI (72.3), which was not significantly different from HMI and BMI.
Table 3. Starch fractions, FSG, RAG, and SDRI, expressed in percentage referring to the dry matter
Mill FSG RAG RDS SDS RS TS SDRI HMI 0.30±0.04b 65.7±2.6 b 58.9±2.3b 6.3±2.3a 8.8±5.2a 74.0±5.2a 75.8±3.0b
DMI 0.05±0.07a 61.5±3.6 ab 55.3±3.2ab 15.5±3.2ab 5.8±1.3a 76.6±1.3a 72.3±2.9ab
BMI 0.07±0.01a 52.6±0.0 a 47.3±0.0a 24.9±0.0b 1.0±1.7a 73.2±1.7a 64.6±1.5a
HM-Flour
HM-Flour
DM-Flour DM-Flour
BM-Flour
BM-Flour
3.2.2 Sensory result
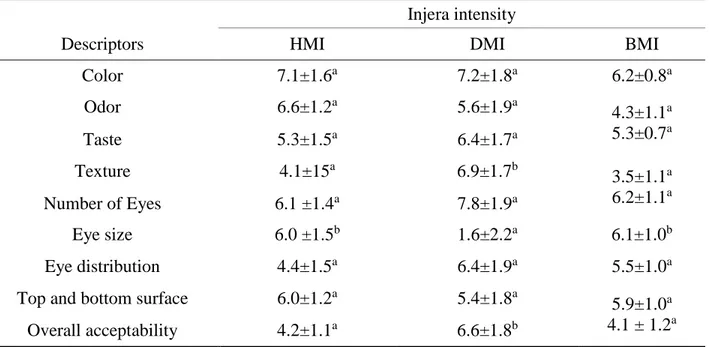
The impacts of mill type (HM, DM, and BM) on sensorial quality of tef injera (HMI, DMI, and
BMI) are presented in table 4. There was no significant difference between HMI, DMI and BMI
in color, odor, taste, number of eyes, eye distribution and the top and the bottom surface of
injera. The three injeras were described as white in color, acceptable in odor, slightly sour in
taste with many eyes and regular eye distribution with a non-sticky and non-powdery top and
bottom surface. However, a significant difference in the intensity of texture (degree of softness),
eye size and overall acceptability werefound.DMI (6.9) had a significantly softer texture than
that of HMI (4.10) and BMI (3.5). However, HMI and BMI had significantly higher scores of
eye size, 6.0 and 6.1 respectively, than DMI (1.6).
Table 4. Sensory panel responses of injera prepared from tef flour using hammer, disc and blade mill.
Injera intensity
Descriptors HMI DMI BMI
Color 7.1±1.6a 7.2±1.8a 6.2±0.8a
Odor 6.6±1.2a 5.6±1.9a 4.3±1.1a
5.3±0.7a
Taste 5.3±1.5a 6.4±1.7a
Texture 4.1±15a 6.9±1.7b
3.5±1.1a 6.2±1.1a
Number of Eyes 6.1 ±1.4a 7.8±1.9a
Eye size 6.0 ±1.5b 1.6±2.2a 6.1±1.0b
Eye distribution 4.4±1.5a 6.4±1.9a 5.5±1.0a
Top and bottom surface 6.0±1.2a 5.4±1.8a 5.9±1.0a
4.1 ± 1.2a
Overall acceptability 4.2±1.1a 6.6±1.8b
The difference in injera texture and eye size may come from the difference in tef flour particle
size and its impact on fermentation (De la Hera et al., 2014). This implies that the fermentation
kinetics may be affected by the flour particle size distribution and level of starch damage. Hence,
the overall acceptability of injera was found to be influenced by the injera texture. There was no
significant difference in the intensity of injera texture, eye size and overall acceptability between
HMI and BMI.
3.2.3 Application of Software in injera quality evaluation
ImageJ software was used for the quantification of the injera number of eyes, eye size and
distribution and compared with human performance on three injeras (HMI, DMI, and BMI)
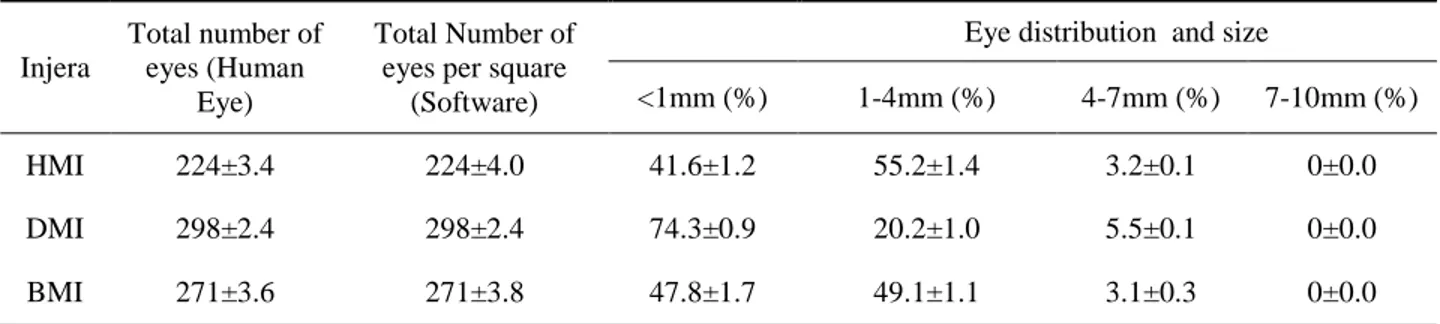
(Table 5). There was no significant difference in the quantification of the injera number of eyes
between human eyes and the software. The software results of the injera number of eyes
(HMI-224 < BMI- 271< DMI-298) agrees with the sensory panelists’ response (HMI-6.1< BMI-6.2 <
DMI-7.8).It is very difficult and takes much time to analyze the injera number of eyes, eye size,
and eye distribution visually by human eye; however, the software analyzed it very quickly
without any problem. The software easily converted the image of the injera sample into other
forms and analyzed and reported it (Fig. S1). The software application required a quicker
determination time than did visual determination. This may save time and help in manufacturing
a uniform quality of injera in the manufacturing industry. In addition, the use of this software can
give additional benefits to injera manufacturing countries to improve injera standards and
requirements by including important injera quality attributes (number of eyes, eye size, and
Table 5. Application of software in injera quality evaluation
Injera
Total number of eyes (Human
Eye)
Total Number of eyes per square
(Software)
Eye distribution and size
<1mm (%) 1-4mm (%) 4-7mm (%) 7-10mm (%) HMI 224±3.4 224±4.0 41.6±1.2 55.2±1.4 3.2±0.1 0±0.0 DMI 298±2.4 298±2.4 74.3±0.9 20.2±1.0 5.5±0.1 0±0.0 BMI 271±3.6 271±3.8 47.8±1.7 49.1±1.1 3.1±0.3 0±0.0 HMI, DMI, and BMI stand for injera from hammer mill, injera from disk mill and injera from blade mill
respectively.
4. Conclusions
Differences in the mill type used to grind tef grain during injera preparation influenced the
particle size distribution and damaged starch level of the tef flour and hence the final quality of
injera. Although mill differences affect the color of the tef flour, the final color of the injera was
not affected. This may be a result of the involvement of other unit operations that are mandatory
in injera making. The variation in injera sensorial quality and starch digestibility were due to the
differences in milling type and its effect on particle size distribution and the damaged starch
level of tef flour. The use of DM gives smaller flour particle size with a high level of starch
damage and leads to better sensorial injera quality than that of BM and HM. The use of BM
leads to a larger flour particle size, which could be responsible for having lower RAG and RDS.
However, it is highly important to study the relationship between damaged starch and flour
particle size on cooked flour. The influence of different tef cultivars and mill types on injera
quality needs to be studied.
The application of software-based injera quality evaluation to determine the number of injera
eyes gave effective results, which thus can replace human manual determination. Determinations
of injera eye size and distribution are the additional advantage of using software-based injera
Acknowledgement
The authors thank DebreZeit Agricultural Research Center of the Ethiopian Institute of
Agricultural Research (EIAR) for providing tef variety and Addis Ababa University for
supporting with facilities in this research work. The authors also thank the financial support of
the Ministerio de Economía y Competitividad and the European Regional Development Fund
(AGL2015-63849-C2-2-R) and the Consejería de Educacion (Junta de Castilla y Leon)/FEDER
(Project VA072P17). Marina Villanueva thanks the Junta de Castilla y Leon for her doctorate
grant.
References
Abebe, W., & Ronda, F. (2014).Rheological and textural properties of tef [Eragrostis tef (Zucc.) Trotter] grain flour gels. Journal of Cereal Science, 60(1), 122-130.
Abebe, W., Collar, C., & Ronda, F. (2015). Impact of variety type and particle size distribution on starch enzymatic hydrolysis and functional properties of tef flours. Carbohydrate polymers, 115, 260-268.
Abebe, Y., Bogale, A., Hambidge, K. M., Stoecker, B. J., Bailey, K., & Gibson, R. S. (2007). Phytate, zinc, iron and calcium content of selected raw and prepared foods consumed in rural Sidama, Southern Ethiopia, and implications for bioavailability. Journal of Food Composition
and Analysis, 20(3), 161-168.
Al-Rabadi, G. J., Gilbert, R. G., & Gidley, M. J. (2009). Effect of particle size on kinetics of starch digestion in milled barley and sorghum grains by porcine alpha-amylase. Journal of
Cereal Science, 50(2), 198-204.
American Association of Cereal Chemists (2012).Approved methods of analysis (11thed.Method: 76-31.01 (damaged starch)), 2012, AACC International; St Paul, MN.
American Association of Cereal Chemists (AACC). (2000). Approved methods of analysis. St. Paul, MN: AACC International.
Baye, K. (2014). Teff: nutrient composition and health benefits (Vol. 67). Intl Food Policy Res Inst.
Bultosa, G., & Taylor, J. (2004). Paste and gel properties and in vitro digestibility of tef [Eragrostis tef (Zucc.)Trotter] starch. Starch-Stärke, 56(1), 20-28.
Central statistical authority (2015). Report on area and production of major crops. 2014/15 Statistical bulletin 578.
Dijkstra, A., Polman, J., van Wulfften-Palthe, A., Gamboa, P. A., & van Ekris, L. (2008).Survey on the nutritional and health aspects of teff (Eragrostis Tef).
Einstein, M. A. (1991). Descriptive techniques and their hybridization. Sensory science theory and applications in foods, 317-338.
Englyst, H. N., Kingman, S. M., & Cummings, J. H. (1992). Classification and measurement of nutritionally important starch fractions. European journal of clinical nutrition, 46, S33-50. Englyst, K. N., Englyst, H. N., Hudson, G. J., Cole, T. J., & Cummings, J. H. (1999). Rapidly
available glucose in foods: an in vitro measurement that reflects the glycemic response. The
American journal of clinical nutrition, 69(3), 448-454.
Englyst, K., Hudson, G., & Englyst, H. (2000).Starch analysis in food. RA Meyers (Ed.), Encyclopedia of Analytical Chemistry.
FAO/WHO, (2003). Food Energy Methods of Analysis and Conversion Factors. FAO Food and Nutrition, Rome. Paper 77
Jane, J. L., Ao, Z., Duvick, S. A., Wiklund, M., Yoo, S. H., Wong, K. S., & Gardner, C. (2003). Structures of amylopectin and starch granules: how are they synthesized?. Journal of Applied
Glycoscience, 50(2), 167-172.
Jellinek, G. (1985). Sensory evaluation of food.Theory and practice. Ellis HorwoodLtd..
Kadan, R. S., Bryant, R. J., & Miller, J. A. (2008). Effects of milling on functional properties of rice flour. Journal of food science, 73(4).
Ketema, S. (1993). Tef (Eragrostis tef): breeding, genetic resources, agronomy, utilization and role in Ethiopian agriculture.
Kihlberg, I., Johansson, L., Kohler, A., & Risvik, E. (2004). Sensory qualities of whole wheat pan bread—influence of farming system, milling and baking technique. Journal of Cereal Science, 39(1), 67-84.
Lawless, H. T., & Heymann, H. (1999).Sensory Evaluation of Food. Principles and Practices,;
Aspen Pulishers. Inc.: Gaithersburg, MD, USA.
Li, E., Dhital, S., & Hasjim, J. (2014).Effects of grain milling on starch structures and flour/starch properties. Starch-Stärke, 66(1-2), 15-27.
Mahasukhonthachat, K., Sopade, P. A., & Gidley, M. J. (2010). Kinetics of starch digestion in sorghum as affected by particle size. Journal of Food Engineering, 96(1), 18-28.
Miao, M., Jiang, B., Cui, S. W., Zhang, T., & Jin, Z. (2015). Slowly digestible starch—a review.
Critical reviews in food science and nutrition, 55(12), 1642-1657.
Nowakowski, D., Sosulski, F. W., & Hoover, R. (1986).The effect of pin and attrition milling on starch damage in hard wheat flours. Starch‐Stärke, 38(8), 253-258.
Parker, M. L., Umeta, M., & Faulks, R. M. (1989). The Contribution of flour components to the structure of injera, an Ethiopian fermented bread made from tef (Eragrostis tef). Journal of
Cereal Science, 10(2), 93-104.
Ronda, F., Abebe, W., Pérez-Quirce, S., & Collar, C. (2015).Suitability of tef varieties in mixed wheat flour bread matrices: A physico-chemical and nutritional approach. Journal of Cereal
Science, 64, 139-146.
Ronda, F., Rivero, P., Caballero, P. A., & Quilez, J. (2012). High insoluble fibre content increases in vitro starch digestibility in partially baked breads. International journal of food sciences
and nutrition, 63(8), 971-977.
Shumoy, H., & Raes, K. (2017). In vitro starch hydrolysis and estimated glycemic index of tef porridge and injera. Food Chemistry, 229, 381-387.
Sivaramakrishnan, H. P., Senge, B., & Chattopadhyay, P. K. (2004).Rheological properties of rice dough for making rice bread. Journal of Food Engineering, 62(1), 37-45.
Spaenij-Dekking, L., Kooy-Winkelaar, Y., &Koning, F. (2005).The Ethiopian cereal tef in celiac disease. New England Journal of Medicine, 353(16), 1748-1749.
Stone, H., &Sidel, J. L. (1985).Sensory Evaluation Practices Academic Press. San Diego, 2nd. Tran, T. T., Shelat, K. J., Tang, D., Li, E., Gilbert, R. G., &Hasjim, J. (2011).Milling of rice
grains. The degradation on three structural levels of starch in rice flour can be independently controlled during grinding. Journal of agricultural and food chemistry, 59(8), 3964-3973. USDA, (2007).National Nutrient Database for Standard Reference.Release 20.USDA.
Viswanath, N. (2012). The Hierarchy of Poor: The Tension between Favoring Smallholder Farmers or Domestic Consumers in Ethiopian Agricultural Development. Africa Policy
Journal, 8, 30.
Yetneberk, S., de Kock, H. L., Rooney, L. W., & Taylor, J. R. (2004).Effects of sorghum cultivar on injera quality. Cereal chemistry, 81(3), 314-321.
Yetneberk, S., Rooney, L. W., & Taylor, J. (2005). Improving the quality of sorghum injera by decortication and compositing with tef. Journal of the Science of Food and Agriculture, 85(8), 1252-1258.