BIBLIOTECAS DEL TECNOLÓGICO DE MONTERREY
PUBLICACIÓN DE TRABAJOS DE GRADO
Las Bibliotecas del Sistema Tecnológico de Monterrey son depositarias de los trabajos recepcionales y de grado que generan sus egresados. De esta manera, con el objeto de preservarlos y salvaguardarlos como parte del acervo bibliográfico del Tecnológico de Monterrey se ha generado una copia de las tesis en versión electrónica del tradicional formato impreso, con base en la Ley Federal del Derecho de Autor (LFDA).
Es importante señalar que las tesis no se divulgan ni están a disposición pública con fines de comercialización o lucro y que su control y organización únicamente se realiza en los Campus de origen.
Cabe mencionar, que la Colección de Documentos Tec, donde se encuentran las tesis, tesinas y
disertaciones doctorales, únicamente pueden ser consultables en pantalla por la comunidad del Tecnológico de Monterrey a través de Biblioteca Digital, cuyo acceso requiere cuenta y clave de acceso, para asegurar el uso restringido de dicha comunidad.
El Tecnológico de Monterrey informa a través de este medio a todos los egresados que tengan alguna inconformidad o comentario por la publicación de su trabajo de grado en la sección Colección de
Modification of the PTT Model and its Application for the
Predictions of Elongational Viscosity of Polypropylenes-Edición
Única
Title Modification of the PTT Model and its Application for the Predictions of Elongational Viscosity of Polypropylenes-Edición Única
Authors Leonardo Federico Cortés Rodríguez Affiliation Campus Monterrey
Issue Date 2004-05-01 Item type Tesis
Rights Open Access
Downloaded 19-Jan-2017 06:49:46
INSTITUTO TECN0L06IC0 Y DE ESTUDIOS
SUPERIORES DE MONTERREY
CAMPUS MONTERREY
DIVISION DE INGENIERIA Y ARQUITECTURA
PROGRAMA DE GRADUADOS EN INGENIERIA
TECNOLOGICO
DE MONTERREY
"MODIFICATION OF THE PTT MODEL AND ITS
APPUCATION FOR THE PREDICTIONS OF
ELONGATION AL VISCOSITY OF
POLYPROPYLENES"
TESIS
PRESENTADA COMO REQUISITO PARCIAL PARA
OBTENER EL GRADO ACADEMICO DE:
MAESTRO EN CIENOAS
CON ESPECIALIDAD EN SISTEMAS AMBIENTALES
POR:
INSTITUTO TECNOLOGICO Y DE ESTUDIOS SUPERIORES DE MONTERREY
CAMPUS MONTERREY
DIVISION DE INGENIERIA YARQUITECTURA PROGRAMA DE GRADUADOS EN INGENIERIA
Los miembros del comité de Tesis recomendamos que la presente Tesis del Ing. Leonardo Federico Cortes Rodriguez
sea aceptada como requisito parcial para obtener el grado academico de
Maestro en Ciencias en Sistemas Ambientales Especialldad en Ingeniería de Procesos
Comite de Tesis
Federico Viramontes Brown, PhD
Director del Programa de Graduados en Ingenieria
ABSTRACT
A comprehensive Theological study of four pairs of isotactic and syndiotactic
polypropylene resins with similar MFI was conducted. The study also includes the
standard quality properties commonly used in the industry. The Theological tests
included double bore capillary rheometry, frequency sweeps and creep and
recovery compliance. The standard quality properties tested were percentage of
Xylene Solubles (XS), Gel Permation Chromatography (GPC), Nuclear Magnetic
Resonance (NMR) and Differential Scanning Calorimetry (DSC). It was found that
the viscoelastic behavior is significantly different between these two types of
resins.
On the other hand, the PTT (Phan Thien and Tanner, 1977) and XPP (Verbeeten,
2001) models were analyzed and evaluated using the experimental data of the
resins under study. It was found that the PTT model fails to predict accurately the
elongational response of the syndiotactic resins.
In addition, a modified PTT model is proposed and evaluated with satisfactory
results. The parameters of this new model were found to be related to molecular
weight distributions features such as Mz and Me.
Additionally, an innovative approach using fractals theory is proposed for the
development of a new fundamental constitutive equation. Further study is
DEDICATION
To my grandmother and greatest person
Fill
To my parents
Oscar Federico and Ana Maria
for all your love, support, patience, wisdom and confidence received in my early
and present days. Thank you for all the positive examples and good familiar
principles. You have taught me to challenge new opportunities in my
life and become a better human being.
To my fiancee
Karla Janet
the love and understanding you gave me was the engine for accomplishing this
ACKNOWLEDGMENTS
First of all, I want to thank G o d for giving me the health and strength to accomplish
this goal in my life.
T o J a i m e Bonilla Rios, Ph.D.
Thank you for offering me the Research Assistant position in the first place, and for
the opportunity and privilege of being your student. Thank you for your continuous
and invaluable advices during the course of this research and for the countless
hours you spent teaching me how to improve my technical skills, and for increasing
my general knowledge and not only in the field of rheology. Thank you for directing
me to be consistent and for offering me your knowledge and experience.
I want to thank you also for introducing me to Total's research team and for the
exposure to the industrial applied research environment. It was a great pleasure for
me to work in an international environment on such an exciting subject under your
supervision.
Furthermore, I want to thank you for the demand for academic excellence through
my Master studies, and for proofreading this document.
T o M i c h e l Daumarie, Ph.D.
Thank you for the support, time and trust received for doing this project. I will
forever appreciate the unique opportunity you gave me and the exposure to the
industrial applied research environment.
T o J o a q u i n A c e v e d o , Ph.D.
I would like to thank all those at I.T.E.S.M. who made possible my Masters Degree:
To all my professors for your teachings and for sharing your knowledge and
experience.
To Elva Cavazos, Genaro Tamez, Manuel Ramos, Ester Nifio and Dolores
Coronado for all your assistance and administrative support.
I would like to thank also the team that made possible the work done in this thesis
at Total's Research a n d T e c h n o l o g y Center:
To Dorothy Bartol, Jeff Nairn, Juan Jose Aguirre, Rodolfo Mier, and Greg Kaase for
their time, interest, support, technical advises, attentions, and for helping me
getting things done during my internships.
To Rodolfo Mier, Jeff Nairn, Bobby Stokes, Theresa Lewis and Michael Schmidt for
teaching me how to use the rheometers. Jeffs interest on the area was always
very important.
Furthermore, I am grateful to Jordan Koniski, Ph.D., Enrique Barrera, Ph.D., Kay
McStay, Judith Farhat, Susan Massey, Sandra Bloem, Adria Baker and all those
who made possible the academic exchange at Rice University.
Special gratitude to all m y Family. My parents, O s c a r Federico a n d A n a Maria,
thank you for all your love, patience, wisdom and confidence received in my early
and present days. Thank you also for the financial support for all these years. My
b r o t h e r s , O s c a r F r a n c i s c o a n d H u g o F e r n a n d o , thank you for your friendship
and invaluable support. My fiancee, Karla Janet, thank you for all your love and
I would like to thank Jesus Valencia, Rocio Hernandez, Monica Macias, Raziel
Cazares, Carlos Morales and all colleagues of the institute for the pleasant time I
spent at Monterrey Tech. I would also like to thank Juan Aguirre, Rodolfo Mier,
Julio Hernandez, Daniel Amador and all those who helped me during my
internships in Houston.
Finally, I want to thank the INSTITUTO TECNOLOGICO Y DE ESTUDIOS
SUPERIORES DE MONTERREY (Monterrey, N.L., Mexico) for the excellence
scholarship that covered the graduate program tuition, and T O T A L
N O M E N C L A T U R E
a Yasuda or Cross model parameter
ai Giesekus model parameters
a i , a2, a3
ak Weighting factor for the
exponential terms of the
memory function r )k/ (X k )
2
aT Horizontal temperature shift
factor
A Modified PTT model parameter.
bT Vertical temperature shift
factor B Finger strain tensor or die swell B Modified PTT model parameter. BHT 26 ditertbutylpcresol b~' Cauchy finite strain tensor C Modified PTT model parameter. D Capillary diameter in capillary rheometry Dp Diameter of the extrudate after die swell DSC Differential scanning calorimeter
EH Horizontal activation energy
for flow
Ev
f i , f2
G'(o>) G"(co) G » G(t) G N GPC Gi Go
K I M
HDPE I /, h h Vertical activation energy for flow Weighting factor for damping function Storage modulus Loss modulus Complex modulus G'(«) + /G"(e>) Relaxation modulus Plateau modulus Gel permeation chromatography Crossover modulus
(1 j)1 A s a superscript refers to the M(tt') Memory function
component of the stress m Consistency (power law
tensor parameter)
iPP Isotactic polypropylene m' Parameter for Hershel
J(t) Creep compliance Bulkley model
J°e Steady state recoverable N Number of relaxation
compliance elements
Jmax Maximum compliance J(t0)
NMR Nuclear Magnetic Resonance
Jr(t) Recoverable compliance at N i ( t , f ) First normal stress difference
any time after the stress ni, n2 Damping function strain
ceased sensitive parameters
Je(t) Elastic compliance Jr( 0 ) Jr( n Powerlaw model parameter
t ) n' Parameter for Hershel
L Length of the capillary die or Bulkley model
spinning PDI Polydispersity index Mw/Mn
LL Length of the long capillary PTT PhanThien and Tanner
die in the double barrel P Isotropic pressure
rheometer (Rosand) q Dangling arms in a pompom
Ls Length of the short capillary molecule
die in the double barrel Q Volumetric flow rate through
rheometer (Rosand) die
L / D Length to diameter ratio for RAA Rheometrics asphalt
capillary die analyzer
LDPE Low density polyethylene RDA Rheometrics dynamic
MFI Melt flow index analyzer
Mn Average number molecular RS5000 Rheometrics stress
weight rheometer
M w Average molecular weight Rb Radius of the barrel or
M W D Molecular weight distribution reservoir
Mz Third moment of the R2 Correlation coefficient
S Second moment of the
orientation distribution of
backbone segments in XPP
model
S(i) Convected time derivative of
S tensor.
sPP Syndiotactic Polypropylene
SQP Standard quality properties
T Temperature
Tg Glass transition temperature
T m Melting temperature
To Reference temperature
TTS TimeTemperature
Superposition
t Time
t' Time relative to the position
at time t
tQ Time at which stress ceases
in a creep test
tan 5(co) Loss tangent, ratio of
G"(co)/G'((o)
u Dimensionless axial velocity u = u / uc
w(i,,i2)Potential Function in Wagner
Model
XPP Extended PomPom
X S Percentage of xylene
solubles
Z(frt,.) Rate of destruction of
junctions function of the PTT
model corresponding to the i
th contribution to the stress
Greek S y m b o l s
a PTT model elongational
parameter,
a XPP model parameter defining
the amount of anisotropy.
y(t) Imposed shear strain
y(t) = ya sin(erf)
y0 Strain amplitude in an
oscillatory test
yr Recovered shear strain in a
creep test
y Rate of strain (deformation)
tensor
Y0 Imposed shear rate
Ya Apparent shear rate
(32Q)/(rtD3)
tt Corrected shear rate
r3n + l l
ru Shear rate tensor component
A PE Pressure drop due to
elasticity of the melt
APL Long capillary die pressure
drop
APs Short capillary die pressure
A PT Total pressure drop A PV + Xc Cross model characteristic
A PE time
A PV Pressure drop due to h or Xk Relaxation spectrum time
viscosity of the melt Relaxation time of the
e Elongational (Henky) strain backbone tube orientation in
£ Extension rate the X P P model.
£ max Maximum extension rate As Stretch relaxation time.
Ha Apparent shear viscosity A Stretch ratio of the backbone
na = Tw/fa
in X P P model
Hi Or r(k Relaxation spectrum
V Measure of the influence of
viscosity surroundings polymer chains
Ho Zero shear viscosity on the backbone tube stretch
n ( t , t ) Shear viscosity Newtonian viscosity
r\,(z,b) Shear free viscosity function
r\,(z,b) Shear free viscosity function
PTT model shear parameter.
i\2(i,b) Shear free viscosity function
PTT model shear parameter.
i\2(i,b) Shear free viscosity function
p Density
ne(s) Elongational viscosity
Extensional (elongational)
ne(s) Elongational viscosity
Extensional (elongational) stress nt True shear viscosity from °o Stress amplitude capillary data o(t) Sinusoidal stress Dynamic viscosity G"(co) / © o(t)
CJ0 sin(©t + 8)
Dynamic viscosity G"(co) / ©
CJ0 sin(©t + 8)
T1"(C0) Imaginary component of
CJ0 sin(©t + 8)
complex viscosity on Extensional stress
complex viscosity on Extensional stress
n » Complex viscosity
component
Capillary die entrance angle: X Stress tensor
CD Capillary die entrance angle: Stress tensor
Flat entrance 9 = 1 8 0 ° = %
T
kk Component (kk) of the stress
radian tensor corresponding to the i
radian
th relaxation element Cone entrance 6 = 90° = it th relaxation element
12 radian contribution to the stress
12 radian contribution to the stress
Imposed stress in a creep test
Shear stress at the wall
ith contribution to the stress
tensor
Stress tensor component
True shear stress
Value of t y x when r p r\012
Convected time derivative of
the stress tensor
tw= J U { ( V o ) r
c + t ( V u ) }
Piston velocity in a capillary test
Wagner's (1976) damping function parameter
<D Wagner's (1976) damping function parameter
S Wagner's (1979) damping
function parameter
wrfy) First normal stress coefficient
*¥2(y) Second normal stress
coefficient
ca Vorticity tensor
Vu(Vv)* =2Vur
© Frequency (rad/sec)
c o x Crossover frequency
(rad/sec)
TABLE OF CONTENTS
CHAPTER I. INTRODUCTION 1
A. PROBLEM STATEMENT 2
B. RESEARCH PROPOSAL AND OBJECTIVES 3
C. JUSTIFICATION 3
D. GENERAL METHODOLOGY 4
1. Materials Preparation 4
2. Standard Quality Control Techniques 4
3. Rheological Techniques 4
E. GENERAL ORGANIZATION 5
CHAPTER II. THEORETICAL BACKGROUND 7
A. INTRODUCTION TO RHEOLOGY 7
1. Strain and Stress Tensors (Bird, 1987) 8
2. Materials Functions 10 3. Convected Derivative Tensors 11
B. MEASUREMENTS AND EMPIRICAL MODELS 12
1. Die Swell 12 2. Polidispersity Index 13
3. Steady Shear Properties 14 4. TimeTemperature Superposition Principle 15
5. Viscosity Models 17 6. Zeroshear Viscosity 18
C. CONSTITUTIVE EQUATIONS 19
1. Criminale Ericksen Filbey Equation 20
2. Doi Edwards Model 20 3. Giesekus Model 21
4. Jeffreys Model 22
5. Johnson Segalman Model 22
6. Kaye BKZ Model 23
7. Larson Model 23 8. Marruci (Acierno) Model 24
9. Phan Thien Tanner Model 25
10. Pom Pom Model 25
D. INTRODUCTION TO FRACTALS THEORY 2 9
C H A P T E R III. E X P E R I M E N T A L T E C H N I Q U E S 3 3
A. MATERIALS 3 3
B. STANDARD QUALITY CONTROL TECHNIQUES 3 4
1. Melt Flow Index 34 2. Percentage of Xylene Solubles 34
3. Molecular Weight Distribution 34 4. Nuclear magnetic Resonance 35 5. Differential Scanning Calorimetry 36 C. RHEOLOGICAL CHARACTERIZATION 3 9
1. Sample Preparation 39 2. Testing Conditions 39 3. Testing Equipment 39 4. Oscillatory Frequency Sweeps 40
5. Creep and Recovery Compliance 43 6. Shear Viscosity by Capillary Rheometer 44 7. Elongational Viscosity by Capillary Rheometer 46 C H A P T E R IV. S T A N D A R D Q U A L I T Y P R O P E R T I E S 4 9
A. MOLECULAR WEIGHT DISTRIBUTION ( M W D ) 4 9
B. NUCLEAR MAGNETIC RESONANCE (NMR) 51
1. Principles (Odian, 1991) 51 2. Analysis of stereoregularity 53
C. CALORIMETRIC DATA 5 4
C H A P T E R V. O S C I L L A T O R Y D A T A 5 7
A. STORAGE AND LOSS MODULI 5 7
B. CROSSOVER POINT 6 1
C. Loss TANGENT 6 2
D. COMPLEX VISCOSITY 6 2
E. POLIDISPERSITY INDEX 6 3
F. ZERO SHEAR VISCOSITY 6 4
G. DISCRETE RELAXATION SPECTRUM 6 5
H. TIME TEMPERATURE SUPERPOSITION (TTS) 6 6
C H A P T E R V I . C A P I L L A R Y D A T A 6 9
A. STEADY STATE 6 9
C. FITTING VISCOSITY CURVES 7 5
D. CAPILLARY ANALYSIS 7 7
CHAPTER VII. CREEP AND RECOVERY COMPLIANCE 83
A. CREEP AND RECOVERY STANDARD TEST 8 3
B. CREEP TIME ANALYSIS 8 4
C. SHEAR STRESS ANALYSIS 8 7
CHAPTER VIII. PTT MODEL 89
A. THE MULTI MODE PHAN THIEN TANNER (PTT) MODEL 8 9
B. PREDICTIONS OF P T T MODEL IN SIMPLE SHEAR 9 0
C. PREDICTIONS OF PTT MODEL IN SHEARFREE FLOW 9 3
CHAPTER IX. PTT MODEL MODIFICATION 97
A. ELONGATIONAL PARAMETER ANALYSIS 9 7
B. MODIFICATION 100
C. PREDICTIONS IN SIMPLE SHEAR 101
D. PREDICTIONS IN SHEAR FREE FLOW 104
CHAPTER X. POM POM MODEL 109
A. THE P O M P O M AND X P P MODEL 109
B. PREDICTIONS OF X P P MODEL IN SHEAR FREE FLOW 1 1 1
C. PREDICTIONS OF X P P MODEL IN SIMPLE SHEAR 1 1 6
CHAPTER XI. DISCUSSION OF RESULTS 121
A. COMPARISON OF VISCOELASTIC PROPERTIES OF SYNDIO AND ISOTACTIC POLYPROPYLENES.... 121
B. P T T MODEL 127
C. X P P MODEL 135
D. CONSTITUTIVE EQUATIONS COMPARISON 137
E. OTHER PRACTICAL RELATIONSHIPS 1 4 0
CHAPTER XII. FRACTALS APPROACH 149
A. BACKGROUND 149
B. RANDOM WALKS 153
C. SELFAVOIDING WALKS 154
D. DISCUSSION 157
CHAPTER XIII. CONCLUSIONS AND RECOMENDATIONS 167
2. Constitutive modeling 169 3. Fractals Approach 170 4. Empirical relationships 171 B. RECOMMENDATIONS 172
REFERENCES ...175
APPENDIX A. CALCULATIONS TO TRANSFORM CAPILLARY RHEOMETER RAW DATA
INTO SHEAR AND ELONGATIONAL VISCOSITY 183
A. EQUIPMENT DESCRIPTION 183
B. RAW DATA 183
C. STEADY SHEAR VISCOSITY 184
D. TRANSIENT SHEAR VISCOSITY 185
E. STEADY ELONGATIONAL VISCOSITY 185
F. TRANSIENT ELONGATIONAL VISCOSITY 1 86
APPENDIX B. SOFTWARE DEVELOPED 187
A. MODIFIED PTT MODEL 187
1. Shear Flow 188 2. Shear Free Flow. 191
B. X P P MODEL 1 9 3
1. Shear Flow 193 2. Shear Free Flow. 197 C. RANDOM WALKS 2 0 0
1. 1D 201 2. 2D 204 D. SELFAVOIDING RANDOM WALKS 2 0 8
1. 2D 208 2. 3D 215
APPENDIX C. RHEOMETERS PROCEDURES 223
A. PARALLEL PLATE RHEOMETER 2 2 3
1. Equipment description 223 2. Safety precautions 223 3. Sample preparation 223 4. System startup 224
5. Specimen loading 2 2 6
6. Begin test 2 2 7
8. Emergency shut down procedure 228
B. CAPILLARY RHEOMETER 2 2 9
1. Equipment description 229 2. Safety precautions 230 3. Test Setup 230 4. Running tests 231 5. Equipment cleanup 231 C. CONTROLLED STRESS RHEOMETER 2 3 2
List of Figures
FIGURE 111.1. SCHEMATIC D S C PLOT 3 8
FIGURE lli.2. COMPARISON BETWEEN ELONGATIONAL VISCOSITY AT 2 0 0 °C CALCULATED FROM THE
ORIGINAL COGSWELL'S ANALYSIS AND THAT OBTAINED FROM ROSAND SOFTWARE. MIER (2000)
DEVELOPED THIS PLOT USING A METALLOCENE ISOTACTIC POLYPROPYLENE RESIN 4 7
FIGURE IV. 1. MOLECULAR WEIGHT DISTRIBUTIONS AS OBTAINED FROM G P C FOR RESIN A AND E 5 0
FIGURE IV.2. MOLECULAR WEIGHT DISTRIBUTIONS AS OBTAINED FROM G P C FOR ALL THE RESINS 5 0
FIGURE IV.3. DEPICTURE OF ISOTACTIC (MESO) AND SYNDIOTACTIC (RACEMIC) DYADS 5 2
FIGURE IV.4. DEPICTION OF ISOTACTIC (MESO), SYNDIOTACTIC (RACEMIC), AND HETEROTACTIC TRIADS. . 5 2
FIGURE IV.5. DEPICTION OF ISOTACTIC (MESO), SYNDIOTACTIC (RACEMIC), AND HETEROTACTIC TRIADS. 5 2
FIGURE V . 1 . STORAGE AND LOSS MODULI AT 2 0 0 °C FOR RESIN A 5 7
FIGURE V.2. STORAGE AND LOSS MODULI AT 2 0 0 °C FOR RESIN B 5 8
FIGURE V.3. STORAGE AND LOSS MODULI AT 2 0 0 °C FOR RESIN C 5 8
FIGURE V.4. STORAGE AND LOSS MODULI AT 2 0 0 °C FOR RESIN D 5 9
FIGURE V.5. STORAGE AND LOSS MODULI AT 2 0 0 ° C FOR RESIN E 5 9
FIGURE V.6. STORAGE AND LOSS MODULI AT 2 0 0 °C FOR RESIN F 6 0
FIGURE V.7. STORAGE AND LOSS MODULI AT 2 0 0 °C FOR RESIN G 6 0
FIGURE V.8. STORAGE AND LOSS MODULI AT 2 0 0 °C FOR RESIN H 6 1
FIGURE V.9. LOSS TANGENT VS. FREQUENCY FOR ALL RESINS AT 2 0 0 °C. THE OPEN SYMBOLS WERE USED
FOR SYNDIOTACTIC PP. SAME TYPE OF SYMBOLS ARE USED FOR SIMILAR MF. DIAMONDS ARE FOR
M F = 2 , SQUARES FOR MF=4, TRIANGLES FOR M F = 1 2 AND CIRCLES FOR M F = 1 9 6 2
FIGURE V.10. COMPLEX VISCOSITY FOR ALL THE RESINS AT 2 0 0 °C. THE OPEN SYMBOLS WERE USED FOR
SYNDIOTACTIC PP. SAME TYPE OF SYMBOLS ARE USED FOR SIMILAR MF. DIAMONDS ARE FOR M F = 2 ,
SQUARES FOR M F = 4 , TRIANGLES FOR M F = 1 2 AND CIRCLES FOR M F = 1 9 6 3
FIGURE V. 1 1 . Loss TANGENT vs. COMPLEX MODULUS DATA AT DIFFERENT TEMPERATURES FOR ALL THE
RESINS 6 7
FIGURE V.12. Loss TANGENT SUPERPOSITION MASTER CURVE FOR RESIN A. 6 8 FIGURE V I . 1. SHEAR VISCOSITY CURVES FOR RESIN B OBTAINED WITH THREE DIFFERENT DIES 7 0
FIGURE VI.2. ELONGATIONAL VISCOSITY CURVES FOR RESIN B USING THREE DIFFERENT DIES 7 0
FIGURE VI.3. SHEAR VISCOSITY FOR ALL THE RESINS ( @ D=0.5 MM). THE OPEN SYMBOLS WERE USED
FOR SYNDIOTACTIC PP. SAME TYPE OF SYMBOLS ARE USED FOR SIMILAR MF. DIAMONDS ARE FOR
M F = 2 , SQUARES FOR MF=4, TRIANGLES FOR M F = 1 2 AND CIRCLES FOR M F = 1 9 7 1
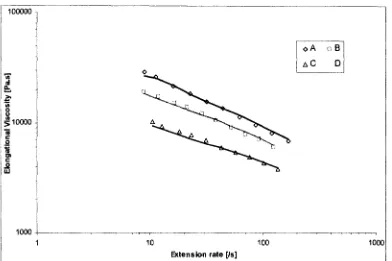
FIGURE V I A EXTENSIONAL VISCOSITY FOR ALL THE RESIN ( @ D=0.5 MM). THE OPEN SYMBOLS WERE
USED FOR SYNDIOTACTIC PP. SAME TYPE OF SYMBOLS ARE USED FOR SIMILAR MF. DIAMONDS ARE
FIGURE VI.5. TROUTON RATIO FOR ALL THE RESIN ( @ D=0.5 MM). THE OPEN SYMBOLS WERE USED FOR
SYNDIOTACTIO PP. SAME TYPE OF SYMBOLS ARE USED FOR SIMILAR MF. DIAMONDS ARE FOR
MF=2, SQUARES FOR MF=4, TRIANGLES FOR M F = 1 2 AND CIRCLES FOR M F = 1 9 7 2
FIGURE VI.6. TRANSIENT SHEAR VISCOSITY AT APPARENT SHEAR RATE OF 5 0 0 Is AT 2 0 0 °C. THE OPEN
SYMBOLS WERE USED FOR SYNDIOTACTIC PP. SAME TYPE OF SYMBOLS ARE USED FOR SIMILAR M F .
DIAMONDS ARE FOR MF=2, SQUARES FOR MF=4, TRIANGLES FOR M F = 1 2 AND CIRCLES FOR
M F = 1 9 7 3
FIGURE VI.7.TRANSIENT SHEAR VISCOSITY AT APPARENT SHEAR RATE OF 1000 /s AT 2 0 0 °C. THE OPEN
SYMBOLS WERE USED FOR SYNDIOTACTIC PP. SAME TYPE OF SYMBOLS ARE USED FOR SIMILAR MF.
DIAMONDS ARE FOR MF=2, SQUARES FOR MF=4, TRIANGLES FOR M F = 1 2 AND CIRCLES FOR
M F = 1 9 7 3
FIGURE VI.8. TRANSIENT ELONGATIONAL VISCOSITY AT APPARENT SHEAR RATE OF 5 0 0 Is AT 2 0 0 °C. THE
OPEN SYMBOLS WERE USED FOR SYNDIOTACTIC PP. SAME TYPE OF SYMBOLS ARE USED FOR SIMILAR
MF. DIAMONDS ARE FOR MF=2, SQUARES FOR MF=4, TRIANGLES FOR M F = 1 2 AND CIRCLES FOR
M F = 1 9 7 4
FIGURE VI.9. TRANSIENT ELONGATIONAL VISCOSITY AT APPARENT SHEAR RATE OF 1000 Is AT 2 0 0 ° C .
THE OPEN SYMBOLS WERE USED FOR SYNDIOTACTIC PP. SAME TYPE OF SYMBOLS ARE USED FOR
SIMILAR MF. DIAMONDS ARE FOR MF=2, SQUARES FOR MF=4, TRIANGLES FOR M F = 1 2 AND
CIRCLES FOR M F = 1 9 7 4
FIGURE VI. 10. PRESSURE DROP IN A CAPILLARY FLOW 7 8
FIGURE VI.11. CAPILLARY ANALYSIS IN ORDER TO LOOK AT THE COMPRESSIBILITY EFFECTS 7 9
FIGURE VI. 12. ENTRANCE PRESSURE DROP VS DIE DIAMETER RECIPROCAL FOR RESIN B 8 0
FIGURE VI. 13. CORRECTED AND COGSWELL EXTENSIONAL VISCOSITY FOR RESIN B 8 1
FIGURE VII.1. STRAIN RESPONSE VS TIME APPLYING A STRESS OF 6 0 0 PA FOR 4 0 0 s FOR ALL THE RESINS.
THE OPEN SYMBOLS WERE USED FOR SYNDIOTACTIC PP. SAME TYPE OF SYMBOLS ARE USED FOR
SIMILAR MF. DIAMONDS ARE FOR M F = 2 , SQUARES FOR MF=4, TRIANGLES FOR M F = 1 2 AND
CIRCLES FOR M F = 1 9 8 3
FIGURE VII.2. RECOVERY COMPLIANCE VS RECOVERY TIME AFTER APPLYING A STRESS OF 6 0 0 PA FOR 4 0 0
S FOR ALL THE RESINS. THE OPEN SYMBOLS WERE USED FOR SYNDIOTACTIC PP. SAME TYPE OF
SYMBOLS ARE USED FOR SIMILAR MF. DIAMONDS ARE FOR M F = 2 , SQUARES FOR MF=4, TRIANGLES
FOR M F = 1 2 AND CIRCLES FOR M F = 1 9 8 4
FIGURE VII.3. STRAIN RESPONSE VS TIME APPLYING A STRESS OF 6 0 0 PA FOR 1 s FOR ALL THE RESINS.
THE OPEN SYMBOLS WERE USED FOR SYNDIOTACTIC PP. SAME TYPE OF SYMBOLS ARE USED FOR
SIMILAR MF. DIAMONDS ARE FOR M F = 2 , SQUARES FOR MF=4, TRIANGLES FOR M F = 1 2 AND
CIRCLES F O R M F = 1 9 8 5
FIGURE Vll.4. STRAIN RESPONSE VS TIME APPLYING A STRESS OF 6 0 0 PA FOR 6 0 s FOR ALL THE RESINS.
SIMILAR MF. DIAMONDS ARE FOR MF=2, SQUARES FOR MF=4, TRIANGLES FOR M F = 1 2 AND
CIRCLES FOR M F = 1 9 8 5
FIGURE VII.5. RECOVERY COMPLIANCE vs RECOVERY TIME AFTER APPLYING A STRESS OF 6 0 0 PA FOR 1 s
FOR ALL THE RESINS. THE OPEN SYMBOLS WERE USED FOR SYNDIOTACTIC PP. SAME TYPE OF
SYMBOLS ARE USED FOR SIMILAR MF. DIAMONDS ARE FOR MF=2, SQUARES FOR MF=4, TRIANGLES
FOR M F = 1 2 AND CIRCLES FOR M F = 1 9 8 6
FIGURE VII.6. RECOVERY COMPLIANCE vs RECOVERY TIME AFTER APPLYING A STRESS OF 6 0 0 PA FOR 6 0
S FOR ALL THE RESINS. THE OPEN SYMBOLS WERE USED FOR SYNDIOTACTIC PP. SAME TYPE OF
SYMBOLS ARE USED FOR SIMILAR MF. DIAMONDS ARE FOR M F = 2 , SQUARES FOR M F = 4 , TRIANGLES
FOR M F = 1 2 AND CIRCLES FOR M F = 1 9 8 6
FIGURE VII.7. RECOVERY COMPLIANCE vs RECOVERY TIME AFTER APPLYING A STRESS OF 2 4 0 0 PA FOR
4 0 0 s FOR ALL THE RESINS 8 7
FIGURE VII.8. RECOVERY COMPLIANCE VS RECOVERY TIME AFTER APPLYING A STRESS OF 1200 PA FOR
4 0 0 s FOR ALL THE RESINS 8 8
FIGURE VII.9. RECOVERY COMPLIANCE VS RECOVERY TIME AFTER APPLYING A STRESS OF 3 0 0 PA FOR 4 0 0
S FOR ALL THE RESINS 8 8
FIGURE VIII.1. EXPERIMENTAL (SYMBOLS) AND PREDICTED (SOLID LINES) STEADY SHEAR VISCOSITY 9 2
FIGURE VIII.2. EXPERIMENTAL (SYMBOLS) AND PREDICTED (SOLID LINES) ELONGATIONAL VISCOSITY FOR
SYNDIOTACTIC RESINS 9 4
FIGURE VIII.3. EXPERIMENTAL (SYMBOLS) AND PREDICTED (SOLID LINES) ELONGATIONAL VISCOSITY FOR
ISOTACTIC RESINS 9 5
FIGURE IX. 1. ELONGATIONAL PARAMETER ANALYSIS FOR ISOTACTIC RESIN F 9 8
FIGURE IX.2. ELONGATIONAL PARAMETER ANALYSIS FOR SYNDIOTACTIC RESIN A 9 8
FIGURE IX. 3. ELONGATIONAL PARAMETER AS A FUNCTION OF THE EXTENSION RATE FOR SYNDIOTACTIC
RESINS 9 9
FIGURE IX.4. ELONGATIONAL PARAMETER AS A FUNCTION OF EXTENSION RATE FOR ISOTACTIC RESINS. 100
FIGURE IX.5. MODIFIED P T T MODEL'S PREDICTIONS AND EXPERIMENTAL SHEAR VISCOSITY FOR
SYNDIOTACTIC RESIN A (OPEN SYMBOLS) AND ISOTACTIC RESIN E (FILLED SYMBOLS) 103
FIGURE IX.6. PREDICTION OF THE MODIFIED P T T MODEL FOR THE TRANSIENT SHEAR VISCOSITY OF
SYNDITACTIC RESIN A AT DIFFERENT SHEAR RATES 103
FIGURE IX.7. PREDICTION OF THE MODIFIED PTT MODEL FOR THE TRANSIENT SHEAR VISCOSITY OF
ISOTACTIC RESIN E AT DIFFERENT SHEAR RATES 104
FIGURE IX.8. MODIFIED P T T MODEL'S PREDICTIONS AND EXPERIMENTAL ELONGATIONAL VISCOSITY FOR
SYNDIOTACTIC RESIN A (OPEN SYMBOLS) AND ISOTACTIC RESIN H (FILLED SYMBOLS) 106
FIGURE IX.9. MODIFIED P T T MODEL'S PREDICTIONS AND EXPERIMENTAL ELONGATIONAL VISCOSITY FOR
SYNDIOTACTIC RESINS 1 0 6
FIGURE IX. 1 1 . PREDICTION OF THE MODIFIED P T T MODEL FOR THE TRANSIENT ELONGATIONAL VISCOSITY
OF SYNDIOTACTIC RESIN A AT DIFFERENT EXTENSION RATES 108
FIGURE IX. 12. PREDICTION OF THE MODIFIED P T T MODEL FOR THE TRANSIENT ELONGATIONAL VISCOSITY
OF ISOTACTIC RESIN E AT DIFFERENT EXTENSION RATES 108
FIGURE X . 1 . DESCRIPTION OF THE POM POM MOLECULE 1 1 0
FIGURE X.2. X P P MODEL'S PREDICTIONS AND EXPERIMENTAL ELONGATIONAL VISCOSITY FOR
SYNDIOTACTIC RESINS 1 1 4
FIGURE X.3. X P P MODEL'S PREDICTIONS AND EXPERIMENTAL ELONGATIONAL VISCOSITY FOR ISOTACTIC
RESINS 1 1 4
FIGURE X.4. X P P MODEL'S PREDICTIONS OF TRANSIENT ELONGATIONAL VISCOSITY FOR SYNDIOTACTIC
RESIN A AT DIFFERENT EXTENSION RATES 1 1 5
FIGURE X.5. X P P MODEL'S PREDICTIONS OF TRANSIENT ELONGATIONAL VISCOSITY FOR ISOTACTIC RESIN
E AT DIFFERENT EXTENSION RATES 1 1 6
FIGURE X.6, X P P MODEL'S PREDICTIONS AND EXPERIMENTAL SHEAR VISCOSITY FOR ALL THE RESINS. . 1 1 9
FIGURE X I . 1. DIFFERENT STEREOCHEMICAL CONFIGURATIONS OF POLYPROPYLENE 1 2 1
FIGURE XI.2. RELATIONSHIP BETWEEN ISOTACTIC AND SYNDIOTACTIC RESINS' CROSSOVER MODULUS. . 122
FIGURE XI.3. RELATIONSHIP BETWEEN ISOTACTIC AND SYNDIOTACTIC RESINS' CROSSOVER FREQUENCY.
123
FIGURE XI.4. RELATIONSHIP BETWEEN CROSSOVER MODULUS AND MFI 124
FIGURE XI.5. RELATIONSHIP BETWEEN CROSSOVER FREQUENCY AND M F I 1 2 4
FIGURE XI.6. Loss TANGENT VS. COMPLEX MODULUS DATA AT DIFFERENT TEMPERATURES FOR ALL
RESINS 125
FIGURE XI.7. CREEP COMPLIANCE RELATION TO MFI AND CREEP TIME 126
FIGURE XI.8. RELATIONSHIP BETWEEN P T T MODEL'S SHEAR AND ELONGATIONAL PARAMETERS 1 2 8
FIGURE XI.9. RELATIONSHIP BETWEEN ELONGATIONAL PARAMETER AND THE PERCENTAGE OF XYLENE
SOLUBLES 1 2 9
FIGURE XI. 10. RELATIONSHIP BETWEEN SHEAR PARAMETER AND THE CROSSOVER FREQUENCY 129
FIGURE X I . 1 1 . RELATIONSHIP BETWEEN MODIFIED PTT MODEL SHEAR PARAMETER C AND THE M F I 131
FIGURE X I . 12. RELATIONSHIP BETWEEN MODIFIED PTT MODEL SHEAR PARAMETER C AND MW/ME RATIO.
132
FIGURE XI. 13. RELATIONSHIP BETWEEN MODIFIED PTT MODEL ELONGATIONAL PARAMETER B AND THE
PERCENTAGE OF XYLENE SOLUBLE 133
FIGURE X I . 14. RELATIONSHIP BETWEEN MODIFIED P T T MODEL ELONGATIONAL PARAMETER B AND
MOLECULAR WEIGHT AVERAGE MZ 133
FIGURE X I . 15. RELATIONSHIP BETWEEN MODIFIED PTT MODEL ELONGATIONAL PARAMETER A AND MZ/ME
RATIO 134
FIGURE X I . 16. EXPERIMENTAL ELONGATIONAL VISCOSITY AND MPTT, X P P AND PTT MODELS'
FIGURE X I . 17. RELATIONSHIP BETWEEN MFI AND ZEROSHEAR VISCOSITY 140
FIGURE X I . 18. RELATIONSHIP BETWEEN MFI AND THE MOLECULAR WEIGHT AVERAGE MW 141
FIGURE X I . 19. RELATIONSHIP BETWEEN THE ZEROSHEAR VISCOSITY ( @ 2 0 0 °C) AND THE MOLECULAR
WEIGHT AVERAGE MW 141
FIGURE XI.20. RELATIONSHIP BETWEEN THE ZEROSHEAR VISCOSITY SHIFTED TO 2 3 0 ° C AND THE
MOLECULAR WEIGHT AVERAGE MW 142
FIGURE X I . 2 1 . RELATIONSHIP BETWEEN THE ZEROSHEAR VISCOSITY AND THE CROSSOVER FREQUENCY.
143
FIGURE XI.22. RELATIONSHIP BETWEEN THE MOLECULAR WEIGHT AVERAGE MW AND THE CROSSOVER
FREQUENCY 143
FIGURE XI.23. RELATIONSHIP BETWEEN THE MOLECULAR WEIGHT AVERAGE MZ AND THE CROSSOVER
FREQUENCY 144
FIGURE XI.24. RELATIONSHIP BETWEEN THE MOLECULAR WEIGHT AVERAGE MZ AND THE PERCENTAGE OF
SOLUBLE X S 144
FIGURE XI.25. RELATIONSHIP BETWEEN THE POLIDISPERSITY MW/MN AND THE PERCENTAGE OF SOLUBLE
X S 145
FIGURE XI.26. RELATIONSHIP BETWEEN MZ/MW RATIO AND THE PERCENTAGE OF SOLUBLE X S 145
FIGURE XI.27. RELATIONSHIP BETWEEN MZ/MN RATIO AND THE PERCENTAGE OF SOLUBLE X S 1 4 6
FIGURE XI.28. RELATIONSHIP BETWEEN PERCENTAGE OF ISOTACTICITY (%MESO) AND THE PERCENTAGE
OF SOLUBLE X S 1 4 6
FIGURE XI.29. RELATIONSHIP BETWEEN THE RECRYSTALLIZATION PEAK AND THE PERCENTAGE OF
ISOTACTICITY (%MESO) 147
FIGURE XI.30. RELATIONSHIP BETWEEN THE MELTING TEMPERATURE AND THE PERCENTAGE OF
ISOTACTICITY (% MESO) 147
FIGURE X I . 3 1 . RELATIONSHIP BETWEEN THE SECOND MELT PEAK AND THE RECRYSTALLIZATION PEAK IN THE
D S C 148
FIGURE XII. 1. POLLOCK'S CONVERGENCE: NUMBER 10,1952 (ALBRIGHT KNOW GALLERY, USA) 150
FIGURE XII.2. POLLOCK'S BLUE POLES, 1952 (AUSTRALIAN NATIONAL GALLERY) 151
FIGURE XII.3. DESCRIPTION OF FRACTALS DIMENSIONS 151
FIGURE XII.4. FRACTAL DIMENSION EVOLUTION IN POLLOCK'S PAINTINGS 152
FIGURE XII.5. THREE1D RANDOM WALKS STARTING AT THE SAME POINT (DISTANCE = 0) 153
FIGURE XII.6. RELATION BETWEEN THE NUMBER OF JUNCTIONS AND THE DISTANCE BETWEEN STARTING
POINTS FOR THREE 1D RANDOM WALKS 154
FIGURE XII.7. 2D RANDOM WALKS STARTING AT DIFFERENT POINTS (DISTANCE = 5) 154
FIGURE XII.8. EXAMPLES OF 2D SELFAVOIDING WALKS 155
FIGURE XII.12. SAME PICTURE THAT PREVIOUS PICTURE, BUT WITH OUT THE DIMENSION AXES 158
FIGURE XII. 13. VIEW OF XY PLANE OF PREVIOUS PICTURE 159
FIGURE XII.14. ILUSTRATION OF THE PROCESS OF DESTRUCTION OF JUNCTIONS 163
List of Tables
TABLE III.1. POLYPROPYLENE RESINS USED IN THE RESEARCH 3 3
TABLE III.2. EQUIPMENT USED FOR THE RHEOLOGICAL CHARACTERIZATION 4 0
TABLE IV. 1. MOLECULAR WEIGH MOMENTS AND POLYDISPERSITY INDICES AS OBTAINED FROM GPC 4 9
TABLE IV.2. N M R SPECTRUM (% MOL) FOR ALL THE RESINS 5 4
TABLE IV.3. D S C ANALYSIS RESULTS FOR ALL THE RESINS 5 5
TABLE IV.4. POLYPROPYLENE UNIT CELL PARAMETERS 5 5
TABLE IV.5. PERCENTAGE OF CRYSTALLINITY FOR ALL THE RESINS 5 6
TABLE V.1. CROSSOVER FREQUENCY AND MODULUS FOR ALL RESINS AT 2 0 0 °C 6 1
TABLE V.2. COMPARISON BETWEEN PDI ESTIMATED AS SUGGESTED BY ZEICHNER AND PATEL ( 1 9 8 1 ) AND
PDI OBTAINED FROM GPC MEASUREMENTS 6 4
TABLE V.3. ZERO SHEAR VISCOSITY CALCULATED WITH THE LOWEST FREQUENCY POINT OF THE LOSS
MODULUS 6 5
TABLE V.4. DISRETE RELAXATION SPECTRUM OBTAINED FROM MIER'S (2000) SOFTWARE FOR ALL THE
RESINS 6 6
TABLE V.5. HORIZONTAL ACTIVATION ENERGIES FOR ALL THE RESINS 6 8
TABLE VI. 1. CROSS MODEL PARAMETERS FOR FITTING THE SHEAR VISCOSITY CURVES 7 5
TABLE VI.2. YASUDA MODEL PARAMETERS FOR FITTING THE SHEAR VISCOSITY CURVES 7 6
TABLE VI.3. CARREAU MODEL PARAMETERS FOR FITTING THE SHEAR VISCOSITY CURVES 7 6
TABLE VI.4. CROSS MODEL PARAMETER FOR FITTING THE ELONGATIONAL VISCOSITY CURVES 7 6
TABLE VI.5. YASUDA MODEL PARAMETERS FOR FITTING THE ELONGATIONAL VISCOSITY CURVES 7 7
TABLE Vl.6. CARREAU MODEL PARAMETERS FOR FITTING THE ELONGATIONAL VISCOSITY CURVES 7 7
TABLE VI.7. PRESSURE DROP DUE TO THE MELT COMPRESSIBILITY FOR ALL THE RESINS 8 0
TABLE VI.8. PRESSURE DROP DUE TO THE MELT ELASTICITY FOR ALL THE RESINS 81
TABLE VI11.1. PTT MODEL PARAMETERS 9 2
TABLE IX.1. SHEAR PARAMETER (C) FOR THE MODIFIED PTT MODEL FOR ALL RESINS 103
TABLE IX.2. ELONGATIONAL FITTING PARAMETERS FOR THE MODIFIED PTT MODEL FOR ALL RESINS 107
TABLE X. 1. XPP MODEL PARAMETERS FOR FITTING THE ELONGATIONAL VISCOSITY FOR ALL THE RESINS.
1 1 5
TABLE XI. 1. PTT MODEL PARAMETERS EFFECTS ON THE MODEL OUTPUT 127
TABLE XI.2. MODIFIED PTT MODEL PARAMETER EFFECTS ON THE MODEL OUTPUT 130
TABLE XI.3. XPP MODEL PARAMETER EFFECTS ON THE MODEL OUTPUT 137
TABLE XI.4. COMPARISON OF THE CONSTITUTIVE EQUATIONS USED IN THIS THESIS 138
TABLE XI.5. ADVANTAGES AND DISADVANTAGES OF THE CONSTITUTIVE EQUATIONS USED IN THIS THESIS.
C H A P T E R L. I N T R O D U C T I O N
T H E POLYOLEFINS BUSINESS IS A COMMODITY MARKET WHERE PROFIT CAN B E M A D E ONLY BY
M A S S PRODUCTION. I N ORDER TO MAINTAIN A FINANCIAL PERFORMANCE, THE COMPETITIVE
STRATEGY IS TO DEVELOP TECHNOLOGICAL INNOVATIONS AND FASTER CHARACTERIZATION
TECHNIQUES, SO THE POLYOLEFINS CAN B E PROCESSED FASTER AND SOLD AT HIGHER PRICES.
HOWEVER, ANY INNOVATION REQUIRES LARGE AMOUNTS OF POLYMER IN ORDER TO DETERMINE
ITS PERFORMANCE IN THE PROCESSING LINES.
T H E MANUFACTURING PROCESS OF POLYMERS HAS A LARGE INFLUENCE ON THE RESULTING
MECHANICAL A N D OPTICAL PROPERTIES OF THE END PRODUCT. FOR INSTANCE, DIMENSIONAL
STABILITY IN PRECISION INJECTION MOLDING OR YIELD STRENGTH, YOUNG'S MODULUS AND E V E N
TEAR STRENGTH OF BLOWN FILMS ARE AFFECTED BY THE VISCOELASTIC PROPERTIES OF THE
POLYMER MELT.
THEREFORE, A NECESSARY REQUIREMENT IN THE DESIGN OF POLYMER PROCESSING
OPERATIONS IS A FUNDAMENTAL UNDERSTANDING OF THE RHEOLOGY OF THE POLYMER MELT.
T H E N , THE INDUSTRY NEEDS BOTH ABSOLUTE QUANTITATIVE INFORMATION A N D ALSO
INEXPENSIVE TESTING FOR MULTIPLE SAMPLES IN ORDER TO UNDERSTAND POLYMER MELT'S
BEHAVIOR. T H E DIFFICULTY IN RECOVERING RESEARCH AND DEVELOPMENT COSTS HAS M A D E
S O M E PRODUCERS TO THINK ABOUT MODELING POLYMER PROCESSES TO UNDERSTAND AND
ESTABLISH THE PROCESSABILITY OF A NEW POLYMER. THEREFORE, EXPERIMENTATION D E M A N D S
THE GREATEST QUANTITY OF ACCURATE INFORMATION AT A M I N I M U M COST IN ORDER TO HAVE A
FAST R O I REGARDING THE RESEARCH A N D DEVELOPMENT COSTS A N D TO B E ABLE TO INCREASE
THE MARKET SHORE.
RESEARCH A N D DEVELOPMENT DEPARTMENTS HAVE CONSIDERED THAT THE THEOLOGICAL
MODELS (CONSTITUTIVE EQUATIONS) ARE VERY IMPORTANT BECAUSE THEY COULD PREDICT MELT
FLOW BEHAVIOR IN A WIDE RANGE OF DEFORMATION HISTORIES; HOWEVER, THE USEFULNESS OF
polymer systems with as few adjustable parameters as possible. In addition, to
simulate polymer melt processing realistically, the model must be able to describe
material behavior in the linear and in the nonlinear regime. Particularly, the study
of the elongational behavior is very important because the flow behavior of polymer
melts in economically important processes like fiber spinning and film blowing is
governed rather by elongational than by shear properties of the melt. Furthermore,
processes such as extrusion, though primarily governed by shear properties, may
also be influenced by elongational properties. (Laun, 1976).
This thesis is a contribution to the predictive modeling of viscoelastic materials.
The PTT model (Phan Thien and Tanner, 1977) and XPP model (Verbeeten, 2001)
are analyzed and evaluated using the experimental data of eight polypropylene
resins. A modified PTT model is proposed as well as an innovative approach using
fractals theory.
A. Problem Statement
Previous work (Mier, 2000) proved that PTT model (Phan Thien and Tanner, 1977)
predicts rheological properties accurately in the steady state, but the predictions in
the transient state are not that accurate. Besides, several authors (Larson, 1987;
Stephenson, 1989) had showed some important limitations for this model. These
limitations of PTT model and other constitutive equations have caused the creation
of new constitutive equations, like the POMPOM model (McLeish and Larson,
2000).
On the other hand, most rheological models use empirical parameters to fit the
experimental data. Those parameters have no theoretical explanation; therefore
the models cannot relate the polymer behavior in extensional flow to their
B. Research Proposal and Objectives
T H E PRIMARY OBJECTIVE OF THIS RESEARCH IS to improve the existing constitutive equations by reducing the number of empirical parameters, to better explain polymer melt's behavior in extensional flow during transient state. IN ADDITION, THERE ARE THE FOLLOWING PARTICULAR OBJECTIVES:
1 . RHEOLOGICAL CHARACTERIZATION OF ISOTACTIC AND SYNDIOTACTIC POLYPROPYLENE RESINS.
2 . IDENTIFICATION OF RHEOLOGICAL DIFFERENCES BETWEEN SIMILAR ISOTACTIC AND
SYNDIOTACTIC RESINS
3 . MODIFICATION OF THE P T T MODEL IN ORDER TO OBTAIN BETTER PREDICTIONS OF
ELONGATIONAL BEHAVIOR OF POLYOLEFINS.
4 . BUILD THE BASIS FOR A NEW MODEL THAT EXPLAINS SATISFACTORILY THE RHEOLOGICAL
BEHAVIOR OF POLYMER MELTS USING FRACTALS THEORY.
C. Justification
THERE ARE SEVERAL RHEOLOGICAL ANALYTICAL TECHNIQUES USED IN THE CHARACTERIZATION OF
POLYMERS, HOWEVER SUCH TECHNIQUES NOT ALWAYS DISCRIMINATE RESINS WITH SIMILAR
QUALITY CONTROL DATA BUT WITH DIFFERENT PROCESSING BEHAVIOR. A N EXAMPLE OF A
TECHNIQUE TYPICALLY USED FOR DISCRIMINATION OF RESINS WITH SIMILAR STEADY STATE
VISCOELASTIC DATA IS THE COGSWELL ANALYSIS. S U C H TECHNIQUE IS TIME CONSUMING,
REQUIRES THE USE OF COSTLY EQUIPMENT AND USES EMPIRICAL PARAMETERS NOT
NECESSARILY RELATED TO TYPICAL MOLECULAR WEIGHT DISTRIBUTION FEATURES. THEREFORE,
THERE IS A NEED FOR A CONSTITUTIVE EQUATION CAPABLE OF PREDICTING THE ELONGATIONAL
TRANSIENT BEHAVIOR OF A POLYMER BASED ON THE FEWEST NUMBER OF STEADY STATE LINEAR
VISCOELASTIC DATA, ON MOLECULAR WEIGHT AND/OR OTHER PHYSICAL PARAMETERS. B A S E D ON
MIER'S ( 2 0 0 0 ) RESULTS, IT SOUNDS REASONABLE TO PROPOSE A MODIFICATION TO THE P T T
It is worth to remember that the PTT model presents a relationship between strain
and elastic energy in addition to the inclusion of a set of multiple relaxation times,
which can easily be obtained in the laboratory.
D. General Methodology
To guarantee the accuracy of the results generated in this project, special care was
taken in materials preparation, standard quality control tests, rheological
techniques and validation of the constitutive equations.
1. Materials Preparation
All resins were prepared using the same conditions and with the same additive
package, so that any variations observed could be associated to changes in the
polymer's molecular structure and MWD and not to other factors.
2. Standard Quality Control Techniques
Information on reproducibility on the quality control techniques was included to
determine if reported differences were significant or not.
3. Rheological Techniques
E. General Organization
This thesis is divided in thirteen chapters, including the present one. Chapter II
presents a literature review as a theoretical background. Chapter III explains the
principles behind the standard quality control techniques and the rheological tests.
The experimental data is presented in Chapters IV through VII. Chapter IV
presents the resins' typical quality control properties (standard properties). Such
properties are the melt flow index (MFI), xylenes solubles percentage analysis
(PS), molecular weight distribution (MWD), differential scanning calorimetry (DSC),
and isotacticity analysis (NMR). Chapter V presents the oscillatory data and
Chapter VI presents the shear and elongational viscosity from capillary data.
Chapter VII presents the creep and recovery compliance experimental data.
Chapter VIII presents the development of the PTT model, as well as its rheological
functions predictions. Chapter IX shows the mathematical modification of the
model and its rheological functions predictions. Chapter X presents the
development of the POMPOM model and its rheological functions predictions.
Chapter XI presents a discussion of results in addition to several empirical
relationships that were found among the rheological parameters and the standard
quality properties. Chapter XII presents a new way of modeling polymer's melt
using a fractals approach. Finally, Chapter XIII presents the conclusions of the
CHAPTER II. Theoretical Background
This chapter presents a complete literature review. It is divided in four sections.
Section A presents an introduction to rheology, section B shows some empirical
models while section C presents constitutive equations, and finally section D
shows an introduction to fractals theory.
In some cases, the nomenclature used by the original consulted articles is changed
to avoid confusions. The reader can look at the nomenclature list given in the first
pages of this thesis.
A. Introduction to Rheology
Rheology is the science that deals with the way materials deform when forces are
applied to them. The term is most commonly applied to the study of liquids and
liquidlike materials such as paint, catsup, oil well drilling mud, blood, polymer
solutions and molten plastics. However, rheology also includes the study of the
deformation of solids such as occurs in metal forming and the stretching of rubber.
(Dealy, 1990).
To learn anything about the rheological properties of a material, w e must either
measure the deformation resulting from a given force or measure the force
required to produce a given deformation. (Dealy, 1990).
There are two principal aspects of rheology. One involves the development of
quantitative relationships between deformation and force for a material of interest.
The information for the development of such a relationship is obtained from
experimental measurements. For a linear elastic material or a Newtonian fluid,
how such material will respond to any type of deformation. Such an equation is
called a "constitutive equation" or a "rheological equation of state". (Dealy, 1990).
The second aspect of rheology is the development of relationships that show how
rheological behavior is influenced by the structure and composition of the material
and the temperature and pressure. Ideally, one would like to know how these
parameters affect the constitutive equation, but this has not been accomplished at
the present time, except for very simple materials such as Newtonian fluids.
(Dealy, 1990).
Molten plastics are Theologically complex materials that can exhibit both viscous
flow and elastic recoil. A truly general constitutive equation has not been
developed for these materials, and our present knowledge of their rheological
behavior is largely empirical. (Dealy, 1990).
1 . S t r a i n a n d S t r e s s T e n s o r s ( B i r d , 1987)
The velocity field for simple shear flow is given by the velocity field:
The velocity field for extensional flows (shear free flows) is given by generalized
forms:
u (2.1)
(2.2)
(2.3)
e(lb)y , (2.4)
where k is the extension rate and b is a constant that is either 0 or 1. When b = 0
and s> 0, the flow is a uniaxial extensional flow. When b = 0 and s< 0, the flow is
an equibiaxial extensional flow. When b = 1, the flow is a planar extensional flow.
In uniaxial extensional flow, the system is stretched along the z axis while it
contracts uniformly along the x and y axis in such a manner that the volume is kept
constant. The elongational (Henky) strain is given bys = e(tt'). In biaxial
extension flow, the differential element is stretched equally along the x and y axis,
but contracts in the z direction. In planar extensional flow, the system is stretched
along the z direction, but is constrained only in the x direction.
The different elongational flows have different effects on the orientation of the
macromolecules, for example the uniaxial extensional flow impart significant
molecular orientation (compared to shear flow), while biaxial extensional flow does
not lead to a strong degree of molecular orientation.
For shear flow, the components of the rate of strain (deformation) tensor are:
(0 1 0\
r , = r ( 0 | i o o
o o o
(2.6)
For extensional (shear free) flow, the components of the rate of strain tensor are:
v . . = ' IJ
(i(l + b) 0 0\
0 -e(lb) 0
0 0 2s
(2.7)
*"= + P
T = " yx
0
T„+P
0 >
0 ( 2 . 8 )
F o r a v i s c o e l a s t i c f l u i d i n extensional f l o w , t h e c om p one nt s o f t h e s t r e s s t e n s o r a r e :
r =
0 0 r^+p
( 2 . 9 )
wh e r e p i s t h e i s o t r o p i c p r e s s u r e . F o r N e w t o n i a n f l u i d s , RXX = RYY=TZZ= 0 .
S o m e o t h e r c o n t i n u u m m e c h a n i c s t e n s o r s c o m p o n e n t s f o r s h e a r a n d s h e a r f r e e
f l o w s c a n b e f o u n d i n a p p e n d i x C o f t h e m on og r a ph y b y B i r d e t a l . ( 1 9 8 7 ) .
2. Ma t e r i a l s F u n c t i o n s
T he s t r e s s e s t h a t a r e c u s t o m a r i l y u s e d w i t h shear flow a r e :
v =-r
\(y)yyx>
• , 2
( 2 . 1 0 )
( 2 . 1 1 )
( 2 . 1 2 )
w h e r e */y; a n d v2(y) a r e t h e f i r s t a n d s e c o n d n o r m a l s t r e s s c o e f f i c i e n t s ,
r e s p e c t i v e l y .
=-i]I(e,b)k,
(2.13)
T„-xa=n2(i,b)i, (2.14)
where
nj(i,b) and ri/e.Ajare shear free viscosity functions. For the special casewhen b = 0, rf2 (i,o)=o, and r\, (k,o) is equal to the elongational viscosity:
ri.fi) = Hj(kfl), (2.15)
n2(k,u) = o. (2.16)
For
i>o,
r)
edescribes elongational flow, and for
k
<o,
r\
edescribes biaxial
stretching.
3. Convected Derivative Tensors
It is important to define some tensors used frequently in constitutive modeling:
Velocity gradient tensor. Vo (217)
Rateofstrain tensor: y = Vo+ (Vo)' (2.18)
Vorticity tensor. m = Vu (Vo)' = 2 Vo y (2.19)
First rateofstrain tensor. y( i ) = y (2. 20)
Nth rateofstrain tensor y(n+1) = ~^yin) {(Vo)' • y( n ) + y( n ) • (Vo)} (2. 21)
Contravariant convected time derivative of the stress tensor:
Finger strain tensor
Cauchy finite strain tensors:
B(r,t,t') = {EE'}, B1
(r,t,t') = {At
A},
(2. 24)
(2. 23)
Relative finite strain tensors: y[0]
(r, t,t') = JA' • A) 8,
y[0](r,t,t') = 6{EE'},
(2. 25)
(2. 26)
First scalar invariant of the Finger strain tensor: U =
Second scalar invariant of the Finger strain tensor
li = \rB
(2. 27)
/^(l/^KtrSftrCB
2)],
Third scalar invariant of the Finger strain tensor l
h
3 =<=det
B,
(2. 28)
(2. 29)
where 4,y are measures of the displacements at time
f
relative to the positions at
time
t,
whereas £# are measures of the displacements at time
t
relative to the
positions at time
f,
and 8 is the unit tensor. Whenever components of
A, E, y
[0],
and
y
[0]the reader can find complete tabulations for general deformations in
rectangular, cylindrical, and spherical coordinate systems in appendices B and C of
Bird et al. (1987) work. In addition, appendix C of the same work (Bird et al. 1987)
gives expressions for
A, E, y
l0], y
[0], I
2,
and
h
in rectangular coordinates worked
out specifically for simple shear flows and for shearfree flows.
5 . Measurements and Empirical Models
1. Die Swell
A viscoelastic correlation can be useful for estimating the extrudate swell, which is
the recovery expansion that a polymer exhibits on leaving a die. It has been
suggested that die swell can be correlated to the primary normal stress difference
Ni and to the shear stress at the wall,
r
w.
The most common is that proposed by
2 i l / 6
I & L
I
( 2 . 3 0 )A* J
J
w he r e D p i s t h e d i a m e t e r o f t h e e x t r u d a t e a n d D 0 i s t h e c a p i l l a r y d i a m e t e r . T h e
c a p i l l a r y d i e s w e l l , B , i s a l s o a f u n c t i o n o f t h e c a p i l l a r y L / D0, t h e e n t r a n c e g e o m e t r y ,
t h e e x i t g e o m e t r y , t h e t i m e a f t e r a f l u i d e l e m e n t l e a v e s t h e d i e , t h e t i m e r e q u i r e d f o r
t h e m e l t t o p a s s t h r o u g h t h e d i e , a n d t h e l o n g e s t r e l a x a t i o n t i m e (X) o f t h e f l u i d ( B a i r d , 1 9 9 8 ) .
B = —p
= 0.\ +
2 . P ol id is p e r s i t y I n d e x
Z e i c h n e r a nd P a t e l ( 1 9 8 1 ) f o u n d t h a t t h e b r e a d t h o f t h e M W D ( P D I ) f o r a f a m i l y o f
p o l y p r o p y l e n e r e s i n s w a s r e l a t e d t o t h e v a l u e o f t h e c r o s s o v e r m o d u l u s G c ; w h i c h
i s t h e v a l u e o f G ' a n d G" a r e e q u a l a t t h e c r o s s o v e r f r e q u e n c y a >c
P D I
= r ( 10
J 1 P (2 3 1 )
S h a n g ( 1 9 9 3 ) q u e s t i o n e d t h e Z e i c h n e r P a t e l c o r r e l a t i o n a r g u i n g t h a t t h e c r o s s o v e r
p o i n t i s s e n s i t i v e t o t h e s t r a i n a t w h i c h t h e o s c i l l a t o r y d a t a i s o b t a i n e d . H e
s u g g e s t e d u s i n g 5 % s t r a i n f o r r e s i n s w i t h M F I > 3 0 a n d 1 5 % f o r r e s i n s w i t h M F I <
3 0 .
C h a m b o n ( 1 9 9 5 ) u s e d t h e Z e i c h n e r P a t e l c o r r e l a t i o n a n d f o u n d t h a t i t p r e d i c t e d
t h e s a m e P D I f o r s e v e r a l r e s i n s , w h i l e t h e G P C d a t a r e p o r t e d d i f f e r e n t P D I v a l u e s
f o r t h o s e r e s i n s . T he y s u g g e s t e d e s t i m a t i n g P D I b y t h e r e c i p r o c a l o f t h e s l o p e o f
p l o t s o f t a n 5 v e r s u s f r e q u e n c y . Th e P D I s h o u l d b e e s t i m a t e d f r o m s p e c i f i c r e g i o n s
o f t h e p l o t : f o r r e s i n s w i t h M F R < 8 , t h e s l o p e i n t h e r e g i o n 1 < t a n 8 < 4 s h o u l d b e
3 . S T E A D Y S H E A R P R O P E R T I E S
D Y N A M I C OSCILLATORY PROPERTIES ARE EASIER TO MEASURE AND CAN B E OBTAINED OVER A
WIDE RANGE OF FREQUENCIES COMPARED TO THE RANGE OF SHEAR RATES THAT CAN B E
OBTAINED USING A RHEOMETER. WITH THE FOLLOWING RELATIONS, IS THEN POSSIBLE TO OBTAIN
STEADY SHEAR RHEOLOGICAL DATA FROM LINEAR VISCOELASTIC DATA OVER A W I D E RANGE OF
SHEAR RATES.
IT HAS B E E N OBSERVED EXPERIMENTALLY FOR M A N Y POLYMERS THAT THE MAGNITUDE OF THE
COMPLEX VISCOSITY, AND THE SHEAR VISCOSITY ARE IDENTICAL (AT LEAST FOR FLEXIBLE
POLYMERS) IF THEY ARE EVALUATED AT THE S A M E VALUES OF A AND Y. T H I S RELATION IS
KNOWN AS THE COXMERZ RULE ( C O X AND MERZ, 1 9 5 8 ) .
T| ( & )
(oy
1 + R\"(<O)
0.5
( 2 . 3 2 )
WHERE RJ'(CO) AND RI"(CO) ARE THE COMPONENTS OF THE COMPLEX VISCOSITY RF((O).
A SECOND, NO LESS IMPORTANT, COXMERZ RULE RELATES THE SLOPE OF THE VISCOSITY CURVE
TO THE D Y N A M I C VISCOSITY ( C O X AND MERZ, 1 9 5 8 ) :
DRYX(F)
DF
( 2 . 3 3 )
L A U N ( 1 9 8 6 ) PROPOSED A RELATIONSHIP BETWEEN THE FIRST NORMAL STRESS COEFFICIENT AND
THE STORAGE AND LOSS MODULUS:
G
CO
1 + G"
0.7
2TVW
CO 7 +
0.7
( 2 . 3 4 )
A N ALTERNATIVE FORM RELATING THE MECHANICAL LOSS ANGLE AND THE INPHASE COMPONENT
OF THE COMPLEX VISCOSITY IS ( L A U N , 1 9 8 6 ) :
VF
1( R ) =
2rj"(secS)
lA
(o\
( 2 . 3 5 )4 . T I M E T E M P E R A T U R E S U P E R P O S I T I O N P R I N C I P L E
MATERIAL FUNCTIONS (RHEOLOGICAL PROPERTIES) TAKEN AT SEVERAL TEMPERATURES CAN B E
BROUGHT TOGETHER ON A SINGLE MASTER CURVE. T H I S SIMPLIFIES THE DESCRIPTION OF THE
EFFECT OF TEMPERATURE A N D IT M A K E S POSSIBLE TO PRESENT THE MATERIAL FUNCTION IN A
M U C H BROADER RANGE OF T I M E OR FREQUENCY THAN CAN EVER B E MEASURED AT A SINGLE
TEMPERATURE. T H I S PRINCIPLE IS N A M E D
TimeTemperatureSuperposition
( T T S ) A N DIS USEFUL FOR THE ANALYSIS OF NONISOTHERMAL FLOWS AS HAPPENS, FOR E X A M P L E , IN
INDUSTRIAL MELT SPINNING.
T H E LINEAR VISCOELASTIC BEHAVIOR OF A POLYMER MELT CAN B E DESCRIBED USING A MODEL
M A D E OF N MAXWELL ELEMENTS IN PARALLEL. E A C H OF T H E M IS DEFINED BY THE RIGIDITY OF
THE SPRING GJ A N D THE RELAXATION TIME h WHICH IS THE RATIO BETWEEN THE VISCOSITY OF
THE DASHPOT A N D THE RIGIDITY OF THE SPRING (A.,. = t i,./G,.). SUCH MODEL IS CALLED THE GENERALIZED MAXWELL MODEL AND THEIR x, AT A DIFFERENT TEMPERATURE T ARE RELATED TO
THE REFERENCE TEMPERATURE T0:
WHERE aT)s CALLED THE HORIZONTAL SHIFT FACTOR. T H E COEFFICIENTS G, ARE ALTERED BY A
CHANGE IN TEMPERATURE BY:
USING THE ABOVE TWO RELATIONSHIPS, THE RELAXATION MODULUS OF THE GENERALIZED
XJTJa^fTJ
( 2 . 3 6 )G(t,T) = ^f
AG
i(T
0)exp[t/{^(T
0)a
T)}
(2. 38)
Defining
G
r(t)=G(t,T)T
op
0/Tp
andT •t
r=t/a
G(t
r)^G,(T
0)ex
P\t
rfk,(T
0)\
(2. 39)
Thus, if Gr is plotted as a function of tr, the data taken at various temperatures
should fall on the same master curve as those taken at the reference temperature
T0.
All
linear
viscoelastic properties obey a timetemperature superposition principle. Itis found that the shift factor is given by:
r
\o
(TJTp
Since the ratio
r
op
0iTp
has almost no change at ordinary temperature ranges.a
(2. 41)Two types of exponential functions have been used for describing the temperature
dependence of aT. The WLF equation (Hamed, 1988) holds in the range of
temperatures Tg to Tg + 100 °C, where Tg is the glass transition temperature for
the polymer.
a
T =^(T)
=C,(TTJ
n
0(T
0) c°
+(TTj'
WHERE C° =9UO/c°2 AND c°2 =51.6 + (TO TG).
FOR TEMPERATURES GREATER THAN T G + 1 0 0 ° C , THE ARRHENIUSTYPE EQUATION (MAVRIDIS
ET. AL., 1 9 9 2 ) IS USED:
WHERE E H IS THE HORIZONTAL ACTIVATION ENERGY FOR FLOW.
SIMILAR EQUATIONS TO 2 . 3 9 CAN B E OBTAINED FOR OTHER MATERIAL FUNCTIONS (DEALY,
1 9 9 0 ) :
WHERE G ^ A N D GR HAVE THE S A M E RELATIONSHIP TO THE STORAGE MODULUS G ' AND THE
LOSS MODULUS G " AS GR HAS TO G .
IF THE RATIO 7 >0/ 7 P VARIES LITTLE WITH TEMPERATURE, SUPERPOSITION CAN OFTEN B E
ACCOMPLISHED BY PLOTTING: G(T) VERSUS t LAT, G ' ( © ) VERSUS &AT, G"(<O) VERSUS &AT,
r\'(&)/AT VERSUS COAR, r\"((O)/AT VERSUS COAR, J(T) VERSUS tLAT.
5 . V I S C O S I T Y M O D E L S
EQUATIONS FOR MODELING VISCOSITY FUNCTIONS HAVE B E E N PROPOSED BY SEVERAL AUTHORS,
A N D ARE S U M M A R I Z E D IN DARBY ( 1 9 7 6 ) AND IN DEALY AND WINSBURN ( 1 9 9 0 ) :
T > T G + 1 0 0 ° C ( 2 . 4 3 )
( 2 . 4 4 )