materials
ISSN 1996-1944 www.mdpi.com/journal/materials Article
Preparation and Characterization of Cu and Ni on Alumina
Supports and Their Use in the Synthesis of Low-Temperature
Metal-Phthalocyanine Using a Parallel-Plate Reactor
Fernando Sánchez-De la Torre 1, Javier Rivera De la Rosa 1,2,*, Boris I. Kharisov 1 and Carlos J. Lucio-Ortiz 1
1 Universidad Autónoma de Nuevo León, UANL, Facultad de Ciencias Químicas, Ave. Universidad S/N, Cd. Universitaria, San Nicolás de los Garza, N. L. 64451, Mexico;
E-Mails: [email protected](F.S.-D.T.); [email protected] (B.I.K.); [email protected] (C.J.L.-O.)
2 Universidad Autónoma de Nuevo León, UANL, Centro de Innovación, Investigación y Desarrollo en Ingeniería y Tecnología (CIIDIT), Km 10 de la nueva carretera al Aeropuerto Internacional de Monterrey, PIIT Monterrey, Apodaca, Nuevo León 66600, Mexico
* Author to whom correspondence should be addressed; E-Mail: [email protected]; Tel.: +52-818329-4000 (ext. 6281); Fax: +52-818329-4000 (ext. 6282).
Received: 20 August 2013; in revised form: 17 September2013 / Accepted: 23 September 2013 / Published: 30 September 2013
Keywords: Ni/Al2O3; Cu/Al2O3; phthalocyanine; phthalonitrile; Ni-phthalocyanine; Cu-phthalocyanine; parallel-plate reactor
Nomenclature
CAin Concentration of A entering the channel (mol/dm3)
CAout Concentration of A exiting the channel (mol/dm3)
CAs Concentration of A on the washcoat surface (mol/dm3)
CAw Concentration of A in the washcoat bulk (mol/dm3)
CAB Bulk concentration of A in the fluid phase (mol/dm3)
She External Sherwood number
Shi Internal Sherwood number
ϕ Thiele modulus
z Channel height (dm)
Ω1, Ω2 Cross-sectional domain of the fluid phase and washcoat
Ω , Ω Effective transverse diffusion length for the fluid phase and washcoat
(=AΩ/PΩ) (dm)
Cs Concentration at the surface (mol/dm3)
R(Cs) Reaction rate by reactor volume (mol/dm3-s)
De Effective diffusivity (dm2/s)
R(C´) Reaction rate by catalyst volume (mol/dm3-s)
ε Porosity of the catalyst in the tubular reactor
τ Tortuos ity of the pores of the catalyst Dp Diffusion coefficient in the pores (m2/s)
DK Knudsen diffusion coefficient (m2/s)
dp Average pore diameter (m)
DAB Molecular diffusivity of specie A in solvent B (dm/s2)
φ Association factor for the solvent, 1.5 for ethanol as a solvent. M Molar mass of the diffusing species (g/mol)
T Temperature of the diffusing species (K) MB Molar mass of solvent (g/mol)
μ Solution viscosity (g/dm-s)
νA Molar volume of the solute in the normal boiling point (dm3/mol)
Shapp Experimentally observable Sherwood number
L Length/distance along the monolith channel
Sh(L) Sherwood number as function of length/distance along the monolith channel P Transverse Peclet number
Sc Schmidt number (=ν/DB) υ Kinematic viscosity (dm2/s)
Dh Channel hydraulic diameter (=4 Ω )
She∞ Asymptotic external Sherwood number
Λ Constant for the calculation of the internal Sherwood number Concentration of A at time zero (mol/dm3)
x Fraction conversion at time t gcat Grams of catalyst
νreactor Volume of reactor (dm3)
ρB Bulk density of catalyst charged by reactor volume (gcat/νreactor)
Ao Pre-exponential constant in second-order kinetics (dm3/mol2-s)
Ea Activation energy in second-order kinetics (J/mol)
t Elapsed reaction time (s)
− ′ Surface reaction rate (mol/s-g cat)
FAo Molar flow of A (mol/s)
Wcat Weight of catalyst (g)
k Kinetic constant of surface reaction of Langmuir-Hinshelwood expression (dm3/s-gcat)
KA
Equilibrium constant for adsorption of Langmuir-Hinshelwood expression (dm3/mol)
k0 Pre-exponential constant of Arrhenius expression for k (dm3/s-gcat)
EaP-PR Activation energy of Langmuir-Hinshelwood expression for parallel-plate
reactor (J/mol)
∆ Change standard enthalpy of adsorption (J/mol)
∆ Change standard entropy of adsorption (J/mol-K) Standard total entropy of adsorption (J/mol-K) Standard total entropy in the fluid phase (J/mol-K)
1. Introduction
milder conditions (<130 °C). Further decreasing the temperatures to ambient conditions would yield energy savings when using this precursor to produce phthalocyanine, which would offset its high cost.
In the typical synthesis of copper phthalocyanine (CuPc), phthalic anhydride, urea, and copper (I) chloride are heated in a batch reactor system at a ratio of 1:16:16, respectively, in a high-boiling-point solvent, such as trichlorobenzene, nitrobenzene, or kerosene. The solvent is removed after the formation of copper phthalocyanine [11].
Depositing copper and nickel particles on alumina supports on parallel plates to react with the fluid-phase phthalonitrile in the reactor parallel plates has the advantage of eliminating the need to separate the solid products (NiPc or CuPc) from the metal-alumina solid.
Our research group has, thus far, reported the synthesis and characterization of Cu and Ni supported on alumina and their reaction at only one temperature, in flasks, to produce NiPc and CuPc at low temperatures [12]. It is important to replicate the synthesis of metallic particles, since this time the morphological changes can influence on the new arrangement of the reactor, which is continuous flow, as the particles are supported on the parallel plates. Due to the promising results obtained in that study, the process should be scaled up to a flow reactor before improving the material. Catalyst systems are encountered in a wide variety of designs, and catalysts (e.g., pelletized catalysts) can serve as their own support material. However, the mass-transfer resistance is significant in large particles, and a significantly larger pressure drop is experienced in a fixed bed of smaller particles. In the reactor presented in this work, the effect of mass transfer in a parallel-plate system, which may reduce the surface reaction, must be evaluated.
1.1. Three-Resistance Mass-Transfer Model
Recently, Joshi et al. [13,14] reported the use of internal mass-transfer coefficients in the modelling of the diffusion and reaction in catalytic monoliths; a three-resistance model is more useful and important than the classical effectiveness-factor concept. They considered various washcoat and channel geometries, including parallel plates.
Figure 1 (adapted from reference 13) presents a control volume that represents the concentration profile of substance A; which is a reagent that enters the channel with an inlet concentration, CAin; and
exits with a lower concentration, CAout, by reaction conversion. As evident in the figure, the
concentration on the surface, CAs, is the first real contact between substance A and the catalyst material
that can find an active site; substance A can then be introduced by diffusion into the material interface and is later considered to internally diffuse and react in the bulk catalyst at a constant concentration of CAw. The three resistances are defined as follows. The first resistance is an external resistance that is
driven by the difference in the surface concentration (CAs) and the bulk concentration of species A in
the fluid phase (CAB), which is the average of CAin and CAout. The second resistance occurs at the
interface, which is defined by the surface at some depth within the catalytic material that contains a concentration profile between CAs and the concentration in the bulk catalyst (CAw). The third resistance
Figure 1. Schematic diagram of the control volume that illustrates the fluid-solid mass transfer during a chemical reaction in the washcoat with resistances using a series approach.
The Thiele modulus (ϕ), which is the ratio of the intra-particle diffusion time to the characteristic reaction time, was used to study the changes in the resistances. The generalized Thiele modulus was calculated in this work, which Petersen [15] defined for a single-step irreversible reaction as follows:
=2 Ω ´ (1)
1.2. Effective Diffusivity
Measurements of the effective diffusivity in the catalytic washcoat, via measurements of the pore size distribution and the respective pore volume in the structure, were necessary to utilize the models. The effective diffusivity is usually related to the diffusion coefficient in the pores via the porosity of the solid, ε, and the tortuosity of the pores, τ. The parallel-pore model represents a general relationship between the effective diffusivity and the pore diffusivity. Zhang et al. [16] demonstrated that the one- and two-dimensional mathematical models used to calculate the effective diffusivity in the catalyst/washcoat layer are applicable to a porous monolith support, e.g., cordierite.
CAs
<CAw> CAB
Δz
z z+Δz
Main bulk of fluid phase
CAin Inlet of channel
washcoat
Iron plate
CAout
Outlet of channel
External mass transfer
Internal diffusion and
reaction
Liquid film
Concentration profile (Approx.)
Concentration profile (Actual)
Interface 4
1 ℎ Internal Resistance Resistances
in Series
4 2
Bulk Reaction Resistance 1
= ε
τ (2)
The diffusion coefficient in the pores, Dp: can be determined from the Knudsen diffusion
coefficient, DK, and the bulk diffusion coefficient, DAB: 1
= 1 + 1 (3)
DK depends on the temperature, the molar mass of the diffusing species and the pore diameter, dp.
Therefore, a narrow pore-size distribution is important:
= 48.5 (4)
The value of DAB in a liquid system can usually be calculated by
= 117.3 × 10
.
μ υ . (5)
In their report on catalyst-coated monoliths, Kolaczkowski et al. [17] noted that a parallel model provided tortuosity factors of 8.5 and 8.1, and used a chromatographic method to evaluate the effective diffusivity in a monolith. They used a tortuosity factor of 6 and a washcoat porosity (ε) of 0.67. In this work, De was evaluated using Equations (2)–(5) for the Ni and Cu particles on alumina powder
(catalyst washcoat) coated on the iron plates of a parallel-plate reactor. The Ni/Al2O3 and Cu/Al2O3washcoats were assumed to have pore diameters of 8.8 and 6.0 nm, respectively. However, the pore size of the washcoat material, as evaluated by scanning electronic microscopy (SEM), must be considered; the values of μ = DAB /DB ranged from 12.749 to 12.752 for temperatures ranging from 30
to 50 °C when ε = 0.67 and τ = 8.5. The μ relationship affects the reaction and internal mass-transfer resistances.
1.3. Mass-Transfer Resistances
As evident from Figure 1 and the different Sherwood (Sh) numbers in Equation 6, the mass transfer is considered to be a series of resistances:
1
ℎ
=
1
ℎ
+
μλ
4
1
ℎ
+
μλ
4ϕ
(6)ℎ = 1.4 ⁄ ⁄ = 0.35 ⁄
⁄ ⁄
ℎ∞
> 0.51 ℎ ∞ ⁄
< 0.51 ℎ ∞ ⁄ (7)
Joshi et al. [13] used an expression that related the Sherwood number to the internal resistance (Shi)
and the Thiele modulus ( ), as shown in Equation 8:
ℎ = ℎ∞+1 + (8)
The constant Λ depends of the washcoating geometry and the kinetic parameters. Joshi et al. [13,14] presented a table that lists the numerically computed values of Shi∞ and the constant Λ for various
washcoat-channel geometries for the case of first-order kinetics. Notably, Shi = Shi∞ for a slow
reaction (ϕ << 1) in Equation 7. Based on Equations 6–8, Shi can be combined with the traditional
external mass-transfer coefficient (She) to obtain the overall mass-transfer coefficient (Shapp), which is
an experimentally measurable quantity that depends on the catalyst activity profile, the washcoat and channel geometries, and the species diffusivities in the fluid phase and washcoat.
The third term on the right side of Equation 6 refers to the bulk reaction resistance, which depends on the internal diffusion, the reaction and the square of the Thiele modulus. The square of the Thiele modulus is the ratio of two characteristic times: the diffusion and reaction times. When the Thiele modulus is large, internal diffusion usually limits the overall rate of reaction; when 12 is small, the surface reaction is usually rate-limiting. In this work, the Thiele modulus was calculated using Equation 1.
This study used the phthalonitrile conversion experimental data of the batch reactor for both materials, Ni/ and Cu/Al2O3, at 30, 40, and 50 °C to determinate a simple kinetic model and its parameters. The kinetic model was used to calculate the Thiele modulus in the washcoat channel of the parallel-plate reactor experiments.
This work aimed to correlate the characterisation of Ni and Cu nanoparticles supported on alumina with their use in a new parallel-plate reactor arrangement to produce Ni and Cu phthalocyanines at low reaction temperatures (≤60 °C) using phthalonitrile in an ethanol solution. Furthermore, this study evaluated the mass transfer using the new three-resistance model. Finally, the kinetic data from parallel-plate reactor tests were studied using a Langmuir-Hinshelwood mechanism to better understand the surface reaction by analyzing the kinetic parameters.
2. Results and Discussion
2.1. XRD Patterns
this work) on alumina, which indicates a weak interaction with alumina [19]. The reduction temperature for our sample (Ni/Al2O3) was 350 °C, suggesting that many Ni and NiO particles were available on the surface. NiO nanoparticles deposited on mesoporous surfaces have been used in liquid-phase catalytic reactions for compounds such as ortho-aminophenol and have exhibited a high affinity to adsorption due to the adjacency of the amino and hydroxyl groups [20]. This work used phthalonitrile, which contains two adjacent nitrile groups. The formation of nitrile groups is favored on NiO particles [21] and can result in an adsorption-desorption equilibrium.
Figure 2. XRD patterns of prepared powders of (a) Ni; and (b) Cu particles on alumina.
The sample of copper on alumina (Figure 2b) contained an elemental copper crystalline phase (JCPDS 04-0836) but no oxide copper crystalline species. The maximum diffraction peak (2θ = 43.30°) of the Cu crystalline phase presented a high number of counts, indicating a high crystallinity. The γ-Al2O3 crystalline phase (JCPDS 01-074-2206) was detected for the alumina support of both samples. However, this crystalline phase of alumina is known to have catalytic properties due to its mesoporosity and acid active sites, such as Brönsted and Lewis acids, which are necessary in certain reactions to achieve skeletal rearrangements [22], although they may be somewhat inhibited by depositing Ni and Cu particles. A mesoporous structure promotes percolation by increasing the permeability; as such, a significant amount of reactant can be diffused well into the particle interior to reach the active sites [9,23], e.g., phthalonitrile reaching the nickel or copper particles in this study.
2.2. SEM Images
150 to 600 nm in size and corresponded to NiO species [24]. The other type of nickel particles were much smaller in size (approximately 30 to 80 nm) and showed a poorly defined morphology. This type corresponded to elemental Ni [25], and these nanoparticles were incorporated into upper alumina and NiO grains to form agglomerates of up to 1 μm in diameter.
The micrograph of the Cu/Al2O3 sample (Figure 3b) shows the alumina grains with the copper particles, which displayed the same morphology as the nickel sample. The nanometric (~70–150 nm) elemental copper particles were present as individual particles and as agglomerations (1–1.5 μm) on the alumina support. Their dispersion was better than that of the Ni/Al2O3 sample. The mean size of crystallite was determined from the line broadening of the XRD peak of Cu (111) (2θ = 43.30 in Figure 2) using the Scherrer Equation [26], which yielded a value of 169 nm. This finding supports the general observation that individual metallic copper particles dispersed on supports usually have crystallite sizes similar to the mean particle size [27,28].
Figure 3. SEM micrographs of (a) Ni; and (b) Cu particles on alumina.
2.3. Textural Analysis from N2 Isotherms
uniform. This uniformity is very important to the phthalonitrile reactant in ethanol solution, which can then easily and homogeneously contact the elemental nickel and include it in the cyclization reaction.
Figure 4c shows the adsorption-desorption isotherm for the Cu/Al2O3 sample. Although the same weight percentages of copper and nickel were deposited on the alumina. Figure 4c clearly shows that less nitrogen was adsorbed on Cu/Al2O3 than on Ni/Al2O3 (60 and 170 cc/g, respectively). This finding can be attributed to the good surface coverage of alumina and the pore blocking due to the nanometric size and homogeneous morphology of some pure copper particles observed in the SEM images and XRD pattern. The IUPAC classifies the adsorption curve as type IV and the hysteresis loop type as H3, which is similar to the Ni/Al2O3 case. The PSD shows (Figure 4d) the absence of pores smaller than 35 Å. The most prevalent pore size was 65 Å, few pores were greater than 200 Å. γ-Alumina typically presents a mixture of mesopores and macropores [30]; apparently, the copper particles blocked the macropores and some larger mesopores (500 to 200 Å), leaving the smaller mesopores sufficiently accessible for the percolation of reactants.
Figure 4. Adsorption-desorption isotherms of (a) Ni/Al2O3; (c) Cu/Al2O3; and the PSD of (b) Ni/Al2O3; and (d) Cu/Al2O3.
Table 1 reports the microstructural porosity properties of both samples, and shows the mean size of crystallite calculated with the Scherrer Equation for both metals deposited on alumina. The specific area calculated by the Brunauer, Emmett, and Teller (BET) method for both samples proves that the mixture of NiO and Ni particles in the Ni/Al2O3 sample provided a greater available area than the nanosized copper particles in Cu/Al2O3. The reported pore size corresponds to the PSD mode (Figure 4b,d).
0 20 40 60 80 100 120 140 160
0.0 0.1 0.2 0.3 0.4 0.5 0.6 0.7 0.8 0.9 1.0
V(cc/g) p/pº
a
0.E+00 1.E-01 2.E-01 3.E-01 4.E-01 5.E-01 6.E-011 10 100 1000 10000
D
v (log
d)
[cc/g]
Pore diameter (Å )
b
0 10 20 30 40 50 60 70 800.0 0.1 0.2 0.3 0.4 0.5 0.6 0.7 0.8 0.9 1.0
V (cc/g) p/pº
c
0.E+00 5.E-02 1.E-01 2.E-01 2.E-011 10 100 1000 10000
D
v (log
d)
[cc/g]
Pore diameter (Å )
The interaction of the phthalonitrile solution in alcohol with the nickel sample was expected to be better than that with the copper sample; however, the reaction rate depends on more than just the adsorption and permeability (amount of fluid penetrating through a structure). In this case, the metal particles also acted as a reactant to produce the MPc. As the crystallite size of nickel was smaller than that of copper according the XRD patterns, the use of nickel may be advantageous.
When metallic particle is used in the reaction, the reaction must be initiated by a nucleophilic attack on one of the phthalonitrile moieties, after which the Cu or Ni atom oxidizes to an ion species and contributes two electrons to the bond formation [31]. As this nucleophile is regenerated at the end of the reaction, it is only needed in catalytic amounts. In this work, the nucleophile was CH3ONa.
Table 1. Characteristics of nickel and copper particles deposited on alumina samples.
Sample Mean size of crystallite
of pure metal (nm) ABET (m
2/g) BJH desorption pore size, mode (Å)
Ni/Al2O3 46.92 88.06 88.06
Cu/Al2O3 169.26 43.01 60.57
2.4. Kinetic Model in the Reaction Batch Reactor
The experimental data for the reaction performed in a batch reactor were used to determine a kinetic expression for the reaction. The conversion data for a synthesis of acid phthalocyanine (H2Pc), which used phthalonitrile/ethanol on natural zeolites, were analyzed in a previous study to deduce a second-order reaction [9]. In this work, the first- and second-order reaction rate expressions were fitted to the reaction data of batch experiments. The best fit was achieved for second-order reaction kinetics. Equation 9 shows the second-order expression.
1
1 − = exp − (9)
Table 2 compiles the activation energies of both materials studied in the second-order kinetic expression. The activation energies for both metals were low, indicating that a transport mechanism was more prevalent than an entirely reactive mechanism [32]. However, low activation energies have also been reported for cyclization reactions [33] and the low conversion of acid phthalocyanine formation after 24 h [9], which agrees with the experimental conversion data obtained in this work (Table 2). Interestingly, both activation energies were very similar, but the pre-exponential value for Ni/Al2O3 was four-fold higher than that for Cu/Al2O3. The Ni particles yielded a higher conversion than the Cu particles (Table 2). This improved reactivity can be attributed to the standard electrode potential of Ni2+, which is lower than for Cu2+ ( / = 0.25V / = 0.34 V). Thus, elemental nickel could be easier to oxidize than elemental copper for an oxidizing agent in an ethanolic medium depending on the concentrations.
nitrile group of a second phthalonitrile molecule and, thus, continues to propagate and, thus, form four pyrroles that bond the four phthalonitrile molecules. To regenerate the nucleophile (leaving the cyclic molecule), the metal must be oxidized by either nickel or copper to shear two electrons with two negatively charged nitrogen atoms of two pyrrole groups and form two additional conjugated bonds with the two nitrogen atoms of the other two pyrrole groups. Aravindakshan presented a mechanistic scheme figure [31].
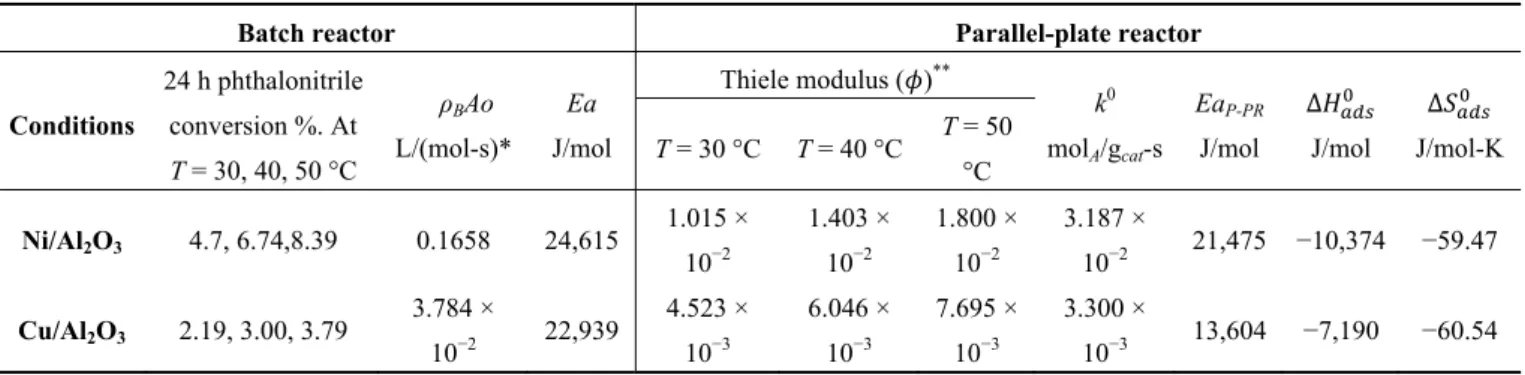
Table 2. Kinetics and mass transfer parameters.
Batch reactor Parallel-plate reactor
Conditions
24 h phthalonitrile conversion %. At
T = 30, 40, 50 °C
ρBAo
L/(mol-s)*
Ea
J/mol
Thiele modulus ( )**
k0 molA/gcat-s
EaP-PR J/mol ∆ J/mol ∆ J/mol-K
T = 30 °C T = 40 °C T = 50 °C
Ni/Al2O3 4.7, 6.74,8.39 0.1658 24,615
1.015 × 10⁻²
1.403 × 10⁻²
1.800 × 10⁻²
3.187 ×
10−2 21,475 −10,374 −59.47
Cu/Al2O3 2.19, 3.00, 3.79
3.784 ×
10−2 22,939
4.523 × 10⁻³
6.046 × 10⁻³
7.695 × 10⁻³
3.300 ×
10−3 13,604 −7,190 −60.54
* Taking ρB = 0.5 gcat/0.125 L; ** Calculate at conversion archived at 24 h.
2.5. Evaluation of the Mass-Transfer Effect
Figure 5 presents a diagram of a parallel-plate channel and the dimensions, taking into account the calculated parameter λ. Figure 6 presents the various resistances included in Equation 6, which considers the mass-transfer phenomena involved in the chemical reaction of the deposition of a washcoat into a channel as a function of the Thiele modulus. In this case, the data for the Ni/Al2O3 washcoat at 30°C were analyzed. The values of λ and μ used were 0.0556 and 12.750, respectively, which indicates that the length scale for the transverse diffusion for the washcoat was 5% of that for the transverse fluid phase and that the bulk diffusion coefficient was 12 times greater than the effective diffusivity (which includes the porosity and tortuosity) over the total cross-sectional area of the porous layer. The external Sherwood number (She) was constant because the Sherwood number depends on
the constant values of Re and Sc and not the Thiele modulus at constant temperatures if the transversal Peclet number (P) is greater than 0.51 ℎ ∞ ⁄ , as is the case here (Equation 7) [18]. Equation 8 was
used to evaluate the internal Sherwood numbers using Shi∞ and Λ values of 3 and 0.32, respectively.
The criteria for the kinetic and mass-transfer control boundaries were the same as those used by Joshi et al. [13].
Figure 5. Dimensions of a channel of parallel-plate reactor with a washcoat applied to calculate the λ parameter. Ω = a; Ω = b – a; and λ = Ω
Figure 6. Overall resistance and its three individual resistances as function of the Thiele modulus and the three controlling regimens. For μ = Df/De = 13.05 and λ = RΩ /RΩ = 0.05.
The Thiele modulus was calculated using Equation 1, and the reaction rates used to compute the Thiele modulus were obtained using the second-order reaction rate model (Equation 9).The kinetic parameters of this model are reported in Table 2. The values of the Thiele modulus at the three temperatures for both washcoat systems (Ni/ and Cu/Al2O3) in a parallel-plate reactor are reported in Table 2. The values of the Thiele modulus for both washcoat materials were less than 10−1, which is representative of slow reactions. As shown in Figure 6, the reaction was kinetically controlled. The kinetics can be evaluated using the experimental data from the parallel-plate reactor tests under the conditions mentioned above.
2.6. Kinetic Model in a Parallel-Plate Reactor
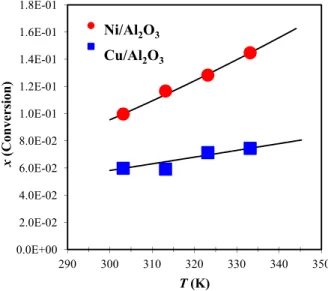
Figure 7 presents the experimental conversion fraction data as a function of the temperature of reaction in a parallel-plate reactor. Taking the phthalonitrile as limiting reagent the percentage of yield at 30, 40, 50, and 60 °C for Cu-phthalocyanine were 5.97%, 5.91%, 7.13%, and 7.45%, and for Ni-phthalocyanine were 9.97%, 11.66%, 12.86%, 14.47%, at 24 hours of reaction. The yields are low, as phthalonitrile initial concentrations were low, but it was important to maintain the same proportions of precursors used in the batch reactor, as the batch kinetic data were used to calculate the Thiele modulus (Equation 1). In other hand, low conversions are very convenient to study the kinetic, since to calculate the surface reaction rate value (− ´ ) it is necessary to use plug-flow design equation as − ´ ≅ / . The experimental conversion data were fitted to a Langmuir-Hinshelwood model via Equation 10 (continue lines in Figure 7).
− ´ =
1 + (10)
The model considers the reversible adsorption of phthalonitrile and the reaction rate on the surface, which is the controlling step. Table 2 presents the reaction rate constant (k) according to the Arrhenius Equation:
ln = ln − (11)
The adsorption constant (KA) was analyzed according to the van’t Hoff Equation:
ln = −∆ +∆ (7)
Figure 7. Conversion fraction at 24 h as a function of the temperature for a parallel-plate reactor for both metals supported on alumina powder adhered to the plates.
The pre-exponential factor, activation energy, standard enthalpy, and entropy properties were used to assess the fit of the constant parameters with the experimental data. Table 2 shows the obtained values. The pre-exponential factor for the Ni/Al2O3 reaction was greater than that obtained for Cu/Al2O3, and its obvious consequence is the higher conversions observed in Figure 7 for Ni/Al2O3. For both metals, the activation energy was lower than that obtained for the batch reactor. However, the values were very similar for Ni/Al2O3, whereas the activation energy for Cu/Al2O3 considerably decreased. The surface reaction on Ni/Al2O3 appeared to proceed similarly for both types of reactors. This similarity was not preserved for Cu/Al2O3. The activation energies remained very low, confirming that the cyclization reaction was slow, which was also indicated by the Thiele modulus.
The changes of standard enthalpy of adsorption for both metals were negative for both metals, confirming an exothermic process. Vannice et al. [34] recommended a set of criteria to validate the thermodynamic properties extracted from the adsorption constant analysis. First, adsorption is invariably exothermic; thus, the enthalpy of adsorption is negative, i.e., ∆ < 0. Second, the entropy must decrease after adsorption, including the dissociative adsorption of a diatomic molecule; thus,
∆ = − , where is the standard total entropy in the liquid phase. As a consequence of these rules, 0 < −∆ < .The value of for phthalonitrile must be approximately 175 J/mol-K because the values for benzene and phthalic anhydride molecules are 173 and 179 J/mol-K,
0.0E+00 2.0E-02 4.0E-02 6.0E-02 8.0E-02 1.0E-01 1.2E-01 1.4E-01 1.6E-01 1.8E-01
290 300 310 320 330 340 350
x
(Conversion)
T(K)
Ni/Al2O3
respectively. Based on the values obtained for both metals, both criteria were satisfied. Phthalonitrile was adsorbed with a greater energy on Ni/Al2O3 than on Cu/Al2O3 because of the standard enthalpy of adsorption, particularly that of NiO. Additionally, the mobility of the adsorbed molecule was similar for both surfaces because of the very similar values of the standard entropy of adsorption. This finding suggests that once the phthalonitrile molecule adsorbed onto the Ni–NiO/alumina or Cu/alumina surface, its mobility depended more on whether the functional groups included the same molecule. Furthermore, nitrile groups had to be available and the aromatic ring had to be adsorbed on the surface to begin to react with the nucleophilic agent (sodium methoxide).
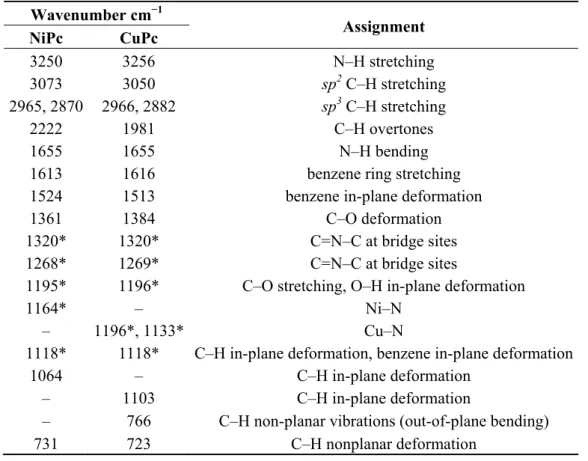
2.7. FT-IR Spectra and Elemental Analysis of Metallic Phthalocyanine Products
Figure 8 shows the FT-IR spectra for Ni- and Cu-phthalocyanine products (Figure 8a,b, respectively) obtained at 50 °C in the parallel-plate reactor. Table 3 presents the assignments of the FT-IR characteristic bands that correspond to a typical metal-phthalocyanine molecule [35,36].
Copper phthalocyanine exists in many polymorphic forms. The most commonly studied phases are alpha (α) and beta (β), and two less common crystalline forms are γ and ε. The resulting β-polymorph has a larger crystalline form, and large crystals change the shade and the tinctorial strength of paint during storage before its final use. Therefore, the β-form is preferred in industrial use.
The different crystalline forms can be identified in the finger region of FT-IR spectra [35–37]. The peaks at 731, 866, and 1027 cm−1 of the Ni-phthalocyanine spectra (Figure 8a) can be attributed to the
α phase. The Cu-phthalocyanine spectra (Figure 8b) present these bands at approximately the same wavenumbers but also exhibit peaks at 766, 1103, and 118 cm−1, which have been reported for the β
crystalline phase [37].The bands at ~3250 cm−1 were assigned to the N–H bond, which indicates the presence of free metal phthalocyanine; however, these bands were not significantly intense.
Table 3. Assignments of the FT-IR characteristic peaks of the NiPc and CuPC products.
Wavenumber cm−1
Assignment NiPc CuPc
3250 3256 N–H stretching
3073 3050 sp2 C–H stretching
2965, 2870 2966, 2882 sp3 C–H stretching
2222 1981 C–H overtones
1655 1655 N–H bending
1613 1616 benzene ring stretching
1524 1513 benzene in-plane deformation
1361 1384 C–O deformation
1320* 1320* C=N–C at bridge sites
1268* 1269* C=N–C at bridge sites
1195* 1196* C–O stretching, O–H in-plane deformation
1164* – Ni–N
– 1196*, 1133* Cu–N
1118* 1118* C–H in-plane deformation, benzene in-plane deformation
1064 – C–H in-plane deformation
– 1103 C–H in-plane deformation
– 766 C–H non-planar vibrations (out-of-plane bending)
731 723 C–H nonplanar deformation
*= Not signaled in Figure 8.
The percentages of elemental analysis of Cu-phthalocyanine results were (analyzed/theoretical) Cu = 10.25/11.03 wt %, C = 65.07/66.72 wt %, N = 18.55/19.45 wt % and H = 2.05/2.80 wt %; for Ni-phthalocyanine were Ni = 9.55/10.28 wt %, C = 67.01/67.28 wt %, N = 18.90/19.62 wt %, and H = 2.41/2.82 wt %. According to elemental analysis results, compositions of the samples of the obtained products correspond to typical metal phthalocyanines of ~96%–98% purity.
3. Experimental Section
3.1. Preparation and Characterization of Supported Elemental Metals
3.2. Reaction Conditions in Batch and Parallel Reactors
Batch experiments: The tests were conducted as reported in our previous work [12]. For this work the reaction time was 24 h at 150 rpm and a constant temperature. The experiments were conducted at 30, 40, and 50 °C.
Parallel-plate reactor experiments: Two removable inner plates were coated with a layer of commercial adhesive, Devcomplasteel®, as uniformly as possible. A weighed amount of Ni/Al2O3 or Cu/Al2O3 powder was immediately spread evenly over the entire surface of each plate and allowed to dry for 24 h. Once the adhesive dried, the excess M/Al2O3 powder was removed. The amount of remaining M/Al2O3 was calculated by the weight difference between the initially added and removed M/Al2O3. The weight of the M/Al2O3 adhered on the reactor plates, was used to calculate the amounts of precursor phthalonitrile and CH3ONa to maintain the same proportions used in the batch reactor. The experimental setup for the parallel-plate reactor tests is shown in Figure 9. The tests were conducted at 2000 mL/min in circulation for 24 h at constant temperature in 10 °C increments from 30 to 60 °C. The MPc solid product was retained on the filter paper of the flask while the solution recirculated through the parallel-plate reactor. After the elapsed reaction time, the MPc on the filter paper was removed, and the solution was filtered and washed several times with ethanol to recover traces of the product. The FT-IR spectra for MPc in KBr mixed disks were determined using a Perkin-Elmer Paragon 1000 PC spectrometer (PerkinElmer, Inc., Waltham, MA, USA). An organic microanalyzer Perkin-Elmer 2400 Series II CHNS/O system was used for C, H and N content determination. Ni and Cu elemental analysis was carried out using Flame Atomic Adsorption Spectometry.
4. Conclusions
Nickel and copper phthalocyanine were synthesized in ethanol at low temperatures (30–60 °C) from phthalonitrile and metallic copper and nickel nanoparticles, which were deposited on alumina with sodium methoxide as a nucleophilic agent. Two reactor configurations were used: a batch reactor (a flask) and a parallel-plate reactor, in which the Ni/ or Cu/alumina powders were fixed and the ethanolic solution was cycled. The Ni and Cu metals on alumina were characterized as nanoparticles (30–150 nm) in agglomerations of 1 to 1.5 μm, with Ni having a lower mean crystallite sizes than Cu (46 and 169 nm, respectively) in XRD patterns analysis. NiO particles were identified in the Ni/Al2O3 sample, which influenced the morphology. The Cu/Al2O3 sample only presented the pure metal phase and had a more homogenous morphology than the nickel sample. Both powder samples presented mesopores and some macropores, which could primarily be attributed to the alumina used as the support. However, the copper particles blocked the macropores and some of the larger mesopores in the Cu/Al2O3 sample, leading to a lower specific area than that of the Ni/Al2O3 sample. Both samples contained smaller mesopores that were sufficiently accessible for the percolation of reactants.
The activation energies for the second-order kinetic expression for both samples in the batch reaction were very similar, which primarily indicates that the cyclization reaction to form the metallic phthalocyanine from four phthalonitrile molecules with a metal was slow. The effect of mass transfer was evaluated in the parallel-plate reactor tests using a three-resistance model plotted as a function of the Thiele modulus. The Thiele modulus values were less than 10−1 for the studied temperatures in the parallel-plate reactor, which is representative of slow reactions and kinetic control. A Langmuir-Hinshelwood model was fitted to the experimental data in the parallel-plate reactor, and the kinetic parameters were analyzed. This model considered that the adsorption phthalonitrile to the catalytic surface occurred in one step and that the surface reaction was the controlling step. For both metal/alumina surfaces, the activation energies of the surface reactions were, again, very low, confirming that the cyclization reaction on the surface was slow. The thermodynamic properties for the reversible adsorption constant of the model included exothermic enthalpy values, which were more negative for the Ni/Al2O3 sample than for the Cu/Al2O3. The surface morphology and composition of the Ni/Al2O3 sample influenced this thermodynamic property, whereas the standard entropies of adsorption were very similar for both samples. The Ni/Al2O3 sample was more reactive than the Cu/Al2O3 sample, influenced for the NiO morphology and phthalonitrile adsorption. The crystalline form of the metallic phthalocyanine products contained more type α than β material for the low-temperature reaction conducted on the parallel-plate reactor.
Conflicts of Interest
The authors declare no conflict of interest. References
2. Garnovskii, A.D.; Kharisov, B.I. Synthetic Coordination and Organometallic Chemistry; Marcel Dekker: New York, NY, USA, 2003.
3. Nemykin, V.N., Kobayashi, N.; Mytsyk, V.M.; Volkov, S.V. The solid phase, room-temperature synthesis of metal-free and metallophthalocyanines, particularly of 2,3,9,10,16,17,23,24-octacyanophthalocyanines. Chem. Lett. 2000, 29, 546–547.
4. Tomoda, H.; Hibiya, E.; Nakamura, T.; Ito, H.; Saito, S. The participation of light in the formation of phthalocyanine. Chem. Lett. 1976, 9, 1003–1006.
5. Kharisov, B.I.; Ortiz-Méndez, U.; Almaraz-Garza, J.L.; Almaguer-Rodríguez, J.R. Synthesis of non-substituted phthalocyanines by standard and non-standard techniques. Influence of solvent nature in phthalocyanine preparation at low temperature by UV-treatment of the reaction system. New J. Chem. 2005, 29, 686–692.
6. Leznoff, C.C.; D’Ascanio, A.M.; Yildiz, S.Z. Phthalocyanine formation using metals in primary alcohols at room temperature. J. Porphyrins Phthalocyanines 2000, 4,103–111.
7. Kharisov, B.I.; Coronado, C.E.C.; Cerda, K.P.C.; Méndez, U.O.; Jacobo, J.A.G.; Patlán, L.A.R. Use of elemental metals in different grade of activation for phthalocyanine preparation. Inorg. Chem. Commun. 2004, 7, 1269–1272.
8. Burns, T.P.; Rieke, R.D. Highly reactive magnesium and its application to organic syntheses. J. Org. Chem. 1987, 52, 3674–3680.
9. Rivera-De la Rosa, J.; Kharisov, B.I.; Medina, A.M.; Ortiz-Méndez, U.; Ibarra-Arvizú, A.K. Natural zeolites used as surface reaction for phthalocyanine synthesis. Mater. Manuf. Process. 2007, 22, 314–317.
10. Manley, J.B.; Anastas, P.T.; Cue, B.W. Jr. Frontiers in Green Chemistry: Meeting the grand challenges for sustainability in R&D and manufacturing. J. Clean. Prod. 2008, 16, 743–750.
11. Hunger, K. Industrial dyes, Chemistry, Properties, Applications; Wiley-VCH: Weinheim, Germany, 2003; pp. 70–74.
12. Kharisov, B.I.; De la Rosa, J.R.; Kharisova, O.V.; Garza, J.L.A.; Rodriguez, J.R.A.; Puente, L.I.; Mendez, U.O.; Arvizu, A.K.I. Use of elemental copper and nickel, supported in alumina, for preparation of non-substituted metal phthalocyaninates at low temperature. J. Coord. Chem. 2007, 3, 355–364.
13. Joshi, S.Y.; Harold, M.P.; Balakotaiah, V. On the use of internal mass transfer coefficients in modeling of diffusion and reaction in catalytic monoliths. Chem. Eng. Sci. 2009, 64, 4976–4991. 14. Joshi, S.Y.; Harold, M.P.; Balakotaiah, V. Overall mass transfer coefficients and controlling
regimes in catalytic monoliths. Chem. Eng. Sci. 2010, 65, 1729–1747.
15. Petersen, E.E. A general criterion for diffusion influenced chemical reactions in porous solids. Chem. Eng. Sci. 1965, 20, 587–591.
16. Zhang, F.; Hayes, R.E.; Koloczkowsky, S.T. A new technique to measure the effective diffusivity in a catalytic monolith washcoat. Chem. Eng. Res. Des. 2004, 82, 481–489.
17. Koloczkowsky, S.T. Measurement of effective diffusivity in catalyst-coated monoliths. Cat. Today 2003, 83, 85–95.
19. Horiguchi, J.; Kobayashi, Y.; Kobayashi, S.; Yamazaki, Y.; Omata, K.; Nagao, D.; Konno, M.; Yamada, M. Mesoporous NiO–Al2O3 catalyst for high pressure partial oxidation of methane to syngas. Appl. Catal. A Gen. 2011, 392, 86–92.
20. El-Safty, S.A.; Kiyozumi, Y.; Hanaoka, T.; Mizukami, F. Heterogeneous catalytic activity of NiO-silica composites designated with cubic Pm3n cage nanostructures. Appl. Catal. B 2008, 82, 169–179.
21. Ishida, T.; Watanabe, H.; Takei, T.; Hamasaki, A.; Tokunaga, M.; Haruta, M. Metal oxide-catalyzed ammoxidation of alcohols to nitriles and promotion effect of gold nanoparticles for one-pot amide synthesis. Appl. Catal. A Gen. 2012, 425–426, 85–90.
22. Valente, J.S.; López-Salinas, E.; Bokhimi, X.; Flores, J.; Maubert, A.M.; Lima E. Sulfated nanocapsular aluminas: Controlling their Brönsted and Lewis acidity. Phys. Chem. C. 2009, 113, 16476–16484.
23. De la Rosa, J.R.; Hernandez, A.; Rojas, F.; Ledezma, J.J. Sol–gel synthesis and characterization of novel La, Mn and Fe doped zirconia: Catalytic combustion activity of trichloroethylene. Colloids Surf. 2008, 315, 147–155.
24. Deraz, N.M. Magnetic behavior and physicochemical properties of Ni and NiO nano-particles. Curr. Appl. Phys. 2012, 12, 928–934.
25. Hanada, N.; Hirotoshi, E.; Ichikawa, T.; Akiba, E.; Fujii, H. SEM and TEM characterization of magnesium hydride catalyzed with Ni nano-particle or Nb2O5. J. Alloy Comp. 2008, 450, 395–399.
26. Hammond, C. The Basics of Crystallography and Diffraction; Oxford University Press: New York, NY, USA, 1997.
27. Matsumura, Y.; Ishibe, H. Selective steam reforming of methanol over silica-supported copper catalyst prepared by sol–gel method. Appl. Catal. B 2009, 86,114–120.
28. Matsumura, Y.; Kuraoka, K.; Yazawa, T.; Haruta, M. Production of carbon monoxide and hydrogen by methanol decomposition over nickel dispersed on porous glass. Catal. Today 1998, 45, 191–196.
29. Sing, K.S.W.; Everett, D.H.; Haul, R.A.W.; Moscou, L.; Pierotti, R.A.; Rouquerol, J.; Siemieniewska, T. Reporting physisorption data gas/solid systems with special reference to the determination of surface area and porosity. Pure Appl. Chem. 1985, 57, 603–619.
30. Lucio-Ortiz, C.J.; de la Rosa, J.R.; Ramírez, A.H.; Heredia, J.A.D.; del Ángel, P.; Muñoz-Aguirre, S.; de León-Covián, L.M. Synthesis and characterization of Fe doped mesoporous Al2O3 by sol–gel method and its use in trichloroethylene combustion. J. Sol. Gel. Sci. Technol. 2011, 58, 374–384.
31. Aravindakshan, A. Copper phthalocyanine. PCI Mag. 2005, 1, 38–47.
32. Treyball, R.E. Mass-Transfer Operations, 3rd ed; Mc. Graw-Hill: New York, NY, USA, 1980. 33. Marchenko, A.; Koidan H.; Hurieva, A.; Merkulov, A.; Pinchuk, A.; Yurchenko, A.;
Rozhenko, A.B.; Jones, P.G.; Thönnessen, H.; Kostyuk, A. Cyclization of C-phosphorylated (PIII) arylformamidines to 3H-1,3-benzazaphospholes. Tetrahedron 2011, 67, 7748–7758.
35. Jung, J.S.; Lee, J.W.; Kim, K.; Cho, M .Y.; Jo S.G.; Joo, J. Rectangular nanotubes of copper phthalocyanine: Application to a single nanotube transistor. Chem. Mater. 2010, 22, 2219–2225. 36. Achar, B.N.; Loesh, K.S. Studies on polyphormic modifications of copper phthalocyanine.
J. Solid State Chem. 2004, 177, 1987–1993.
37. Topuz, B.B., Gündüz, G., Mavis, B., Çolak, Ü. Synthesis and characterization of copper phthalocyanine and tetracarboxamide copper phthalocyanine deposited mica-titania pigments. Dyes Pigment. 2013, 96, 31–37.