Differences among online student profiles taking a break: factors for continuance intention and effective re enrolment vs dropout
31
0
0
Texto completo
(2) Continuance intention and dropout in online higher education In a labour market characterized by the progressive incorporation of high-value knowledge tasks, better qualifications are required not only of new employees, but also of those who are already working; the need for lifelong learning will therefore increase (Davies, Keith, Longworth, & Norman 2014; The Economist 2017). It seems that it will be necessary for universities to enhance their role as providers of flexible, high-quality life-long learning (if possible, considering stagnating wages, at competitive prices). Distance-online learning appears as a very convenient way of delivery for these training needs of active professionals, either in a formal higher education setting (Allen and Seaman 2013; Cho and Heron 2015; Garrison 2011) or a non-formal one as MOOCs (Diver & Martinez 2015; Montgomery, Hayward, Dunn, Carbonaro, Amrhein 2015). In a specific corporate training context, online learning has also proved to be a good training tool (Batalla-Busquets & Pacheco-Bernal 2013; Kimiloglu et al. 2017; Rodriguez and Armellini 2013), also with the use of MOOCs (Linna, Mäkinen, Keto 2016; Ong and Jambulingam 2016). Nevertheless, one of the issues associated to almost any type of distance education is high levels of dropout (Cho and Heron 2015; Frankola 2001; Hachey, Wladis and Conway 2013). In the specific case of online learning, the analysis of dropout has been dealt in parallel with that of previous continuance intention. The main models for both concepts are presented in the rest of this section. The importance of advancing in the knowledge of dropout intention or final behaviour in online-distance learning parallels that of the growing weight of distance education in higher education. In a recent survey to 15 European countries, only in four the interest in on-campus-learning is higher than the interest in distance education (Carlsen, Holmberg, Neghina and Owusu-Boampong 2016). This is especially true in adult education settings: taking into account the context of this study, in Spain 63% of.
(3) people over 30 years pursuing higher studies prefer online learning, according to data of the Spanish Ministry of Education (Ministerio de Educación 2015). (1). Continuance intention in e-learning models. Continuance intention in online learning is a construct that has already been analysed by various authors (Cho and Heron 2015; Hachey, Wladis and Conway 2013; M.-C. Lee 2010; Rodríguez-Ardura and Meseguer-Artola 2014). This construct can be built upon different theoretical frameworks like i.e., social-cognitive theory, technology acceptance model, and motivation theory (Ifinedo 2017). Quality issues, reflected in satisfaction with content and the learning system, also appear to influence continuance intention positively not only in formal distance learning settings (Dağhan and Akkoyunlu 2016; Hong 2017), but also in new learning contexts as MOOCs (Yang, Shao, Liu & Liu 2017) or mobile learning (Huang 2014; Joo, Lim, & Kim 2013). Other factors that seems to boost continuance intention in online learning are usage experience (Zhang, Liu, Yan, & Zhang 2016), the use of social media (Chiu et al. 2005; Kaewkitipong, Chen, & Ractham 2016; Lin 2011) or blogs (Tang, Tang, & Chiang 2014) to enhance the field trip learning experience, and the flow experience (Guo et al. 2016; Rodríguez-Ardura & Meseguer-Artola 2014). It is interesting to take a more detailed look at the model of continuance intention proposed by Rodríguez-Ardura & Meseguer-Artola (2014), shown in Fig. 1 based on an investigation carried out in the same institution, integrating various theories. It concluded that didactic resources and instructor attitudes indirectly impact on user’s intention towards continued e-learning..
(4) Figure 1. Conceptual model of e-learning continuance intention proposed by RodríguezArdura & Meseguer-Artola (2014).. On the other side, Dağhan & Akkoyunlu (2016), proposed an integrated model to better understand the determinants of students’continuance intention. In this model, the quality of information, and also that of the system and the service, have a possible effect on satisfaction and confirmation. In addition to these constructs, four other exogenous variables are considered: utilitarian value, outcome expectations, perceived value and perceived usability.. Attending to this model, 58 % of the variance seen in the continuance intention, in the position of target variable of the research model, was able to be predicted by exogenous variables. It can be also seen that the strongest effect on continuance.
(5) intention is provided by satisfaction1. At the same time, confirmation has the strongest predictor effect on satisfaction, which would confirm the relations between the satisfaction, confirmation and continuance intention variables presented in DeLone and McLean’s (2003) Information Systems Success Model. Therefore, continuance intention seems to be mainly influenced by satisfaction with variables related to the learning experience, which can be mediated by student intrinsic motivation, for example in the form of sense of flow (Rodríguez-Ardura & Meseguer-Artola 2014), users’ expectations of the information system and the system’s, confirmed or not by actual performance (Dağhan & Akkoyunlu 2016), or perceived playfulness (Ifinedo 2017). (2). Dropout in online learning models. Dropout in higher education is not a new problem, and in the present context of expansion of access and scarcity of public budgets, it has acquired renewed relevance. Tinto, through his student integration model (1975) noticed the complexity that lies behind dropout decisions in traditional institutions. According to his perspective, dropout decisions are conditioned mainly by aspects related to student integration at both an academic and social level. Focusing on online learning, it can be observed that dropout rates tend to be higher than that at face-to-face institutions (Cho and Heron 2015; Frankola 2001; Hachey, Wladis and Conway 2013): considering the differences between traditional and online learning methodology and student profiles (often adults with work and family obligations in addition to those of education), it should come as no surprise that online. 1 The author defines satisfaction as “Emotions regarding users’ previous usage of the information system” and Confirmation as “perceptions regarding the harmony between the users’ expectations of the information system and the system’s actual performance.”.
(6) learning dropout is both more frequent and of a different nature than its face-to-face counterpart. It can be interesting to comment briefly on some of the most relevant distanceeducation dropout models that try to “capture” this difference. Most of these models are based on the previously mentioned dropout analysis undertaken by Tinto, adapted to traditional and distance-education institutions. Kember (1989), for example, establishes a pattern of dropout at course level that has many similarities with that of Tinto, putting the decision to drop out as a result of academic and social integration, and stressing the importance of goal commitment and motivation (Figure. 2).. Figure 2. Dropout model, figure adapted from Kember (1989).. Berge and Huang (2004), on the other hand, propose a conceptual rather than a causal model (Fig. 3), valid to explain dropout at a "course, programme, institution or system" level; their model includes as one of its attributes the delivery mode (blended, in-person, or online learning)..
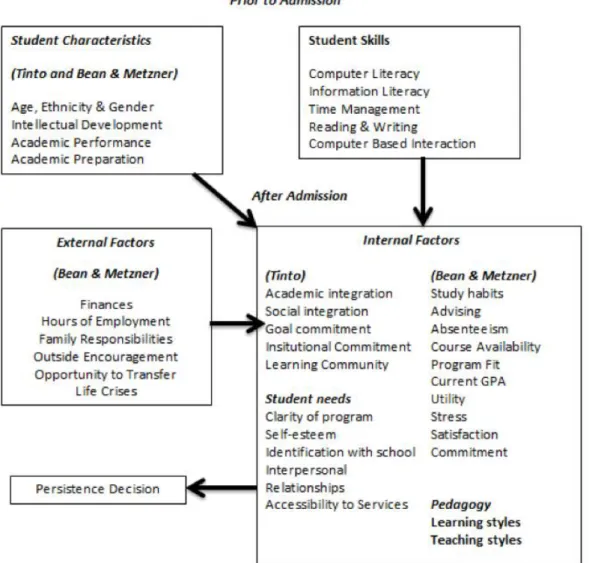
(7) Figure 3. Dropout model, figure adapted Berge and Huang (2004).. As shown in Fig. 5, Rovai (2003) also refers to the "complexity of the (continuance) decision", stating that “there is no simple formula that ensures student persistence. Adult persistence in an online programme is a complicated response to multiple issues. It is not credible to attribute student attrition to any single student, course, or school characteristic” (12). So Rovai comes up with a "composite model" (Fig. 4) that illustrates the factors involved in the decision to continue at the programme level. The main parts that make up the model include Tinto (1975, 1982) as an important reference and the conceptualization that Bean and Metzner (1985) made of non-traditional undergraduate student attrition..
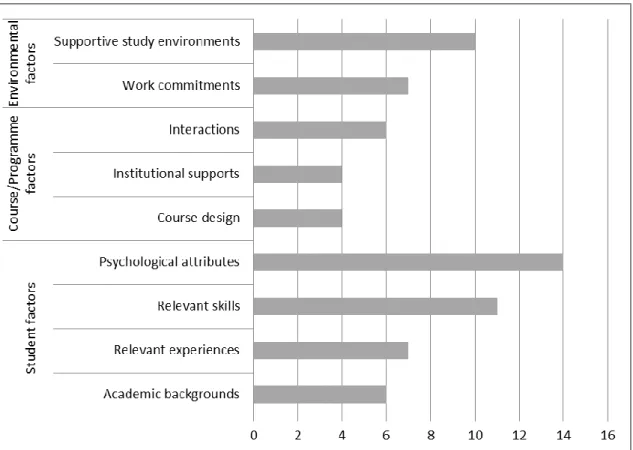
(8) Figure 4. Dropout model, figure adapted from Rovai (2003).. Finally, Lee and Choi (2011) analysed existing studies that reported empirical research findings in peer-reviewed journals from 1999 to 2009, mainly based on a single course analysis. They synthesized the causes of online learning dropout in three macro factors, which can be seen in Fig. 5: “Student factors” are the most widely cited in the bibliography (55% of all papers considered), followed by “Environmental factors” and “Course-programme factors” (25% and 20% respectively)..
(9) Figure 5. Relative frequency of dropout factors mentioned in previous studies, in Lee and Choi review (2011).. (3). Early dropout at the Universitat Oberta de Catalunya. One of the shortcomings of the straight comparison of dropout between distance and face-to-face universities is that the specificities of online learning students and higher education providers are not considered. In many cases, online learning institutions have an academic system with non-compulsory enrolment and flexible deadlines, which allows the students to take breaks. For example, the Open University (UK) and Athabasca University (Canada) establish a maximum time limit by which all undergraduate qualifications must be passed. In the latter case, it is recommended that students remain active (enrol each academic period) on the programme they have begun; otherwise, they are required to pay a fee to restart. Considering the abovementioned specificities of online learning, it is worthy of note that here we use a specific definition of the concept of dropout for its analysis.
(10) (Grau-Valldosera & Minguillon, 2011), approaching it from a programme perspective and taking into account the continuance of students after one or more periods (i.e. semesters) of non-enrolment.. This frame of reference amplifies the single course. perspective taken in the majority of the literature on online learning dropout, as seen in Y. Lee and Choi (2011), in which the continuance perspective does not exist. The Universitat Oberta de Catalunya (Open University of Catalonia, UOC) is a fully online university, established in 1994, which offers a wide range of undergraduate and graduate programmes. With more than 50,000 active students and almost 70,000 alumni, it is the second-largest university in Catalonia, Spain. Regarding the UOC’s student profile, 40.5% of students are 30 or over, 81.5% study and work and 72.6% have prior university education. New students enrol at the UOC biannually. Based on the specific dropout definition adopted, total dropout accounted for 57.6% of the student body <citation removed>. First-semester dropout, however, was 25%, almost half of total dropout. The existence of a significant rate of early dropout is characteristic of online learning institutions (De Santiago Alba 2011; Oliver 2007; Tyler-Smith 2006; Grau-Valldosera & Minguillón 2014). As a matter of fact, taking a break in the second semester at the UOC is almost synonymous with dropout: The risk can be quantified at 80% for UOC students, that is, eight out of ten students that take “a break” in the second semester would not be doing so, they would actually be dropping out. They represent almost the 50% of total dropout. Online learning dropout happens very soon and our definition tries to capture this fact..
(11) (4). Continuance intention vs dropout. The analysis that tries to bind the concretion or materialisation of continuance intention in a subsequent effective re-enrolment (or dropout) has not received much attention in the literature. In this paper this relation is explored. With the possibility of taking breaks in distance-online higher education as an important premise, this paper focuses then on student continuance (in the next term and on the same degree) and potential reenrolment of those that have taken a break in the second semester. More specifically, the research questions addressed in this paper are the following: Question 1: Are there differences between sociodemographic and academic profiles of the students in terms of their continuance intention, or final re-enrolment or dropout? Question 2: Do differences exist in the perception of the learning experience between students with or without continuance intention, or between those that finally re-enrol or dropout? Question 3: Which is the relationship between continuance intention and eventual effective re-enrolment (or dropout)? Methodology (5). Sample. Taking into account that students can enrol biannually, the sample for our study was taken from the population of new students enrolled in September 2014 that did not reenrol in the following period (February 2015). The final sample was reached through an e-mail survey that was sent to 1,216 non-active second-term students, with 281 responding (response rate = 23.1%, which gives a sample error of +/- 5.1%, with an uncertainty coefficient of 0.5 and a confidence interval of 95%)..
(12) (6). Instruments. The email survey used in the fieldwork consisted of 24 questions that tried to capture the variables in each of the three dimensions found in the literature review (Y. Lee & Choi 2011), specifically: Student, Course/programme and Environmental factors. Table 1 shows the sections of the survey: Table 1. Sections of the survey. Number questions. of Scale used. Survey section. Description. “Previous experience”. Previous university and online learning experience.. 4. Multiple choice. the Motivation for starting university studies and about the programme selection process.. 4. Multiple choice (2 with an openended option). “Your 1st semester at Validation of subjects, opinion about academic the UOC” information and following the continuous assessment tests.. 3. 2 multiple-choice. “Reasons for not re- Which elements of the enrolling for the 2nd learning system and process are related to the decision semester” not to re-enrol after the 1st semester.. One question with 27 possible reasons. 1 Likert with 1-5 range, labelled at the ends. “Your experience at General satisfaction with the semester, level of the UOC...” expectations vs. satisfaction with specific attributes, and level of satisfaction with the learning platform (Virtual Campus).. 10. General satisfaction (1 Likert with 1-10 points labelled at the ends). “Approach UOC”. to. 1 Likert with 1-5 range, labelled at the ends. Expectations/Sati sfaction (7 multiple –choice questions). Virtual Campus (3 Likert with 1-5.
(13) range, labelled at the ends). “Dedication studies”. to Time spent programme. on. “Professional, family Sociodemographic data and socioeconomic status”. the. 4. 3 multiple-choice, 1 with an openended option. 3. Multiple-choice. All three macro-factors defined by Lee and Choi (2011) are widely covered through the survey: the Student dimension is dealt with mainly in the first two sections, while Course-programme factors are included in the third, fourth and fifth sections. The Environmental questions form part of the sixth and last section. The questions in section seven refer to one of the explained variables of the present study (continuance intention). Information about effective re-enrolment is obtained directly from UOC’s datamart. (7). Factor calculation. The question about the reasons for non-re-enrolment (section four of the survey) is essential, and points to how the student has experienced the different elements of their studies, and to what extent this experience is related to their decision not to re-enrol. Alternatively, the variables that form part of the learning environment are also included in the analysis, as this is an essential element of the system. For all the above-mentioned variables, factors were obtained through a principal component analysis, ranging from 1 (Disagree) to 5 (Totally agree). Table 2 shows the following for each factor: name, description, variables that it contains -and their mean (M) and standard deviation (SD)-, Cronbach’s α, loading of the 1st Eigenvalue, and its variance. Although the Cronbach’s α coefficient is relatively low (close to 0.6) for some factors, the high values of the.
(14) explained variance (0.5 or more) would justify their inclusion in the analysis (Schmitt 1996). An explorative factor analysis was conducted in preliminary versions of the survey, showing that almost all items loaded the expected constructs (only in a few cases the same item loaded two different constructs).. (8). Analysis. Once all the variables and factors were presented, a bivariate analysis of their relation with the two explained variables mentioned previously was addressed: the first, intention to re-enrol on the same programme next semester, and the second, the “materialization” of this intention, that is, effective re-enrolment for the third semester. The statistic tests used were: Chi-square test for the binary-binary relations. Mann-Whitney-Wilcoxon U-test for ordinary-binary relations. Student t-test for quantitative-binary relations.. Table 2. Factors calculated from reasons for non-enrolment (n=258) and Virtual Campus variables (n=232). Factor name. TIME. PERS. Factor description: “I didn’t enrol for the second semester because...”. Factor variables: “I didn’t enrol for the second semester because...”. “...I have spent a lot of time on my studies”. I didn't have time to keep up with the continuous assessment tests. 3.05. 1.56. The continuous assessment tests did not have flexible delivery dates. 2.35. 1.46. It was hard to keep up with the forums. 2.47. 1.47. I didn’t enjoy studying at the UOC. 2.11. 1.42. “...I didn’t enjoy. M. SD. Cronbach’s α. PCA 1st Eigenvalue Ld.. Var.. 0.73. 1.95. 0.65. 0.64. 1.96. 0.49.
(15) the course and couldn’t fit it into my personal life”. PRICE. SYST. DIF. SUP. VC_REC. It’s not worth giving up my leisure time for. 2.04. 1.3. I didn’t have time to meet my family obligations. 2.59. 1.53. I could not fit the UOC in with my personal and professional life. 2.79. 1.5. “...Economic issues were a problem to continue studying”. It was too expensive. 3.40. 1.58. Being able to pay in instalments. 2.45. 1.58. I found a more economical option to continue studying. 1.43. 0.94. “...I didn’t adapt to the UOC’s study system”. I didn't have the discipline needed to study alone. 1.89. 1.26. I didn't adapt to working online – I prefer face-to-face. 1.74. 1.18. With the virtual system you don’t save so much time. 2.10. 1.4. It has been difficult for me to adapt to the UOC study system. 2.21. 1.43. The continuous assessment tests were very difficult. 2.18. 1.26. The subjects were too theoretical. 2.07. 1.24. The subjects were too complicated. 1.90. 1.18. Course materials/class were not sufficient. resources. 1.92. 1.22. There was little feedback from course instructors. 1.87. 1.15. The course instructor did not give satisfactory explanations. 1.79. 1.17. The contributions of the instructors were inadequate. course. 1.86. 1.18. I have been able to carry out the daily activity on the VC. 3.54. 1.22. I was able to find the spaces and resources on the VC. 3.40. 1.23. I feel the VC is an appropriate platform for supporting my learning process. 3.66. 1.12. “...I found the contents and tests too difficult”. “...I didn’t receive enough support from the tutor and/or from the course materials”. “The learning environment (Virtual Campus, VC) wasn’t a good learning tool for me”. 0.60. 1.72. 0.57. 0.83. 2.64. 0.66. 0.81. 2.17. 0.72. 0.89. 3.03. 0.76. 0.84. 2.26. 0.75.
(16) Results Concerning the first explained variable (continuance intention), up to 41.3% of the “resting” students in the 2nd semester (116) expressed their intention to restart their studies the following term; 34.5% (40) of these students effectively re-enrolled (2nd explained variable). Table 3 shows the basic descriptive statistics (N, M, SD, sr, relative frequencies) and the results of the application of the bivariate analysis.. Table 3. Results of the bivariate analysis. Coefficient is significant (2-tailed) at the 0.05 level (*), 0.01 level (**) or 0.001 level (***), only for the variables with a significant statistical relation with the explained variable. “sr” is the abbreviation for “Standardized residual”. Absolute values higher than 2 are shown only if the bivariate analysis shows a statistically significative difference. [Table 3 near here] We can summarize the effects of the dependent variables on the two explained variables, for each one of the blocks of the survey, as shown in Table 4. Variable. Basic descriptive statistics. Relation w/ re-enrolment intention Without intention. Relation w/ effective reenrolment. With intention. Non reenroled. Reenroled. 46.2 %. 53.8 %. 51.0 %. 49.0 %. 60.9 %. 39.1 %. 88.0 %. 12.0 %. PREVIOUS EXPERIENCE <= 5 years Last university experience has been in the previous 5 years. 58.9 % > 5 years 41.1 %. sr: -2.03 p = 0.0987. p = 0.004**. APPROACH TO THE UOC Decision to study at the UOC for its flexibility. Yes 56.6 %. 40.2 %. 59.8 %. 62.1 %. 37.9 %.
(17) No 43.4 %. 62.2 %. 37.8 %. 67.1 %. p = 0.0015**. 32.9 %. p = 0.7560. YOUR 1ST SEMESTER AT UOC Satisfaction with the information from the tutor. M = 3.81. M = 3.75. M = 3.94. SD = 1.23. M = 3.79. M = 4.22. SD = 1.30. SD = 1.19. p = 0.0623 Yes Did you follow the continuous assessment tests?. p = 0.0495*. 42.9 %. 57.1 %. 61.2 %. 38.8 %. 60.0 %. 40.0 %. 75.0 %. 25.0 %. 41.8% No 58.9%. p = 0.0163*. p = 0.2186. MOTIVES FOR NOT RE-ENROLLING FOR THE 2ND SEMESTER. “I have spent a lot of time on my studies (TIME factor)”. M = 2.62. M = 2.86. M = 2.46. SD = 1.20. SD = 1.24. SD = 1.14. p = 0.0144* “I didn’t enjoy the course, and couldn’t fit it into my personal life (PERS factor)”. M = 2.37. M = 2.76. M = 2.06. SD = 0.99. SD = 1.05. SD = 0.80. p < 0.001***. “I didn’t adapt to the UOC’s study system (SYST factor)”. M = 1.98. M = 2.31. M = 1.64. SD = 1.06. SD = 1.12. SD = 0.89. p < 0.001***. “I found the contents and tests too difficult (DIF factor)”. M = 2.05. M = 2.31. M = 1.79. SD = 1.05. SD = 1.10. SD = 0.93. p < 0.001*** “I didn’t receive enough support from the tutor and/or from the course materials (SUP factor)”. M = 1.86. M = 2.17. M = 1.63. SD = 1.02. SD = 1.14. SD = 0.84. p < 0.001*** “The learning environment wasn’t a good learning tool for me (VC_REC factor) “. M = 2.47. M = 2.81. M = 2.08. SD = 1.03. SD = 1.01. SD = 0.87. p < 0.001***. M = 2.58. M = 2.33. p = 0.1193 M = 2.14. M = 1.9. p = 0.1040 M = 1.73. M = 1.47. p = 0.0970 M = 1.85. M = 1.67. p = 0.2656 M = 1.71. M = 1.48. p = 0.1183 M = 2.20. M = 1.85. p = 0.0593.
(18) YOUR EXPERIENCE AT THE UOC2 Variable (perception about). Price is appropriate for the services offered. Basic descriptive statistics. Relation w/ reenrolment intention Without intention. With intention. 57.1 %. 42.9 %. 55.5 %. 44.5 %. 2. 37.5%. 63.2 %. 36.8 %. 59.4 %. 40.6 %. 3. 47.4%. 40.0 %. 60.0 %. 71.2 %. 28.8 %. 4. 5.2%. 25.0 %. 75.0 %. 55.5 %. 44.5 %. p = 0.4954. 1. 3.8%. 44.5 %. 55.5%. 60.0 %. 40.0 %. 2. 20.7%. 89.3 %. 10.7 %. 80.0 %. 20.0 %. sr: +3.86. sr: -3.84. 3. 51.3%. 45.8 %. 54.2 %. 68.7 %. 31.3 %. 4. 24.2%. 25.0 %. 75.0 %. 59.5 %. 40.5 %. sr: -2.61. sr: +2.59. 1. 3.0%. p = 0.7168. 71.4 %. 28.6 %. 50.0 %. 50.0 %. 72.3 %. 27.7 %. 92.3 %. 7.7 %. 2. 20.7%. sr:+2.22. sr:-2.20. 3. 43.9%. 51.5 %. 48.5 %. 73.5 %. 26.5 %. 4. 32.4%. 30.7 %. 69.3 %. 51.9 %. 48.1 %. sr:-2.32. sr:-2.30. p < 0.001***. You should devote a reasonable amount of time. Reenrole d. 9.9%. p < 0.001***. Adaptation to the UOC study system. Non reenrole d. 1. p = 0.0028**. Studying at the UOC as an enjoyable experience. Relation w/ effective re-enrolment. p = 0.0106*. 1. 3.4%. 62.5 %. 37.5 %. 66.6 %. 33.4 %. 2. 33.6%. 62.8 %. 37.2 %. 62.1 %. 37.9 %. 3. 49.6%. 46.0 %. 54.0 %. 73.8 %. 26.2 %. 4. 13.4%. 25.8 %. 74.2 %. 47.8 %. 52.2 %. 2 Concerning the “your experience at the UOC variables”, values for experience labels are: 1 (I don't have any experience in this aspect), 2 (My experience was negative), 3 (My experience was average), 4 (My experience was positive)..
(19) p = 0.0028**. The subjects would be reasonably difficult. p = 0.1393. 1. 7.3%. 64.3 %. 35.7 %. 60.0 %. 40.0 %. 2. 16.8%. 76.9 %. 23.1 %. 77.8 %. 22.2 %. sr: +2.43. sr: -2.41. 3. 60.8%. 46.6 %. 53.6 %. 70.1 %. 29.9 %. 4. 15.1%. 27.0 %. 73.0 %. 48.1 %. 51.9 %. p < 0.001***. The course instructors would help me to move forward with the subject. p = 0.1531. 1. 9.0%. 70.0 %. 30.0 %. 83.3 %. 16.7 %. 2. 11.3%. 65.4 %. 34.6 %. 66.6 %. 33.7 %. 3. 54.3%. 47.2 %. 52.8 %. 71.2 %. 28.8 %. 4. 25.4%. 40.7 %. 59.3 %. 51.4 %. 48.6 %. p = 0.0442* In general, how would you rate your first semester at the UOC? (from 1 = minimum, to 10 = maximum). p = 0.1916. M = 5.69. M = 4.46. M = 6.95. M = 6.58. M = 7.65. SD = 2.83. SD = 2.58. SD = 2.50. SD=2.62. SD=2.09. p < 0.001***. p < 0.034*. DEDICATION TO STUDIES Variable. How often did you connect to the Virtual Campus? (from 1 to 5). Basic descriptive statistics. Relation w/ re-enrolment intention. (N=230). Without intention. With intention. M = 4.07. M = 4.04. M = 4.09. Non reenroled. Reenroled. M = 3.9. M = 4.4. SD = 1.25. SD = 1.13. SD = 1.21 p = 0.5693. Of the hours spent, in your opinion they ended up being.... Relation w/ effective reenrolment. p = 0.0128*. Less than planned 26.5%. 59.0 %. 41.0 %. 88.0 %. 12.0 %. As planned 27.4%. 41.3 %. 58.7 %. 70.3 %. 29.7 %. More than planned. 49.1 %. 50.9 %. 51.9 %. 48.1 %. p = 0.1405 46.1%. p = 0.0054**.
(20) PROFESSIONAL, FAMILY AND SOCIOECONOMIC STATUS M = 33.38 Age. M = 31.74. M = 33.87. SD = 9.21. M = 36.00. M = 29.82. SD = 9.26. SD = 8.21. p = 0.3590. p < 0.001***. Table 4: Summary of the effects of the dependent variables on the explained variables. Block of the survey (N). Number of effects (N) Relation with reenrolment intention. Relation with effective reenrolment. Previous experience (N = 183). 0 (N = 155). 1 (N = 116). Approach to UOC (N = 258). 1 (N = 258). 0 (N = 116). Your 1st semester at UOC (N = 258). 1 (N = 230). 1 (N = 116). Motives for not re-enrolling the 2nd semester (N = 258). 6 (N = 230). 0 (N = 116). Your experience at UOC (N = 232). 7 (N = 230). 2 (N = 116). Dedication to studies (N = 230). 0 (N = 230). 2 (N = 116). ... Professional, family and socioeconomic status... (N = 258). 0 (N = 258). 2 (N = 116). Total number of effects. 15. 8. With respect to the explained variable “intention to re-enrol”, we can describe the students who intend to continue (versus those that don’t intend to) in the following manner: on the one hand, they chose the UOC for its flexibility; on the other hand, they made the most of the continuous assessment tests during the first semester. In addition, they presented significatively lower values (that is, less negative opinions) for the factors of non re-enrolment in the second semester (that is, the TIME, PERS, SYST, DIF, SUP and VC_REC). On the other hand, they were more satisfied with the different attributes evaluated (study as an enjoyable experience, system of study, time dedicated, difficulty of the subjects, support from tutors and price)..
(21) Naturally, these differences were also reflected in a higher overall satisfaction of these students with a positive continuance intention. Furthermore, if we take into account the effective re-enrolment behaviour of the subset of students that expressed their intention to restart studies, we see that, considering the subgroup of the students who eventually re-enrol, they are younger (by more than 5 years, on average) than the rest. Also related to the age variable is the propensity to re-enrol among students with more recent previous university experience (in a period of less than 5 years), which is much higher than among those with more distant university experience. Moreover, the re-enrolled students give greater value to the information received from the tutor during the enrolment process and their overall satisfaction with the semester is higher. Likewise, the perception of having adapted to the UOC’s study system is proportionally greater; the “re-starter” student is a student who logged on more frequently to the learning environment during the first period at the university. Although they also state that they spent more time than expected studying for the activities, this has not prevented them from re-enrolling. Interestingly, if we take overall satisfaction for the first-semester variable, we can see, on the one hand, that its value has a mean of almost seven (6.95) for students that intend to continue, compared to a 4.46 value for students without continuance intention. On the other hand, considering only the subset of students that express their intention to restart studies, mean global satisfaction is 7.65 for the students who effectively re-join the UOC in the third semester, compared to a value of 6.58 for nonre-enrolled students. Both mean differences are statistically significant, as can be seen in Table 2 (variable “In general, how would you rate your first semester at the UOC”, at the end of the “Your experience at the UOC” section of the table)..
(22) Discussion In light of these results, to give an answer to the first research question, we can affirm that 2nd semester break students with a positive continuance intention are not significantly different from those without this intention in terms of the sociodemographic and academic variables considered in our study (“student” or “environmental” variables in Lee and Choi’s terminology). It is remarkable that these models do not usually consider this typology of variables, except some exceptions like Ifinedo (2017) or Rodríguez-Ardura and Meseguer-Artola (2014), which include variables related to intrinsic motivation in their models. In contrast, dropout models (Berge & Huang 2004; Kember 1989; Rovai 2003) do tend to include these variables out of the learning experience itself. As a matter of fact, they effectively appear as significative in our results, specifically age and recency of previous college experience. On the other side, concerning to the second research question, we find that there exists a relation between the perceptions associated with the learning experience during the first semester and both continuance intention and effective re-enrolment. Students that declare their intention to continue in the next semester take into account mainly lower values for the variables associated to not re-enrolling in the 2nd semester (TIME, PERS, SYST, etc.), that lead to a higher satisfaction with the main elements that constitute their educational experience (instructors, study system, joy of learning, etc.), as was seen in Dağhan & Akkoyunlu (2016) and Rodríguez-Ardura & Meseguer-Artola (2014). Additionally, these course-program factors that constitute the learning experience also appear to be related to effective re-enrolment (or dropout), although for a lower number of variables than was seen for continuance intention: satisfaction in global terms and adaptation to UOC study system. Both variables were relevant in the main dropout models presented in this paper..
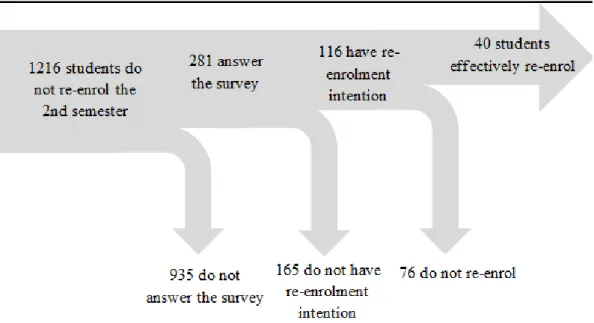
(23) Therefore, it seems that continuance intention would be somewhat more rational, mainly related to the satisfaction with course-programme variables, while the eventual re-enrolment would be in a sense more pragmatic and would arise from a more complex decision process, in which other context variables related to the student and the environment would influence the final decision. Regarding the third and last question of the relationship between having continuance intention and finally re-enrolling later, we can affirm that the intention of students who are taking a break to continue with their studies is a positive trigger for effectively restarting their learning activity in the next semester, as only a 7.5% of students (3 out of 40) that did not express a prior intention to continue did so. The other 37 re-enrolled students had answered “yes” to the question regarding intention to reenrol. The flow of students from the break during the 2nd semester to eventual reenrolment in the third semester can be seen graphically in Figure 6.. Figure 6. Flow of students from second semester break to re-enrolment or dropout in the third semester.
(24) Conclusions Dropout is a major concern in higher education, especially in distance education. We analyzed the intention to continue of students that have not enrolled in the second semester with a survey sent to 1,216 non-active second-term students and conducting a bivariate analysis to explore the relation of the variables collected in the survey with the two explained variables mentioned (intention and effective re-enrolment). The main findings of our research can be summarised in these two points: on one hand, that re-enrolment intention is mainly driven by satisfaction with course-programme variables such as the learning resources, the support received or the learning platform, on the other hand, re-enrolment intention would also be a necessary condition, though not sufficient in itself, for effective re-enrolment. Uncovering the complexity that lies behind the final re-enrolment decision, related not only to course-programme but also to environmental (i.e. dedication to studies) or student (i.e. previous university experience, or age) variables, is also of great interest, as it gives clues to which other variables to monitor. Considering the increasing “stock” of students in a “break situation” allowed by distance education systems, we think our results put some light in this ground specifically, the relation between continuance intention and the eventual reenrolment behaviour-, giving some specific clues to the institutions to promote good practices that will help students to see more clearly a probable return to the program they started or even to prevent them from taking a break. We therefore believe that these findings pose a challenge to take direct action involving these issues and to strive to recover those students most likely to be recovered: the ones who have expressed their intention to continue in the third semester,.
(25) which accounts for nearly 30% of all non-enrolled students in the second semester. All this knowledge would allow program administrators to offer a more personalized treatment of each student, aimed at increasing their ratio of re-enrolment in thirdsemester studies as well as the attainment of success throughout their academic journey.. Future work and limitations An extended and more in-depth analysis would be required to obtain more complex models, but this will not be possible without including new statistical methods or new types of data in the process. Navigation logs, student profiles and academic performance data, for example, would be of great help in predicting dropout risk; in the best-case scenario, even before the first semester is finished (Christie, Munro, & Fisher 2004; Franssen & Nijhuis 2011; Kovacic 2010; Nistor and Neubauer 2010; You 2016). Additionally, an analysis of the data that takes into account the differences between academic programmes would be of great interest, as it would allow the design of more focused actions, which would result in more effective recommendations for the institution. The adaptation of the analysis methodology presented in this paper to other distance/higher education institutions would allow results to be compared and perspectives mutually enriched in a context of more effective and efficient academic policies.. Acknowledgements This work was supported by eLearn Center at the Universitat Oberta de Catalunya..
(26) References Allen, I. E., and J. Seaman. 2013. Changing Course: Ten Years of Tracking Online Education in the United States. Babson Survey Research Group and Quahog Research. Group,. LLC. http://www.onlinelearningsurvey.com/reports/changingcourse.pdf Batalla-Busquets, J.-M., and C. Pacheco-Bernal. 2013. "On-the-job e-learning: Workers’ attitudes and perceptions." The International Review of Research in Open and Distributed Learning 14 (1): 40-64. doi:10.19173/irrodl.v14i1.1304 Berge, Z. L., and Y.-P. Huang. 2004. “A Model for Sustainable Student Retention: A Holistic Perspective on the Student Dropout Problem with Special Attention to e-Learning.” DEOSNEWS 13 (5). Bolliger, D., and F. Inan. 2012. “Development and validation of the Online Student Connectedness Survey (OSCS).” The International Review Of Research In Open And. Distributed. Learning. 13(3):. 41-65.. Doi:. http://dx.doi.org/10.19173/irrodl.v13i3.1171 Braxton, J. M., J. F. Milem, and A. S. Sullivan. 2000. “The Influence of Active Learning on the College Student Departure Process: Toward a Revision of Tinto’s Theory.” The Journal of Higher Education 71 (5): 569-590. Doi: 10.2307/2649260 Carlsen A, C. Holmberg, C. Neghina, and A. Owusu-Boampong. 2016. Closing the Gap. Opportunities for distance education to benefit adult learners in higher education. UNESCO Institute for Lifelong Learning. Chiu, C.-M., M.-H. Hsu, S.-Y. Sun, T.-C. Lin, and P.-C. Sun. 2005. “Usability, quality, value and e-learning continuance decisions.” Computers & Education 45 (4): 399–416. Doi:10.1016/j.compedu.2004.06.001 Cho, M.-H., and M. L. Heron. 2015. “Self-regulated learning: the role of motivation, emotion, and use of learning strategies in students’ learning experiences in a self-paced online mathematics course.” Distance Education 36 (1): 80–99. Doi:10.1080/01587919.2015.1019963 Christie H, M. Munro, T. Fisher. 2004. “Leaving university early: exploring the differences between continuing and non‐continuing students.” Studies in Higher Education. 29:. 617–636.. http://www.tandfonline.com/doi/abs/10.1080/0307507042000261580. Doi:.
(27) Dağhan, G., and B. Akkoyunlu. 2016. “Modeling the continuance usage intention of online learning environments.” Computers in Human Behavior 60: 198–211. Doi:10.1016/j.chb.2016.02.066 K. W. Davies, and N. Longworth. 2014. Lifelong Learning. London: Routledge. De Santiago Alba, C. 2011. “El abandono en primera matrícula en la UNED: análisis comparado. de. la. primera. cohorte. de. Grados.”. UNED. http://portal.uned.es/pls/portal/docs/PAGE/UNED_MAIN/LAUNIVERSIDAD/ VICERRECTORADOS/CALIDAD_E_INTERNACIONALIZACION/INNOV ACION_DOCENTE/IUED/INSTITUCIONAL/ABANDONOPRIMERAMATR ICULAUNED.PDF Diver, P., and I. Martinez. 2015. “MOOCs as a massive research laboratory: opportunities. and. challenges.”. Distance. Education. 36. (1):. 5–25.. doi:10.1080/01587919.2015.1019968 The Economist. 2017. Learning and earning. Lifelong learning is becoming an economic. imperative.. The. Economist,. Special. Report.. January. 12.. http://www.economist.com/news/special-report/21714169-technologicalchange-demands-stronger-and-more-continuous-connections-between-education Franssen R, and J. Nijhuis. 2011.”Exploring Student Attrition in Problem-Based Learning: Tutor and Student Perceptions on Student Progress.” In Building Learning Experiences in a Changing World edited by Piet Van den Bossche, Wim H. Gijselaers, Richard G. Milter, 139–146. Dordrecht: Springer Netherlands. Frankola, K. 2001. “Why online learners drop out.” Workforce 80 (10): 53–58. Garrison, D. R. 2011. E-Learning in the 21st Century: A Framework for Research and Practice. New York: Routledge. Guo, Z., L. Xiao, C. Van Toorn, Y. Lai, and C. Seo. 2016. “Promoting online learners’ continuance intention: An integrated flow framework.” Information and Management 53 (2): 279-295. doi:10.1016/j.im.2015.10.010 Grau-Valldosera, J., & Minguillón, J. (2011). Redefining dropping out in online higher education: A case study from the UOC. In ACM International Conference Proceeding Series. https://doi.org/10.1145/2090116.2090125 Grau-Valldosera, J., & Minguillón, J. (2014). Rethinking dropout in online higher education: The case of the Universitat Oberta de Catalunya. International Review of Research in Open and Distance Learning, 15(1)..
(28) Hachey, A. C., C. W. Wladis, and K. M. Conway. 2013. “Balancing Retention and Access in Online Courses: Restricting Enrolment … is it Worth the Cost?.” Journal of College Student Retention: Research, Theory & Practice 15 (1): 9– 36. Doi:10.2190/CS.15.1.b Hartnett, M., A. St. George, and J. Dron. 2011. “Examining motivation in online distance learning environments:. Complex, multifaceted. and situation-. dependent.” The International Review Of Research In Open And Distributed Learning 12 (6): 20-38. Doi: http://dx.doi.org/10.19173/irrodl.v12i6.1030 Hong, J.-C., K.-H. Tai, M.-Y. Hwang, Y.-C. Kuo, and J. S. Chen. 2017. “Internet cognitive failure relevant to users’ satisfaction with content and interface design to reflect continuance intention to use a government e-learning system.” Computers in Human Behavior 66: 353–362. doi:10.1016/j.chb.2016.08.044 Huang, R. T., C.-H. Hsiao, T.-W. Tang, and T.-C. Lien Huang. 2014. “Exploring the Moderating Role of Perceived Flexibility Advantages in Mobile Learning Continuance Intention (MLCI).” International Review of Research in Open and Distance Learning 15 (3): 140–157. Ifinedo, P. 2017. “Examining students’ intention to continue using blogs for learning: Perspectives from technology acceptance, motivational, and social-cognitive frameworks.”. Computers. in. Human. Behavior. 72:. 189–199.. doi:10.1016/j.chb.2016.12.049 Joo, Y. J., K. Y. Lim, and J. Kim. 2013. “Locus of control, self-efficacy, and task value as predictors of learning outcome in an online university context.” Computers and Education 62. Doi:10.1016/j.compedu.2012.10.027 Kaewkitipong, L., C. C. Chen, and P. Ractham. 2016. “Using social media to enrich information systems field trip experiences: Students’ satisfaction and continuance intentions.” Computers in Human Behavior 63: 256–263. doi:10.1016/j.chb.2016.05.030 Khazaal, Y, M. van Singer, A. Chatton, S. Achab, D. Zullino, S. Rothen, R. Khan, J. Billieux and G. Thorens. 2014. “Does self-selection affect samples’ representativeness in online surveys? An investigation in online video game research”. Journal of Medical Internet Research 16 (7): 164. Kember, D. 1989. “A Longitudinal-Process Model of Drop-Out from Distance Education.”. The. Journal. Doi:10.2307/1982251. of. Higher. Education. 60. (3):. 278–301..
(29) Kember, D., T. Lai, D. Murphy, I. Siaw, and K. S. Yuen. 1992. “Student Progress in Distance Education - Identification of Explanatory Constructs.” British Journal of Educational Psychology 62: 285–298. Kimiloglu, H., M. Ozturan, and B. Kutlu. 2017. “Perceptions about and attitude toward the usage of e-learning in corporate training.” Computers in Human Behavior 72: 339–349. doi:10.1016/j.chb.2017.02.062 Lee, M.-C. 2010. “Explaining and predicting users’ continuance intention toward elearning: An extension of the expectation–confirmation model.” Computers & Education 54 (2): 506–516. Doi:10.1016/j.compedu.2009.09.002 Lee, Y., and J. Choi. 2011. “A review of online course dropout research: implications for practice and future research.” Educational Technology Research and Development 59 (5): 593–618. Doi:10.1007/s11423-010-9177-y Lin, K.-M. 2011. “e-Learning continuance intention: Moderating effects of user elearning. experience.”. Computers. &. Education. 56. (2):. 515–526.. doi:10.1016/j.compedu.2010.09.017 Lin, K.-M., N.-S. Chen, and K. Fang. 2011. “Understanding e-learning continuance intention: a negative critical incidents perspective.” Behaviour & Information Technology, 30 (1): 77–89. Doi:10.1080/01449291003752948 Linna, P., T. Mäkinen, and H. Keto. 2016. “Utilizing MOOCs in the development of education and training programs.” In Information and Communication Technology, Electronics and Microelectronics, 861-864. MIPRO, 39th International Convention on. IEEE. Ministerio de Educación, C. y D. 2015. Datos y Cifras del Sistema Universitario Español. Madrid: SECRETARÍA GENERAL TÉCNICA Subdirección General de. Documentación. y. Publicaciones.. https://www.mecd.gob.es/dms/mecd/servicios-al-ciudadanomecd/estadisticas/educacion/universitaria/datos-cifras/datos-y-cifras-SUE-201516-web-.pdf Nielsen, J. S. 2011. “Use of the Internet for willingness-to-pay surveys: A comparison of face-to-face and web-based interviews.” Resource and Energy Economics 33:119–129. https://doi.org/10.1016/j.reseneeco.2010.01.006 Montgomery, A. P., D. V. Hayward, W. Dunn, M. Carbonaro and C. G. Amrhein. 2015. “Blending for student engagement: Lessons learned for MOOCs and beyond.” Australasian Journal of Educational Technology 31(6). doi:10.14742/ajet.1869.
(30) Nistor N and K. Neubauer. 2010. “From participation to dropout: Quantitative participation patterns in online university courses.” Computers & Education 55: 663–672. https://doi.org/10.1016/j.compedu.2010.02.026 Oliver, R. 2007. “Engaging first year students using a Web-supported inquiry-based learning setting.” Higher Education 55 (3): 285–301. Doi:10.1007/s10734-0079055-7 Ong, D., and M. Jambulingam. 2016. “Reducing employee learning and development costs: the use of massive open online courses (MOOC).” Development and Learning in Organizations: An International Journal 30 (5): 18–21. doi:10.1108/DLO-08-2015-0066 Rodríguez-Ardura, I., and A. Meseguer-Artola. 2014. “What leads people to keep on elearning? An empirical analysis of users’ experiences and their effects on continuance intention.” Interactive Learning Environments (June): 1–24. doi:10.1080/10494820.2014.926275 Rodriguez, B. C. P., and A. Armellini. 2013. “Interaction and effectiveness of corporate e-learning programmes.” Human Resource Development International 16 (4): 480–489. doi:10.1080/13678868.2013.803753 Rovai, A. P. 2003. “In search of higher persistence rates in distance education online programs.”. The. Internet. and. Higher. Education. 6. (1):. 1–16.. doi:http://dx.doi.org/10.1016/S1096-7516(02)00158-6 Schmitt, N. 1996. “Uses and abuses of coefficient alpha.” Psychological Assessment 8 (4): 350–353. doi:10.1037/1040-3590.8.4.350 Tang, J. E., T.-I. Tang, and C.-H. Chiang. 2014. “Blog learning: effects of users’ usefulness and efficiency towards continuance intention.” Behaviour & Information Technology 33 (1): 36–50. doi:10.1080/0144929X.2012.687772 Tinto, V. 1975. “Dropout from Higher Education: A Theoretical Synthesis of Recent Research.” Review of Educational Research 45 (1): 89–125. Tinto, V. 1988. “Stages of Student Departure: Reflections on the Longitudinal Character of Student Leaving.” The Journal of Higher Education 59 (4), 438– 455. doi:10.2307/1981920 Tyler-Smith, K. 2006. “Early Attrition among First Time eLearners : A Review of Factors that Contribute to Drop-out. Withdrawal and Non-completion Rates of Adult Learners undertaking eLearning Programmes.” Journal of Online Learning and Teaching 2 (2): 73–85..
(31) Van Gelder M. M., R. W. Bretveld, N. Roeleveld. 2010. “Web-based questionnaires: the future in epidemiology?” American Journal of Epidemiology 11 (1): 1292– 1298. https://doi.org/10.1093/aje/kwq291 Wang, H. C., and Y. F. Chiu. 2011. “Assessing E-Learning 2.0 System Success.” Computers. &. Education. 57. (2):. 1790–1800.. https://doi.org/10.1016/j.compedu.2011.03.009 Weigold A., I. K. Weigold, and E. J. Russell. 2013. “Examination of the equivalence of self-report survey-based paper-and-pencil and Internet data collection methods.” Psychological Methods 18 (1), 53-70. http://dx.doi.org/10.1037/a0031607 Wilcox P., S. Winn, M. Fyvie-Gauld. 2005. “‘It was nothing to do with the university, it was just the people’: the role of social support in the first‐year experience of higher education.” Studies in Higher Education 30 (6): 707-722, Doi: 10.1080/03075070500340036 Yang, M., Z- Shao, Q. Liu, and C. Liu. 2017. “Understanding the quality factors that influence the continuance intention of students toward participation in MOOCs.” Educational Technology Research and Development 65 (5): 1195–1214. doi:10.1007/s11423-017-9513-6 You J. W. 2016. “Identifying significant indicators using LMS data to predict course achievement in online learning.” The Internet and Higher Education 29: 23–30. Doi: https://doi.org/10.1016/j.iheduc.2015.11.003 Zhang, M., Y. Liu, W. Yan, and Y. Zhang. 2016. “Users’ continuance intention of virtual learning community services: the moderating role of usage experience.” Interactive. Learning. Environments. doi:10.1080/10494820.2016.1172242. 25. (6):. 685-703..
(32)
Figure


+6


Documento similar
The factors that condition these differences are mainly: (1) the specific vehicle fleet composition, having Barcelona a larger proportion of diesel and commercial vehicles and
The available data about students’ academic performance, creates an oppor- tunity to identify what factors affect student dropout and take preventive mea- sures to solve this
Due to the increased transmissibility, the evidence of increased severity and the potential for the existing licensed COVID-19 vaccines to be partially or significantly less
No obstante, como esta enfermedad afecta a cada persona de manera diferente, no todas las opciones de cuidado y tratamiento pueden ser apropiadas para cada individuo.. La forma
Other factors such as increased stress or cold could also be related to this phenomenon (25) although the scientific evidence on this topic is scarce. Although weight loss
Analyses of the enrolment in the schools show that Danish middle-class parents opt out of the local primary and lower secondary school if there is a relatively high number
The search for the research articles that constitute the sample to be analyzed was carried out in databases with high academic impact and a significant number of
In addition to these factors, time on HD was also positively associated to the severity of vascular calcifications, and higher haemoglobin levels were associated with a
