Convergence of EU regions A literature report
28
0
0
Texto completo
(2) 01 Eckey. 7/6/07. 6. 12:05. Página 6. Eckey, H. F. and Türck, M.. UE-15, etc.). En conjunto la mayoría de los modelos permiten concluir que se produce un proceso lento de convergencia. El aumento de las desigualdades regionales originadas por la ampliación de la UE con los nuevos Estados miembros del Centro y Este europeo explica la existencia de clubs de convergencia. Clasificación JEL: O41, R11, R12. Palabras clave: Convergencia regional, revisión bibliográfica, Europa.. 1. Introduction European economic integration, which began in the 1950s with the European Economic Community and the European Atomic Energy Community, has always been accompanied by the idea of a social cohesion (cf. Cuadrado-Roura/Parellada 2002, Tondl 2004 and Faludi 2006). The Treaty of Rome points out the need «to strengthen the unity of their economies and to ensure their harmonious development by reducing the differences existing among the various regions». One year after the signing of the Treaty of Rome the first programmes began that aimed at the reduction of the regional disparities [European Social Fund (ESF) and European Agricultural Guidance and Guarantee Fund (EAGGF)]. However, with the expansion of the cohesion programs the disparities became more important. Regional convergence is now a basic principle of regional policy. In the common provisions of the European Union Treaty «the strengthening of economic and social cohesion» (article B) is explicitly mentioned. This aim is specified in the second article: «The Community shall have as its task, (…) by implementing the common policies or activities (…), to promote throughout the Community a harmonious and balanced development of economic activities, (…) a high degree of convergence of economic performance (…) and economic and social cohesion and solidarity among Member States» (s. also the comment in Lammers 1998, p. 197 and Schwarze 2000, p. 56). These principles of the European Union Treaty are of particular importance for European policy (s. Bornschier/Herkenrath/Ziltener, 2004, p. 76 and Busch, 2004). Michel Barnier, former commissioner responsible for regional policy, describes the aim of the regional policy in the «third report on economic and social cohesion» as follows: «The purpose of this report (…) is to set out the European Commission’s vision for the future of Europe’s policy to reduce disparities and to promote greater economic, social and territorial cohesion» (European Commission, 2004). It should be noted that the EU funds spend about 30 billion Euros on convergence issues (Kramar 2006). Discussion about the efficiency of these programmes, especially recently, has been prevalent (s. Rodriguez-Pose/Fratesi 2002, Midelfart-Knarvik/Overman 2002, Südekum 2002 and Rodriguez-Pose/Fratesi 2004). In summary we can state that a study of the effectiveness of European regional policy is difficult. An empirical analysis must consider the economic development which would have occurred without the use of regional funding instruments. In parti-.
(3) 01 Eckey. 5/6/07. 14:00. Página 7. Convergence of EU-Regions. A Literature Report. 7. cular, the estimation of this situation is linked to certain problems due to the restrictions of data, windfall gains and crowding out effects. Windfall gains occur, for example, if enterprises would have made their investments even without subsidies (Lammers/Niebuhr 2002, pp. 55-58). Public funding is also confronted with the crowding out effect, which implies a displacement of private economic activity by subsidiaries. Nevertheless, it is difficult to measure windfall gains and the crowding out effects. Another point is that overall growth effects of the Structural Funds expenditure under certain fiscal and institutional conditions do not necessarily imply that a cohesion or convergent development is supported. Researchers usually use a regression, where the influence of the funding on growth is tested (cf. Bähr 2006 as well as Ederveen, de Groot and Nahuis, 2006). The slope in these growth regressions only delivers insights about the average impact on all regional units. A positive slope of the Structural Funds expenditure variable can also result from a growth effect caused by high growth rates in well-developed regions (spatial heterogeneity and extreme values). However, regional cohesion and the reduction of disparities are important objectives of European policy. As mentioned above, they have also a legal foundation. But policy implications must be based on an examination of the effectiveness of the European regional funding. Studies of convergence provide arguments for the necessity and the required amount of the Structural Funds. If a high convergence rate of all regions is proven, only a small amount of public expenditure must be spent on convergence issues. A divergent development of regions in the long run or a great dispersion of the convergence speed justifies high expenditures of the Structural Funds. Econometric analyses should always be embedded in a theoretical framework. Table 1 shows that there are different results about the prediction of regional development in the long run. Some approaches provide reasons for convergence, others for divergence. The neoclassical approach especially suggests convergence due to a diminishing marginal product of capital. The critical theories concerning the market activities –post-Keynesianism and polarisation theory– indicate that the differences of economic wealth will rise in the long run. Some theories do not conclude in a clear statement about this issue. In the endogenous growth theory and the new economic geography (NEG) the question of convergence and divergence rely on the specific economic conditions. Many studies deal with the issue of convergence and divergence, but they usually refer to the neoclassical growth theory. This was criticised by Armstrong (2002) five years ago, but little has changed since then. The objective of this study is an analysis of the different approaches examining European convergence as a literature report. The paper is organised as follows: In section 2 we review the concept and the empirical literature of ß-convergence. Section 3 outlines the second approach of Barro and Sala-i-Martin, the concept of σ-convergence. The studies of convergence clubs are summarised in section 4. The next section focuses on Markov chains. The paper concludes with some summarising comments..
(4) 01 Eckey. 5/6/07. 8. 14:00. Página 8. Eckey, H. F. and Türck, M.. Table 1. Theory. Convergence and divergence in theory. Reasons for divergence. Reasons for convergence. Neoclassic. –. Post-Keynesianism. A spatially mobile demand and external – shocks are the reason for divergence (Schmidt 1966).. Polarisation theory. Centripetal forces dominate and cause a di- – vergent process (Hansen 1975, Myrdal 1957, Hirschman 1965).. Endogenous growth theory. Positive external effect can cause a convergent or divergent development (Romer 1986, 1990 and Rivera-Batiz/Romer 1991).. New economic geography (NEG). Transport costs are the main determinant of regional development in the long run. Low transport costs explains a regional concentration of workers and divergence (Fujita/Krugman 2004, Fujita/Thisse 2002 as well as Krugman 1991a, 1991b, 1999).. 2.. Diminishing marginal product of capital justifies convergence (Solow 1956, Swan 1956, Barro/Sala-i-Martin 1990, 2004).. ß-convergence. A strand of literature investigates the issues of the ß-convergence framework, which is based on neoclassical growth theory (cf. Solow 1956 and Koopmans, 1965). ß-convergence occurs when all regions converge to the same steady state (absolute convergence) or if regions with the same initial conditions achieve the same GDP per capita in the long run (conditional convergence). In the absolute convergence model of Barro and Sala-i-Martin (1990, 1991, 1992) the average growth rate of income between the base year 0 and T is explained by the initial income. If the dependence is significantly negative in this growth regression, then an absolute convergence process is proven. The parameter ß, which can be derived from the slope in the growth regression, captures the rate at which regions approach their steady state. Often the half life is also used, which expresses the time span until disparities are halved. Usually the convergence rate takes values around 2%, which implies a half life of 28 years. The 2%-rate of convergence is sometimes «discovered as a ‘natural constant’» (Abreu/de Groot/Florax 2005b, p. 390). Additionally, the conditional convergence model contains control variables in order to cover the different initial conditions of economies. In the following empirical results of ß-convergence in the sense of Barro and Sala-i-Martin are reported (cf. Table 2). Cuadrado-Roura (2001) and López-Bazo (2003) analyse the absolute ß-convergence for the periods of 1977 to 1994 and 1975 to 1996. They use the income per capita of EU-regions and discover only weak tendencies towards convergence. The absolute convergence rate is slower than 2%. Thus, it takes 35 years until the disparities are halved. Regions which yield a below-.
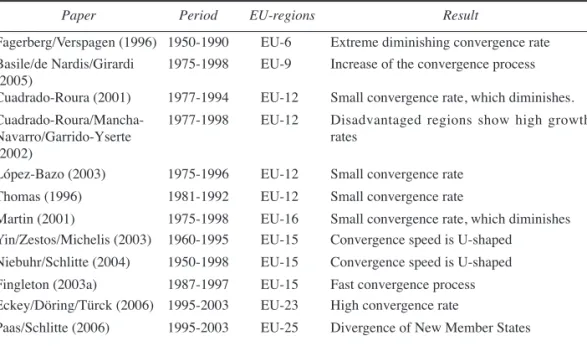
(5) 01 Eckey. 5/6/07. 14:00. Página 9. Convergence of EU-Regions. A Literature Report. Table 2. Paper. 9. Results of absolute ß-convergence. Period. EU-regions. Result. Fagerberg/Verspagen (1996) 1950-1990. EU-6. Extreme diminishing convergence rate. Basile/de Nardis/Girardi (2005) Cuadrado-Roura (2001). 1975-1998. EU-9. Increase of the convergence process. 1977-1994. EU-12. Small convergence rate, which diminishes.. Cuadrado-Roura/ManchaNavarro/Garrido-Yserte (2002) López-Bazo (2003). 1977-1998. EU-12. Disadvantaged regions show high growth rates. 1975-1996. EU-12. Small convergence rate. Thomas (1996). 1981-1992. EU-12. Small convergence rate. Martin (2001) Yin/Zestos/Michelis (2003). 1975-1998 1960-1995. EU-16 EU-15. Small convergence rate, which diminishes Convergence speed is U-shaped. Niebuhr/Schlitte (2004). 1950-1998. EU-15. Convergence speed is U-shaped. Fingleton (2003a) 1987-1997 Eckey/Döring/Türck (2006) 1995-2003. EU-15 EU-23. Fast convergence process High convergence rate. Paas/Schlitte (2006). EU-25. Divergence of New Member States. 1995-2003. average initial value of income per capita tend to have an above-average growth rate. Thomas (1996) also proves a very slow convergence process for the period of 19811992. Cuadrado-Roura, Mancha-Navarro and Garrido-Yserte (2002, p. 29) refer to the GDP per capita and the GDP per employee. They prove convergence for both indicators. In particular, regions with «old industries» display below average growth rates, whereas areas with low initial levels in Spain and Italy can be characterised by high growth rates. Martin (2001) also calculates an absolute convergence model with the GVA per employee. He finds a lower convergence rate than Cuadrado-Roura (2001), but both researchers conclude that the convergence speed diminishes. An extreme diminishing convergence speed is detected by Fagerberg and Verspagen (1996) for the period 1950-1990 and the first six members. This result is not verified in the studies of Yin, Zestos and Michelis (2003, p. 199) as well as Niebuhr and Schlitte (2004) on the basis of EU-15 countries. In the absolute convergence model of Yin/Zestos/Michelis (2003) over the period 1960-1995 and of Niebuhr/Schlitte (2004) over the period 1950-1998 the convergence speed is U-shaped. It reaches its lowest point at the beginning of the 1980s. These results are in line with the study of Basile/de Nardis/Girardi (2005). Basile, de Nardis and Girardi (2005) prove no significant absolute convergence during 1975-1985, but a significant value over the period 1985-1998. The aim of Fingleton (2003a) is to investigate European convergence with different estimations over the period 1987-1997. In an absolute convergence approach the coefficient of initial GDP yields a half life of about 21 years, which is comparable high. This result stands in line with the above mentioned fast convergence process in.
(6) 01 Eckey. 5/6/07. 10. 14:00. Página 10. Eckey, H. F. and Türck, M.. the 1990s. But Fingleton points out: «It (…) seems realistic to assume that European regions will be converging on different steady states» (2003a, p. 23) due to their heterogeneity. Thus, the different economic conditions are modelled as a function of some control variables like indicators of infrastructure, of structural change and educational attainment. In this conditional convergence model the half life is shorter in comparison with the absolute convergence model. Yin, Zestos and Michelis (2003, p. 199) find also a higher convergence rate, if conditioning variables like economic explanatory variables or socio-political variables are included. They draw also a policy recommendation from this result: «The EU countries could converge at a faster rate if they could reduce economic and socio-political differences» (Yin/Zestos/Michelis 2003, p. 206). Nevertheless, the enlargement of the EU of Eastern European countries provides new challenges for the integration policy (cf. Tondl 2002 and Faludi, 2006). It should be noted that the examining period of a convergence analysis of the enlarged EU is limited. The collapse of communism and the economic transformations provide good reasons for why the data of the beginning of the 1990s is not comparable with the data of the following periods. Eckey/Döring/Türck (2006) and Paas/Schlitte (2006) include in their sample the New Member States from Eastern and Central Europe. Eckey, Döring and Türck (2006) find a high convergence speed of 4.2% for the whole sample. Additionally, Paas and Schlitte (2006) diagnose a convergence process of EU-15 and EU-25, but not of the New Member States from Central and Eastern Europe. A spatial dependence between regions can arise from migration of labour and human capital, technological and knowledge spillovers as well as commuter flows (cf. Rey/Janikas 2005, p. 158, Fingleton 2003b, Döring/Schnellenbach 2006 and Stough 1998). This is a special problem of an OLS-growth regression (Temple 1999, p. 130), because it yields a bias of regression coefficients or an invalidation of significance tests (cf. Anselin 1988, pp. 57, Fingleton 1999b, Ord 1975 and Cliff/Ord 1973, pp. 90). Rey and Janikas pointed out recently that «the development of spatially explicit methods for analysing regional economic convergence (…) has only recently begun to attract attention» (Rey/Janikas 2005, p. 156). In contrast to time series analysis the dependence is not clear in spatial econometric models. The simplest way to consider a spatial dependence between regions consists in using a binary weight matrix. This matrix expresses the neighbouring structure of regions. A problem particular to this is that a weighting scheme is needed, because it is not possible to estimate different weights for every region. In practice a spatial dependency is mostly included by a spatial lag of a variable, which is an average of the values in the neighbouring regions. However, there are two popular models, the spatial error model with a spatial dependency of the error term and the spatial lag model, which includes a spatial lag of the dependent variable (cf. Anselin, 1988, p. 22 and Anselin/Bera, 1998). An overview of spatial convergence models is given in Table 3. The aim of the study of Baumont, Erthur and Le Gallo (2003) is to estimate an absolute convergence model taking into account spatial dependencies of neighbouring regions. The detected autocorrelation of an OLS-model is treated by a spatial error term (spatial error.
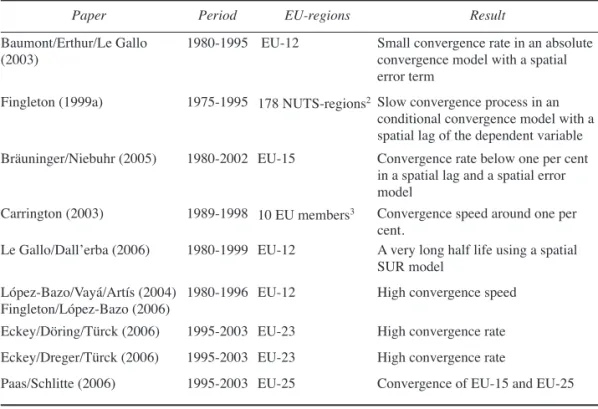
(7) 01 Eckey. 5/6/07. 14:00. Página 11. Convergence of EU-Regions. A Literature Report. Table 3. Paper. 11. Results of spatial ß-convergence models Period. EU-regions. Result. Baumont/Erthur/Le Gallo (2003). 1980-1995 EU-12. Small convergence rate in an absolute convergence model with a spatial error term. Fingleton (1999a). 1975-1995 178 NUTS-regions2 Slow convergence process in an conditional convergence model with a spatial lag of the dependent variable. Bräuninger/Niebuhr (2005). 1980-2002 EU-15. Convergence rate below one per cent in a spatial lag and a spatial error model. Carrington (2003). 1989-1998 10 EU members3. Le Gallo/Dall’erba (2006). 1980-1999 EU-12. Convergence speed around one per cent. A very long half life using a spatial SUR model. López-Bazo/Vayá/Artís (2004) 1980-1996 EU-12 Fingleton/López-Bazo (2006). High convergence speed. Eckey/Döring/Türck (2006). 1995-2003 EU-23. High convergence rate. Eckey/Dreger/Türck (2006). 1995-2003 EU-23. High convergence rate. Paas/Schlitte (2006). 1995-2003 EU-25. Convergence of EU-15 and EU-25. model). The convergence rate over the period of 1980-1995 is quite low (1.2%). A similar approach is conducted by Fingleton (1999a) for the period of 1975-1995 and by Bräuninger and Niebuhr (2005) for the period of 1980-2002. The researchers use a spatial lag model. They control for the peripherality and the economic structure of regions. The ML-estimation of Fingleton (1999a) yields a convergence speed of 1.2%. Bräuninger and Niebuhr (2005) find an even lower convergence speed in a spatialerror- and a spatial-lag-model (below 1%). Carrington (2003) uses a spatial lag of patents as a proxy variable of knowledge spillovers, which is added to an absolute convergence model. Different estimations, including a spatial error and a spatial lag term, show a significant convergence speed around one per cent. Le Gallo and Dall’erba (2006) estimate a spatial seemingly unrelated regression (SUR) model to examine absolute convergence. The SUR model contains two equations for the examining periods (1980-1989 and 1989-1999)4 .The inclusion of a spatial error term leads to a reduction of the convergence speed, which is in both periods around one per cent. Nevertheless, the results also seem to depend on the specification of the continuity matrix as well as on the conditioning variables. López-Bazo, Vayá and Artís 2 3 4. In the paper it is not specified which countries these regions belong to. The analysis covers the following countries: EU-6 plus Austria, Denmark, Ireland and Spain. Further information about spatial SUR models can be found in Anselin 1988, p. 141..
(8) 01 Eckey. 5/6/07. 12. 14:00. Página 12. Eckey, H. F. and Türck, M.. (2004) as well as Fingleton and López-Bazo (2006) find different speeds of convergence, when other continuity matrixes are used. The calculated speeds of convergence exceed 2%, which is caused by the conditioning variables. The authors select the sectoral structure, knowledge and climate etc., in order to capture the different initial conditions. Some researchers also include the Member States of Central and Eastern Europe in their convergence analysis. Eckey, Döring and Türck (2006) choose the period 1995-2003 and the Member States of the enlarged European Union without Bulgaria and Romania, which joined the EU on 1 January 2007, for their convergence analysis. The islands Cyprus and Malta are excluded for statistical reasons. Eckey, Döring and Türck (2006) estimate an absolute ß-convergence model including a spatial error term. They detect a high convergence speed of 3.5%, which is caused by the high growth rates of the Eastern European Members. Eckey, Dreger and Türck (2006) refer to the Mankiw-Romer-Weil (1992) model. This model augments a Solow model with human capital, which seems to be vital for the growth process (cf. Islam 2003, p. 318 and Aiginger/Falk 2005). Because the control variables depreciation rate and rate of technological progress are not available on a regional basis, they use country specific estimations. Eckey, Dreger and Türck (2006) come across considerably high convergence rates even if the problem of spatial autocorrelation is removed by a spatial error term and the spatial filtering procedure of Griffith (1996, 2000, 2003). Paas and Schlitte (2006) detect a significant convergence process for EU-15 and EU-25 for the period of 1995-2003. For the New Member States the consideration of spatial effects removes the significance of the slope. The researchers conclude that the estimation with spatial effects yields «considerably lower convergence rates than the OLS» (Paas/Schlitte 2006, p. 22) model. Another approach is to analyse the ß-convergence for different sectors. Bivand and Brunstad (2003, 2005), for example, select the agriculture sector and the period of 1989-1999. They estimate an absolute convergence model and find a convergence speed of 0.75%. However, this estimation is by no means appropriate due to spatial autocorrelation. If a spatial lag in the exogenous variable is included, then the convergence speed reduces significantly. In a second step Bivand and Brunstad (2005) calculate a conditional convergence approach using the subsidies and the importance of the agriculture sector as control variables. In the conditional convergence model the convergence speed is higher than in the absolute convergence model. Some researchers distinguish between globally measured convergence and convergence taking into account the different economic conditions of countries (within country convergence) (Cuadrado-Roura 2001, p. 346). Armstrong (1995), for example, estimates an absolute convergence model that also contains country-specific dummy-variables in order to calculate the convergence speed within countries (cf. also Table 4). He separates the data-set (1950-1990) in subperiods of ten years to control time-variant heterogeneity. Both models –estimating with and without dummy-variables– show a decrease of convergence over the examined period. If regions from Greece and Spain are included, the speed of convergence changes only slightly. Similar models are estimated by Fingleton (1999a) for the period 1975-1995, by Fagerberg and Verspagen (1996) for the period 1950-1990, by Geppert, Happich.
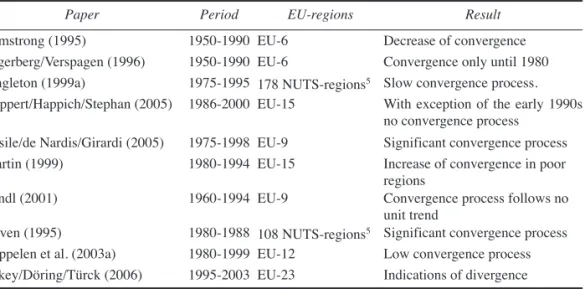
(9) 01 Eckey. 5/6/07. 14:00. Página 13. Convergence of EU-Regions. A Literature Report. 13. and Stephan (2005) for the period 1986-2000 and by Basile/de Nardis/Girardi (2005) for 1975 to 1998. Fingleton controls –in contrast to Fagerberg/Verspagen (1996), Geppert/Happich/Stephan (2005) and Basile/de Nardis/Girardi (2005)– for spatial dependencies. The ML-estimation of a spatial lag model yields a within country convergence rate of 0.8% (Fingleton 1999a). The paper of Fagerberg and Verspagen (1996) provides only slight evidence for regional convergence until 1980. Afterwards no convergence process can be proven. Geppert, Happich and Stephan (2005) detect with exception of the early 1990s no convergence process, when country-specific dummy variables are included. A different result is found in the study of Basile/de Nardis/Girardi (2005). The estimation yields a significant convergence process for the whole period (1975-1998) and for two subperiods (1975-1985 and 1985-1998). Table 4.. Results of ß-convergence models with country specific dummies. Paper. Period. EU-regions. Armstrong (1995) Fagerberg/Verspagen (1996) Fingleton (1999a) Geppert/Happich/Stephan (2005). 1950-1990 1950-1990 1975-1995 1986-2000. EU-6 EU-6. Basile/de Nardis/Girardi (2005) Martin (1999). 1975-1998 EU-9 1980-1994 EU-15. Tondl (2001). 1960-1994 EU-9. Neven (1995) Cappelen et al. (2003a) Eckey/Döring/Türck (2006). 1980-1988 108 NUTS-regions5 1980-1999 EU-12 1995-2003 EU-23. 178 NUTS-regions5 EU-15. Result Decrease of convergence Convergence only until 1980 Slow convergence process. With exception of the early 1990s no convergence process Significant convergence process Increase of convergence in poor regions Convergence process follows no unit trend Significant convergence process Low convergence process Indications of divergence. Martin (1999), Tondl (2001), Neven (1995) and Cappelen et al. (2003a) conduct elaborate analyses with country specific dummy variables. The paper of Martin (1999) differentiates between four convergence models. All models are estimated for the period 1980-1994 as well as the subperiods 1980-1987 and 1987-1994. An absolute convergence approach shows a significant negative relationship between initial income and growth of income in 145 European regions. While in objective 1 regions the speed of convergence increases, it decreases in the remaining regions. This result is confirmed, when the model is augmented with country-specific dummy-variables. Tondl (1997, 2001) also uses country-specific dummy-variables in a ß-convergence model. She estimates different models for subperiods and locates no unit trend in the convergence process. In the study of Neven (1995) separate estimations for north and south European regions are conducted for the period of 1980-1988. If country effects are included, then the convergence rates are significant. Cappelen et 5. In the paper it is not specified which countries these regions belong to..
(10) 01 Eckey. 5/6/07. 14. 14:00. Página 14. Eckey, H. F. and Türck, M.. al. (2003a) control the ß-convergence model of sectoral differences, the EU-funding and several regional characteristics (unemployment, R&D et al.). They prove a significant convergence speed of 1.7%. If country specific dummy variables are included in the regression equation, the convergence speed decreases and lies at 1%. If the New Member States are considered, then the control of the different initial conditions of countries appears essential to the elimination of spatial heterogeneity. Eckey, Döring and Türck (2006) prove substantial different initial values of labour productivity and the growth of this variable in Member State groups. Thus, they include country groups as dummy variables in a ß-convergence model. However, the results are limited by the fact that the researchers detect a spatial autocorrelation, which can not be eliminated by the standard methods suggested by Anselin (1988). Therefore, they filter both variables using the Griffith method (Griffith, 1996, 2000, 2003). If the spatial components are extracted from the variables, the slope changes the sign. The spatial filtered model yields indications of divergence. Some researchers investigate the convergence of European regions with a panel data framework. The advantage of a panel data approach is that individual regional effects are incorporated in the model (Temple, 1999, p. 126). However, panel data convergence studies often find very high convergence rates. This may be caused by a spatial autocorrelation, which is usually not controlled (cf. Badinger/Müller/Tondl 2004). Tondl (2001), for example, examines the convergence framework in the period from 1975 to 1994. She uses two panel estimators to prevent a small sample bias. Both approaches show that European regions are converging by an amazing rate of 21%. Regarding subperiods the convergence speed reaches even 82% from 1980 to 1986. Regarding sub periods, the convergence speed reaches even 82% during the time period of 1980-1986. The paper of Cuadrado-Roura (2001) also investigates a conditional convergence model, which contains fixed effects. This approach shows a higher convergence rate in comparison with the absolute convergence model. Cuadrado-Roura (2001, p. 345) concludes that «regional convergence is actually ‘conditioned’», because «some factors are limiting the process». While the absolute convergence has diminished in the period of 1986-1994 in comparison to the period of 1977-1986, the conditioned convergence has increased. Badinger, Müller and Tondl (2004) propose a two-step procedure to prevent an overestimation of the convergence rate. First, they filter the data with an approach of Getis and Griffith (2002) as well as Getis and Ord (1992). The spatial filtering approach separates spatial components from the used variables. Second, they estimate a panel model with the filtered variables. They find a convergence rate of 6.9% in the period from 1985 to 1999. In addition they compare the two-step procedure with a panel model based on unfiltered variables. They assume that the spatial autocorrelation, which is checked by Moran’s I, yields to a convergence rate of 21.9%6. A new aspect is the estimation of locally different parameters of ß-convergence, because the variation of parameters can lead to inconsistent estimators (s. Temple 6. Further information about spatial panel models is provided by the studies of Islam (1995), Caselli/Esquivel/Lefort (1996) and Bond/Hoeffler/Temple (2001)..
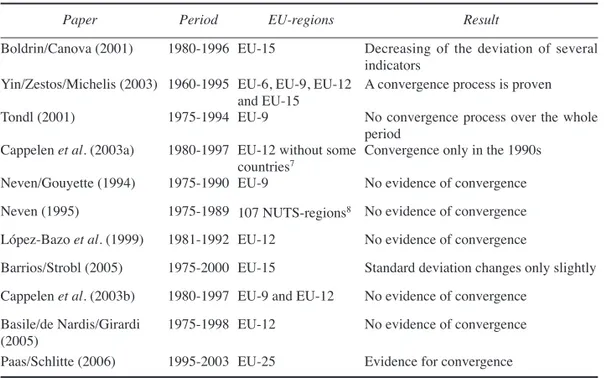
(11) 01 Eckey. 5/6/07. 14:00. Página 15. Convergence of EU-Regions. A Literature Report. 15. 1999, p. 126 and Lee/Pesaran/Smith 1998, p. 321). Locally different parameters can be calculated using the technique of geographically weighted regression, which is developed by Brunsdon, Charlton and Fotheringham (s. Brunsdon/Fotheringham/Charlton 1998, p. 957 and Fotheringham/Brunsdon/Charlton 2002). The values of the independent variables from regions, which are nearer to another region, have a greater influence and receive a greater weight in the calibration. The estimation procedure is similar to the OLS estimation. Only a few convergence studies of European regions use the geographically weighted regression (GWR). Bivand and Brunstad (2005) estimate an absolute convergence model with different regression coefficients for every region. The parameters vary extensively, and they have changing signs. So some regions have a positive and others a negative convergence speed. The diverging regions with a negative convergence rate are located mostly in the middle of Europe (Germany, Austria, Switzerland et al.). Almost all French regions have a high convergence rate above 2%. If the model is augmented with control variables (subsidiaries of the agriculture sector for example), the results are mainly the same. Eckey, Döring and Türck (2006) estimate an absolute convergence model using GWR, Member States of the enlarged European Union and the period over 1995-2003. They also find a changing sign of the slope. Whereas most regions are converging, some areas of Ireland, Belgium, The Netherlands, United Kingdom, Germany and Poland seem to be moving away from their steady state value. However, the changing sign of the slope can be a methodological artefact, because the inclusion of control variables leads to the fact that all regions are converging in the GWR model (Eckey/Dreger/Türck 2006).. 3.. σ-convergence. The σ-convergence approach is another concept of Barro and Sala-i-Martin (2004, p. 462). A decline of the dispersion of income per capita and other indicators provide empirical evidence for σ-convergence. Note that σ-convergence only occurs, if ß-convergence takes place. But the existence of ß-convergence is not a sufficient condition for σ-convergence. Therefore, absolute ß-convergence can be proven with and without decreasing dispersion of income (=σ-convergence) (Terrasi, 2002, p. 189). However, this σ-convergence approach is criticised, because it uses data on an aggregated level. Another problem is that the geographical pattern could change over time due to various factors, like migration, etc. (Rey/Dev 2006, p. 160). Some researchers use the concept of σ-convergence to measure tendencies towards convergence in Europe (see Table 5). Boldrin and Canova (2001), for example, find that the standard deviation of several indicators –labour productivity, income per capita and GDP per capita– is decreasing in the period of 1980-1996, which supports the σ-convergence hypothesis. An exception is the unemployment rate, which shows no tendency towards convergence. The paper of Yin, Zestos and Michelis (2003) studies σ-convergence for the period of 1960-1995 by using the standard deviation of GDP per capita. They consider several country groups, and this allows one to detect different patterns of convergence. σ-convergence is proven for the EU-6 (Belgium,.
(12) 01 Eckey. 5/6/07. 16. 14:00. Página 16. Eckey, H. F. and Türck, M.. France, Germany, Italy, Luxembourg, Netherlands) with the exception of the period 1980-1995 as well as the EU-9 (composed of EU-6 and Denmark, Ireland and UK), the EU-12 (EU-9 plus Spain, Portugal and Greece) and the EU-15 (includes EU-12 and Austria, Finland and Sweden) for the entire period. Cappelen et al. (2003a) find evidence for σ-convergence only in the 1990s. Table 5.. Results of σ-convergence models using the standard deviation. Paper Boldrin/Canova (2001). Period. EU-regions. Result. 1980-1996 EU-15. Yin/Zestos/Michelis (2003) 1960-1995. Decreasing of the deviation of several indicators EU-6, EU-9, EU-12 A convergence process is proven and EU-15 EU-9 No convergence process over the whole period EU-12 without some Convergence only in the 1990s countries7 EU-9 No evidence of convergence. Tondl (2001). 1975-1994. Cappelen et al. (2003a). 1980-1997. Neven/Gouyette (1994). 1975-1990. Neven (1995). 1975-1989 107 NUTS-regions8 No evidence of convergence. López-Bazo et al. (1999). 1981-1992 EU-12. No evidence of convergence. Barrios/Strobl (2005). 1975-2000 EU-15. Standard deviation changes only slightly. Cappelen et al. (2003b). 1980-1997 EU-9 and EU-12. No evidence of convergence. Basile/de Nardis/Girardi (2005) Paas/Schlitte (2006). 1975-1998 EU-12. No evidence of convergence. 1995-2003 EU-25. Evidence for convergence. Other researchers do not find evidence for σ-convergence. Tondl (2001, p. 15) measures the dispersion of GVA per capita of European regions for the period of 1975-1994. The standard deviation increases until 1981, and afterwards the disparities decline. The regions of the EFTA show a similar pattern. However, there are cyclical fluctuations as well. During a recession, inequalities always increase, whereas disparities diminish during high growth periods. The papers of Neven/Gouyette (1994), Neven (1995), López-Bazo et al. (1999), Barrios/Strobl (2005), Cappelen et al. (2003b) and Basile/de Nardis/Girardi (2005) reject also the σ-convergence hypothesis for all European regions. However, Neven (1995) identifies different patterns of the convergence process in northern and southern Europe. While the total standard deviation of the output per capita only changes to a small extent over the period of 1980-1989 in all examined regions, the southern group shows a tendency towards divergence beginning in the mid 1980s. By contrast, the disparities in northern Euro-. 7 8. Denmark, Ireland and Luxemburg as well as East Germany are excluded. The paper fails to mention which countries these regions are from..
(13) 01 Eckey. 5/6/07. 14:00. Página 17. Convergence of EU-Regions. A Literature Report. 17. pean regions have fallen during that period. The same result is detected by Cappelen et al. (2003b, pp. 325) from 1980 to 1997. Paas and Schlitte (2006) conduct a σ-convergence analysis for the enlarged EU. They use the standard deviation of GDP per capita. The σ-convergence hypothesis is supported in the cases of EU-15 as well as of EU-25. In addition, the researchers examine the within country convergence process, which implies a separate analysis of the standard deviation for each Member States. However, these calculations merely show tendencies towards convergence for some countries, and the authors summarise that σ-convergence «was driven by national factors» (Paas/Schlitte, 2006, p. 11). The measures of concentration are also used to examine σ-convergence. The study of Fingleton (2003a) for example compares the development of several measures of dispersion of GDP per capita for European regions. The coefficient of variation, the Gini coefficient and the range show a slight reduction of disparities over the period 1987-1997. The inter-quartile range is characterised by an above-average reduction over time. This is attributed to extreme values, which persist. Cappelen et al. (2003b) examine the development of GDP per capita and find no significant decline of the Gini coefficient over the period 1980-1997. Castro (2003, p. 74) ensures the robustness of the results by computing different indicators of disparity. All measures show a clear reduction of income inequalities over the period of 1980-1996, yet there is a variation. While the Atkinson index indicates a fall of 26.5%, the Gini coefficient decreases by 9.3%. Stirböck (2002, p. 7) calculates the Gini coefficient for the relative specialisation of capital formation. She points out that the specialisation is higher in Belgium, France and Italy than in other countries. Hallet (2002) uses in a sophisticated analysis 17 branches to examine specialisation and concentration of EU-15 Member States over the period 1981-1995. He concludes that the specialisation has especially increased in areas with a high share of services and that «there is a strong convergence towards the average sectoral composition» (Hallet, 2002, p. 60). In addition, Hallet calculates other measures, and he finds different patterns of the degree of concentration. In summary, he points out that there is a high stability of the spatial pattern over time. Giannias, Liargovas and Manolas (1999) examine σ-convergence not only for economic but also for social and quality of life indicators, like passenger cars or doctors per 1000 inhabitants. They calculate the coefficient of variation for the years 1970, 1975, 1980, 1985 and 1990. The graphic illustration shows no equal trend for all indicators. A further analysis for the Mediterranean and the EU-12 countries reveals no uniform development. Thus the researchers use a weighted average of these coefficients, whereas the weights are based on an experts’ opinion survey. This measure shows a convergence process, which is disrupted in the early 1980s.. 4.. Convergence Clubs. Another concept of convergence is the club convergence hypothesis. While the absolute ß-convergence model assumes that all regions converge to the same steady state value, the conditional ß-convergence model suggests that the equilibrium of regions.
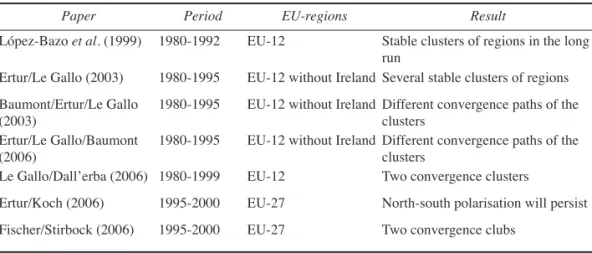
(14) 01 Eckey. 7/6/07. 18. 12:06. Página 18. Eckey, H. F. and Türck, M.. is determined by the initial values of control variables. However, areas are normally different in the structural characteristics used in the conditional ß-convergence framework. Therefore the conditional ß-convergence model assumes the other extreme compared to the absolute ß-convergence model. All regions are converging to different equilibriums. This duality of the ß-convergence model often faces criticism (cf. Baumont/Ertur/Le Gallo 2003, pp. 133-134). A compromise between both extreme views lies in the application of a convergence club model. Convergence clubs are regions with similar initial conditions which converge to the same steady state value (cf. Canova 2004, p. 49 and Quah 1996a). Several theoretical approaches suggest convergence clubs. From a neoclassical growth perspective convergence clubs may arise, when the saving rate out of wages is larger than the saving rate out of capital (Dalgaard/Hansen, 2004). The endogenous growth theory emphasises the importance of human capital and knowledge in the production (see for example Lucas, 1988; Romer, 1990 and Romer, 1986). The different initial values of human capital or knowledge may result in multiple state equilibriums (Galor, 1996). A standard model of club convergence employs local indicators of spatial association (LISA) in order to detect convergence clusters. In particular, the Getis/Ord (1992, 1996) statistics allows identifying clusters of neighbouring regions with above average values of the georeferenced variable («hot spots») or a spatial concentration of low x-values («cold spots»). If this geographical configuration of areas is stable over time, then there are clear indications for ß-convergence. Some researchers also employ a ß-convergence model on the clusters. If the slope of the initial values is different for the groups (spatial heterogeneity9), then the existence of convergence clubs is proven. The results of these models are presented in Table 6.. Table 6. Paper. Results of examining convergence clubs with LISA Period. López-Bazo et al. (1999). 1980-1992. Ertur/Le Gallo (2003). 1980-1995. EU-regions. Result. EU-12. Stable clusters of regions in the long run EU-12 without Ireland Several stable clusters of regions. Baumont/Ertur/Le Gallo 1980-1995 (2003) Ertur/Le Gallo/Baumont 1980-1995 (2006) Le Gallo/Dall’erba (2006) 1980-1999. EU-12 without Ireland Different convergence paths of the clusters EU-12 without Ireland Different convergence paths of the clusters EU-12 Two convergence clusters. Ertur/Koch (2006). 1995-2000. EU-27. North-south polarisation will persist. Fischer/Stirbock (2006). 1995-2000. EU-27. Two convergence clubs. 9. Further explanations about spatial heterogeneity can be found in López-Bazo, Vayá and Artís (2004) as well as Abreu, de Groot, and Florax (2005a)..
(15) 01 Eckey. 5/6/07. 14:00. Página 19. Convergence of EU-Regions. A Literature Report. 19. López-Bazo et al. (1999, pp. 361) calculate two measures of LISA for European regions: Getis/Ord statistics (cf. Getis/Ord, 1992, 1996, Ord/Betis 1995 and Haining 2004) and local-Moran statistics (Anselin, 1995, 1996) of GDP per capita and labour productivity. They find several convergence clusters with an above-average economic development in northern Germany and southern Italy. Other clusters in the Netherlands and the United Kingdom start with above-average values but have low growth rates. The clusters are quite persistent, because there is a «lack of evidence of significant movements in the compositions of detected hot spots» (López-Bazo et al. 1999, p. 364) during the period 1980-1992. Ertur and Le Gallo (2003) also find several clusters of regions with significant different GDP per capita in the cluster. Most regions remain in the same group between 1980 and 1995. The researchers conclude that the «results show a high persistence of spatial disparities between European regions over time» (Ertur/Le Gallo 2003, p. 72). Baumont, Ertur and Le Gallo (2003) use the Moran scatterplot, where the logarithm of GDP per capita 1980 is plotted against the spatial lag of this variable, in order to examine convergence clubs. They detect two spatial clubs, whereas the first cluster includes northern European regions and the second group Mediterranean countries. Only the countries of the second cluster converge in an unconditional ß-convergence model. This result is confirmed by further estimations of Ertur, Le Gallo and Baumont (2006). Le Gallo and Dall’erba (2006) use the Getis/Ord statistics to detect rich and poor European regions. The rich regions are named «core» and the other regions «periphery». Their analysis of convergence covers the period 1980-1999. The spatial SUR model proves a convergence process only for the peripheral regions. However, if the data set of European convergence studies is extended by the New Member States from Central and Eastern Europe, the classical North-South polarisation does not hold. Instead, the enlargement of the EU leads to a North-West-East polarisation. Ertur and Koch (2006) detect this schema using the Getis/Ord statistics, the EU-27 Member States (including Bulgaria and Romania) and the indicator GDP per capita 1995 and 2000. The first cluster of poor areas contains nearly all regions of the New Member States (group of Eastern European countries), whereas the rich cluster is located in Northern and Western European areas. It is interesting that these two clusters are not robust, because the spatial structure of the clustering structure does not persist, when the indicator growth rate of GDP per capita is used. A further step is conducted by Fischer and Stirbock (2006), who define not only clusters of regions from the enlarged European Union, but also analyse the behaviour of the clusters in the long run with an econometric ß-convergence model. The calculation of Getis/Ord statistics confirms the result of the Ertur and Koch (2006) that there are two clusters. The first cluster consists of most EU-15 without some areas of the Iberian Peninsula, Italy and Greece. All other regions represent the cluster of the «poor» areas, which is located in Eastern and South Europe. Fischer and Stirbock (2006) estimate an absolute ß-convergence model using OLS and testing the hypothesis that both slopes are equal. Fischer and Stirbock (2006) consider the rejection of that hypothesis as further evidence for club convergence. The authors also include a spatial error term for both clusters in order to prevent a bias of the regression coeffi-.
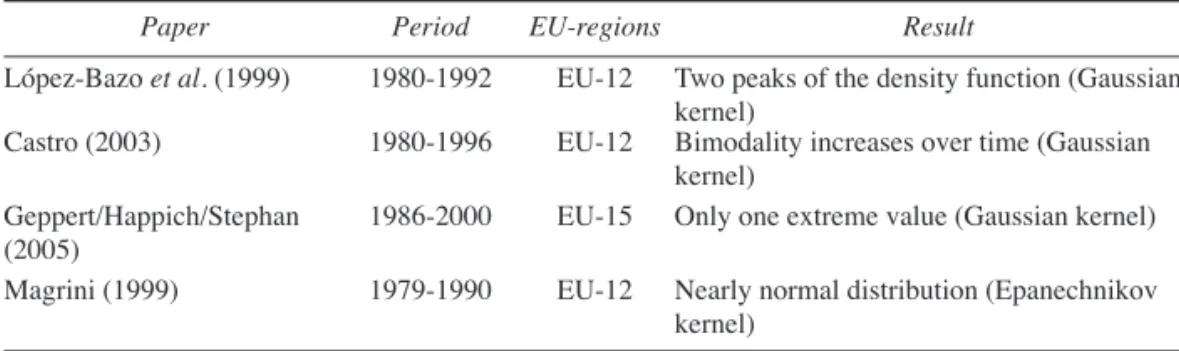
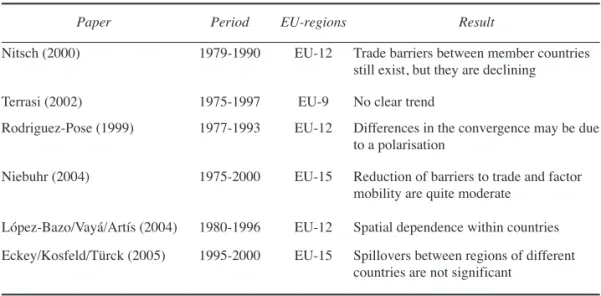
(16) 01 Eckey. 5/6/07. 20. 14:00. Página 20. Eckey, H. F. and Türck, M.. cients. They find a significant convergence rate of 1.6% for the first cluster and 2.4% for the second cluster using the spatial error model. Some researchers use density functions of labour productivity or GDP per capita to examine convergence clubs. The estimation is usually based on a Gaussian kernel (cf. Table 7). If the regional distribution is multimodal, then the hypothesis of convergence clubs is supported10. López-Bazo et al. (1999) and Castro (2003) use Member States form EU-12. They detect one dominating peak of the distribution and another smaller extreme value. This finding confirms the existence of two convergence clubs. Geppert, Happich and Stephan (2005) refer to a later period and an enlarged dataset. However, they do not confirm the convergence club hypothesis, because the distribution is characterised by only one peak. Magrini (1999) use a similar period as LópezBazo et al. (1999) but another kernel. This might cause the approximately normal distribution of the density function, which revises the convergence club hypothesis. Table 7. Paper. Results of examining the density function Period. EU-regions. López-Bazo et al. (1999). 1980-1992. EU-12. Castro (2003). 1980-1996. EU-12. Geppert/Happich/Stephan (2005) Magrini (1999). 1986-2000. EU-15. 1979-1990. EU-12. Result Two peaks of the density function (Gaussian kernel) Bimodality increases over time (Gaussian kernel) Only one extreme value (Gaussian kernel) Nearly normal distribution (Epanechnikov kernel). Some researchers examine the «national effect» or «national (state) dimension effect» (Cuadrado-Roura, 2001, p. 342). The «national effect» implies that the link of regions from one country is tighter than of areas belonging to different countries. European integration is successful, if the «national effect» diminishes. The persistence of the «national effect» could favour convergence clubs of national states. Empirical evidence of the «national effect» would also mean that there are clusters of regions from Member States. Nitsch (2000) analyses the «national effect» of European regions from 1979 to 1990 (cf. Table 8). The seemingly unrelated regression (SUR) yields coefficients of determinations, which lie around 0.90. Therefore, the explanatory power of the model is quite high. The dummy variable for international trade shows that the exports between two regions of the same country are about seven to ten times higher than between regions of partner countries. In addition to economic factors, different languages make up an important trade barrier. In a second step he splits the whole sample into sub-periods of 3 years and by doing so discovers a decline of the «national effect». Terrasi (2002) uses the disaggregation of the Theil index (1967) into bet10. For details of this interpretation see López-Bazo et al. (1999)..
(17) 01 Eckey. 5/6/07. 14:00. Página 21. Convergence of EU-Regions. A Literature Report. Table 8. Paper. 21. Results of examining the «national effect» Period. EU-regions. Result. Nitsch (2000). 1979-1990. EU-12. Trade barriers between member countries still exist, but they are declining. Terrasi (2002). 1975-1997. EU-9. No clear trend. Rodriguez-Pose (1999). 1977-1993. EU-12. Differences in the convergence may be due to a polarisation. Niebuhr (2004). 1975-2000. EU-15. Reduction of barriers to trade and factor mobility are quite moderate. López-Bazo/Vayá/Artís (2004). 1980-1996. EU-12. Spatial dependence within countries. Eckey/Kosfeld/Türck (2005). 1995-2000. EU-15. Spillovers between regions of different countries are not significant. ween-country and within-country components. The «national effect», which is measured by the last mentioned factor, shows no straightforward trend. Rodriguez-Pose (1999) uses a weighting schema of the GDP per capita to examine the Member States differences in the convergence process. He finds out that the different economic conditions of the Member States have an impact on the convergence process. A paper of Niebuhr (2004) analyses the spatial border effects of European integration. The models are estimated with data from 1975 to 2000. She finds only moderate economic effects resulting from the reduction of trade and factor mobility barriers. López-Bazo,Vayá and Artís (2004) use a convergence equation to estimate spillovers between regions of the same country (intranational spillovers) and of different countries (international spillovers) for the period 1980-1996. They prove significant spillover effects within the countries. The between countries effects are significant only in one specification, but the coefficient is negative, which might be caused by regional competition of areas from different European Member States. A similar model is estimated by Eckey, Kosfeld and Türck (2005). The calculation of the production function confirms that there are significant intranational spillovers, but the international spillovers are too weak to be proven empirically.. 5.. Markov chains and related models. The Markov chains approach is also often used to investigate convergence processes. Markov chains are based on the calculus of probabilities of several regional developments. In particular income per capita classes are defined, and the researchers examine the probabilities that regions change their income class (Bickenbach/Bode,.
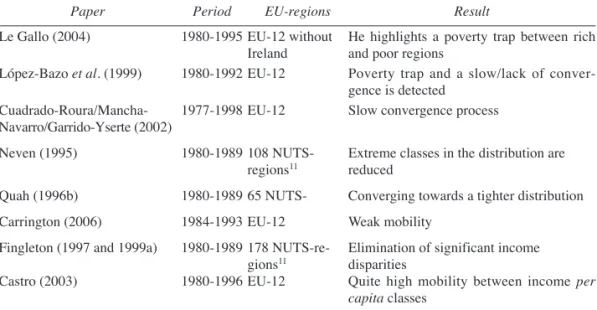
(18) 01 Eckey. 5/6/07. 22. 14:00. Página 22. Eckey, H. F. and Türck, M.. 2001, 2003). However, the assumptions are quite restrictive. The Markov chains approach is also an inductive method without strong theoretical underpinning. Another problem is that not specific regions but classes of regions with different income per capita are used (cf. Fingleton n. d. and Fingleton, 1999a). Le Gallo (2004) calculates Markov chains to study convergence among 138 European regions (cf. Table 9). He finds that GDP disparities continue to persist during the period of 1980-1995. The relative position of one region in the GDP distribution depends highly on the economic development of neighbouring regions. If one region is surrounded by richer areas, then the possibility of a declining of the GDP is much smaller than when the neighbouring districts are richer by comparison. He especially highlights a poverty trap between rich and poor regions. For poor regions there is only a small probability to achieve the GDP per capita of rich areas.. Table 9. Paper Le Gallo (2004) López-Bazo et al. (1999). Period. Results of Markov chains EU-regions. 1980-1995 EU-12 without Ireland 1980-1992 EU-12. Cuadrado-Roura/Mancha1977-1998 EU-12 Navarro/Garrido-Yserte (2002). Result He highlights a poverty trap between rich and poor regions Poverty trap and a slow/lack of convergence is detected Slow convergence process. Neven (1995). 1980-1989 108 NUTSregions11. Extreme classes in the distribution are reduced. Quah (1996b). 1980-1989 65 NUTS-. Converging towards a tighter distribution. Carrington (2006). 1984-1993 EU-12. Weak mobility. Fingleton (1997 and 1999a). 1980-1989 178 NUTS-regions11 1980-1996 EU-12. Elimination of significant income disparities Quite high mobility between income per capita classes. Castro (2003). This poverty trap is also detected by López-Bazo et al. (1999, p. 357) using the period 1980-1992 and the indicators GDP per capita and GDP per worker (labour productivity). The dynamics of changing GDP per capita classes in the upper tail of the distribution are higher, and the authors speak of «slow convergence» from rich regions, but of «a lack of convergence (…) from the group of the poorest regions» (López-Bazo et al., 1999, p. 357). The analysis of two subperiods (1980-1985 and 19851992) mainly confirms these results, although the convergence process of the regions with above-average GDP per capita occurs mainly in the early 1980s. Cuadrado11. The paper fails to mention which countries these regions are from..
(19) 01 Eckey. 5/6/07. 14:00. Página 23. Convergence of EU-Regions. A Literature Report. 23. Roura, Mancha-Navarro and Garrido-Yserte (2002) detect also a small mobility of regions between the income levels. In particular, the areas with low incomes are responsible for the fact that the convergence process decreases from the first subperiod 1977-1986 to the second subperiod 1986-1998. The study of Neven (1995) examines European convergence over the period 1980-1989 and over two subperiods (1980-1985 and 1985-1989). Using the whole dataset he finds only weak tendencies that regions will change their state in the position of output per capita. Like Le Gallo (2004) Neven (1995) also identifies a «limited poverty trap». Poor regions are likely to stay poor in the future. Regarding the two subperiods, Neven’s (1995) analysis demonstrates that extreme classes in the distribution are reduced and that the mobility between the classes increases. This result is confirmed by the study by Quah (1996b). He summarises that «regional income distribution is converging towards a tighter distribution» (Quah, 1996b, p. 955) over the period 1980-1989. Carrington (2006) also finds a quite high persistence in the income classes for the period 1984-1993, but the mobility pattern has changed over time. Whereas the mobility was highest in the low income classes in the 1980s, at the end of the examined period most regions switch from the second to the first class at the right tight of the distribution. That «indicates a move away from it toward the upper end of the distribution» (Carrington, 2006, p. 70). Fingleton (1997 and 1999a) uses four income per capita classes to examine European convergence for the period 1975-1995 with Markov chains. The regions achieve their stochastic equilibrium after an equally long period. The differences in regional income will diminish, especially the poor regions with an income per capita below 75% of the average level. In contrast to Le Gallo (2004) and López-Bazo et al. (1999) Castro (2003) finds a quite high mobility between seven income per capita classes. 41% of European regions have moved from one state to another over the period 1980-1996. Most regions which change their group move to a contiguous one. Castro (2003) also examines the mobility over time, and he figures out that the degree of mobility has fallen. Magrini (2004, p. 2766) has shown that a kernel approach has a lot in common with Markov chains (cf. also Quah, 1996a and 1997). Kernel density functions can also be used to examine regional convergence. Quah (1996b) estimates kernel functions for the periods 1980-1982, 1983-1985, 1986-1988 and 1989. The standard deviation of the functions falls over time, which is a subtle indication for convergence. In the paper of Magrini (1999) a kernel approach is estimated for 1979 and 1990. The diagram of the functions shows that «the distribution has converged towards middle income class» (Magrini, 1999, p. 268). Castro (2003) uses this approach for the period 1980-1996. The visual impression and the calculation of the standard deviation of the density function also support the convergence hypothesis. Another result is reached by a study of Magrini (2004). He analyses the transition dynamics of 110 European NUTS-regions over the 1980-1995 period. He finds only weak tendencies towards convergence. The same finding is conducted by Fingleton and López-Bazo (2003) for the manufacturing sector and the period 19751995..
(20) 01 Eckey. 5/6/07. 24. 6.. 14:00. Página 24. Eckey, H. F. and Türck, M.. Conclusions. Researchers use different methods to examine European convergence. A problem specific to this issue is that regional growth is a complex process, which displays instabilities and cyclical fluctuations (Quah, 1992, p. 50). Another problem concerns the availability of data, especially from the enlarged European Union. Most time series in the data bases of EUROSTAT beginning with 1995, and sometimes this data is not comparable with the data of Cambridge Econometrics data base. Due to data restriction the question of European regional convergence including the New Member States from Central and Eastern Europe is limited to a time span of less than nine years at the moment. With an extension of the database the explanatory power of the models can be improved. Besides the time span the delineation of regions also has an impact on the results. Most studies refer to NUTS-2 regions, which are administrative units of the European Commission and EUROSTAT. Several researchers have pointed out that these regions are neither internally homogenous nor uniformly large. They are the result of historical factors of the countries and have no relationship to socio-economic variables (cf. Cheshire/Carbonaro 1995 and 1996 Corroda/Martin/Weeks 2005, p. C137, Magrini, 2004; Martin, 2001, p. 64; Stirböck, 2002, p. 7 and Boldrin/Canova, 2001, p. 212). A regression analysis with administrative units can provoke spatial autocorrelation (s. Keilbach, 2000, p. 120; Fingleton, 1999b, p. 12). However, because the official data is provided for NUTS-regions by the official statistics, this problem cannot be solved in the near future. The σ-convergence and the Markov chains calculation have no strong theoretical underpin. Rather, they are descriptive methods. A special problem of σ-convergence is spatial autocorrelation, which is recently stressed in an essay of Rey and Dev (2006) and not considered in most papers. Spatial autocorrelation may lead to misleading interpretations of the convergence process. Many researchers use the neoclassical approaches of ß-convergence, which is sometimes augmented with spillover effects. There are two main theoretical approaches, which suggest a spatial dependency of neighbouring regions. Jacobs (1969) assumes that an agglomeration and spatial proximity have a positive impact of the development and the exchange of knowledge and new ideas. In his considerations the spillover effects between different economic sectors are of particular importance. The cooperation between economic actors of different sectors, for example financing services from a bank, research activities from a Research and Development enterprise and the equipment of a factory, lead to the development and diffusion of innovations. These urbanisation effects are also termed Jacobs externalities. Beside this approach of urbanisation Marshall, Arrow and Romer (Marshall, 1920; Arrow, 1962; Romer, 1986) have introduced the concept of localisation or MAR externalities. These MAR effects arise from contacts, spying and other forms of knowledge transmission from firms of the same sector in agglomerated areas (Henderson, 2003). The inclusion of spillover effects of human capital and knowledge might be contrary to the constant returns to scale assumption of the neoclassic. The nonrival cha-.
(21) 01 Eckey. 5/6/07. 14:00. Página 25. Convergence of EU-Regions. A Literature Report. 25. racter of knowledge between neighbouring areas leads to an increase of the regional production but not to higher costs. Therefore, Romer (1986), Lucas (1988) and others have constructed growth models (endogenous growth theory), which have increasing returns to scale because of these spillover effects. With the consideration of externalities in neoclassical models the boundary to the endogenous growth theory is passed. The new endogenous growth theory and the new economic geography (NEG) are built on equations which could provide new insights of convergence and perhaps lead to a higher determination of growth regressions. It should be noted that a statement of Armstrong (2002) is still relevant: «A number of key models are formalised and it is up to the proponents of the others to develop the appropriate methods and assemble convincing evidence that they are fit to replace models such as the conditional convergence model» (2002, p. 255). Our literature report shows that most studies find a significant, but rather small convergence rate of European regions. Only a few studies detect an insignificant convergence process. In this case the convergence process is too slow to be proven empirically. In addition, the regions seem to have different initial conditions, which do not differ to a greater extent. This interpretation follows from the significance of the absolute and conditional ß-convergence models (cf. situation b in Table 10). Expenditures on European cohesion can be efficient because there are only weak tendencies towards different growth paths. In addition, we detect indications of convergence clubs. These are regions in the same area, which have similar initial conditions as well as speeds of convergence.. Table 10.. Empirical results and implied policy measures. Empirical result a) Absolute convergence but no conditional convergence. Situation. Implied regional policy. All regions converge to the same No reason for a regional cohesion steady state policy. b) Absolute convergence and con- Regions converge to different ste- Funding of peripheral regions with ditional convergence ady states, which do not strongly equilibrium values below average deviate from each other c) No absolute convergence, but Regions converge to different conditional convergence equilibriums. Underdeveloped regions must receive funding. d) No absolute and conditional convergence. Only a great funding may diminish the different economic conditions. Regions do not converge. The significant regression coefficient of human capital in most regression models with removed spatial autocorrelation confirms the hypothesis that highly qualified employees have a great influence on regional growth. Therefore, a successful cohesion policy in underdeveloped areas should operate in two directions to support underdeveloped regions:.
(22) 01 Eckey. 5/6/07. 14:00. Página 26. 26 Eckey, H. F. and Türck, M.. • On the one hand measures for the enterprises are needed in order to stimulate further investments by infrastructure projects, the support of the development of sectoral cluster and start-ups etc. • On the other hand the qualification (for example university education, advanced vocational training) and the mobility of human capital must be encouraged. For that reason the cohesion funding should be focused on human capital and innovative activities in «problem clusters». This might reveal high growth impulses and diminish the gap of the growth paths in the long run. It should be noted that the efficiency of an innovation-oriented policy is not determined by the degree of centrality. An investigation of Fritsch (2003) proves innovative activities in less agglomerated areas. But these measures are limited to a critical geographic area due to the fact of knowledge transmission. Empirical studies show that personal contacts are important for exchanging tacit knowledge (Bretschger, 1999, p. 252). However, some detected convergence clusters may exceed this critical distance, because the average distance between patent collaborators lies around 210 kilometres (Johnson/Siripong/Brown, 2006). The implementation of cohesion policies must also consider national effects. Most studies find different growth paths of the Member States. The reduction of these disparities is an important aim of the European integration. There are three factors that complicate the abolishment of these inequalities: • Member States still have competences in main fields of policies (Vrousalis, 2006). • Substantial differences between the legal systems and institutions of Member States still exist (Deakin, 2006). This issue impedes investments of firms and migration of employees between Member States. • Some barriers between the countries caused by different languages and cultures will persist in future. Significant linguistic barriers in the EU are confirmed for example in three of four models by Nitsch (2000, p. 1098).. 7.. References. Abreu, M., de Groot, H.L.F. and Florax, R.J.G.M. (2005a): «Space and Growth: A Survey of Empirical Evidence and Methods», Région et Développement, 11, 14-38. Abreu, M., de Groot, H.L.F. and Florax, R.J.G.M. (2005b): «A Meta-Analysis of Beta-Convergence The Legendary 2%», Journal of Economic Surveys, 19, 389-420. Aiginger, K. and Falk, M. (2005): «Explaining Differences in Economic Growth among OECD Countries», Empirica, 32, 19-43. Anselin, L. (1988): Spatial Econometrics. Methods and Models, Dordrecht, Boston, London: Kluwer Academic Publisher. Anselin, L. (1995): «Local Indicators of Spatial Association-LISA», Geographical Analysis, 27, 93-115. Anselin, L. (1996): «The Moran Scatterplot as an ESDA Tool to Assess Local Instability in Spatial Association», in: Fischer M., Scholten, H. and Unwin, D. (eds.) Spatial Analytical Perspectives on GIS, London: Taylor & Francis, 111-125. Anselin, L. and Bera, A.K. (1998): «Spatial Dependence in Linear Regression Models with an Introduction to Spatial Econometrics», in: Ullah, A. and Giles, D.E.A. (eds.) Handbook of Applied Economic Statistics, New York et al., Dekker, 237-289..
(23) 01 Eckey. 5/6/07. 14:00. Página 27. Convergence of EU-Regions. A Literature Report. 27. Armstrong, H.W. (1995): «Convergence among Regions of the European Union 1950-1990», Papers in Regional Science, 74, 143-152. Armstrong, H.W. (2002): «European Union Regional Policy. Reconcilung the Convergence», in: Cuadrado-Roura, J.R. and Parellada, M. (eds.) Regional Convergence in the European Union, Berlin et al., Springer, 231-272. Arrow, K.J. (1962): «The Economic Implications of Learning by Doing», Review of Economic Studies, 29, 155-173. Badinger, H., Müller, W.G. and Tondl, G. (2004): «Regional Convergence in the European Union 19851999. A Spatial Dynamic Panel Analysis», Regional Studies, 38, 241-253. Bähr, C. (2006): How does sub-national autonomy affect the effectiveness of Structural Funds? http://www.ersa.org/ersaconfs/ersa06/papers/470.pdf (2007/01/25). Barrios, S. and Strobl, E. (2005): «The Dynamics of Regional Inequalities», Economic Papers of the European Commission, 229, Brussels. Barro, R.J. and Sala-i-Martin, X. (1990): «Economic Growth and Convergence across the United States», Working Paper Series of the National Bureau of Economic Research, 3419, New York. Barro, R.J. and Sala-i-Martin, X. (1991): «Convergence across States and Regions», Brookings Papers on Economic Activity, 1, 107-182. Barro, R.J. and Sala-i-Martin, X. (1992): «Convergence», Journal of Political Economy, 100, 223-251. Barro, R.J. and Sala-i-Martin, X. (2004): Economic Growth, 2nd ed., Cambridge: MIT Press. Basile, R., Nardis, S. de and Girardi, A. (2005): Regional Inequalities and Cohesion Policies in the European Union. http://www.camecon.com/services/europe/Downloadable%20files/isae%20paper.PDF (2006/01/06). Baumont, B., Ertur, C. and Le Gallo, J. (2003): «Spatial Convergence Clubs and the European Regional Growth Process, 1980-1995», in: Fingleton, B. (ed.) European Regional Growth, Berlin et al., Springer, 131-158. Bickenbach, F. and Bode, E. (2001): «Markov or Not Markov. This Should Be a Question», Kiel Working Paper, 1086, Kiel. Bickenbach, F. and Bode, E. (2003): «Evaluating the Markov Property in Studies of Economic Convergence», International Regional Science Review, 26, 363-392. Bivand, R. and Brunstad, R. (2003): «Regional Growth in Western Europe. An Empirical Exploration of Interactions with Agriculture and Agricultural Policy», in: Fingleton, B. (ed.) European Regional Growth, Berlin et al., Springer, 351-373. Bivand, R. and Brunstad R. (2005): Further Explorations of Interactions between Agricultural Policy and Regional Growth in Western Europe. Approaches to Nonstationarity in Spatial Econometrics. http://www.uni-kiel.de/ifw/konfer/spatial/ bivand_brunstadt.pdf (2005/08/01). Boldrin, L. and Canova, F. (2001): «Inequality and Convergence in Europe’s Regions. Reconsidering European Regional Policies», Economic Policy, 16, 207-253. Bond, S.R., Hoeffler, A. and Temple, J. (2001): «GMM Estimation of Empirical Growth Models», CEPR Discussion Papers, 3048, London. Bornschier, V., Herkenrath, M. and Ziltener, P. (2004): «Political and Economic Logic of Western European Integration», European Societies, 6, 71-96. Bräuninger, M. and Niebuhr, A. (2005): «Agglomeration, Spatial Interaction and Convergence in the EU», HWWA Discussion Paper, 322, Hamburg. Bretschger L. (1999): «Knowledge Diffusion and the Development of Regions», Annals of Regional Science, 33, 251-268. Brunsdon, C., Fotheringham, A.S. and Charlton, M.E. (1998): «Spatial Nonstationarity and Autoregressive Models», Environment and Planning A, 30, 957-973. Busch, B. (2004): EU-Kohäsionspolitik, Entwicklung, Bestandsaufnahme und Reformvorschläge, Köln: Dt. Institutsverlag. Canova, F. (2004): «Testing for Convergence Clubs in Income per Capita. A Predictive Density Approach», International Economic Review, 45, 49-78. Cappelen, A. et al. (2003a): «The Impact of EU Regional Support on Growth and Convergence in the European Union», Journal of Common Market Studies, 41, 621-644..
Figure
+5
Documento similar
In the preparation of this report, the Venice Commission has relied on the comments of its rapporteurs; its recently adopted Report on Respect for Democracy, Human Rights and the Rule
Summing up, low population density (in interior regions) and excessive economic polarization in rural society (in southern regions) acted as obstacles for the industrialization of
This study investigates the relationship among Subjective Well-Being, education, income and social relations in a panel of 19 Italian regions and two independent provinces, with
The table shows the relationship between pre-stimulus α-band level and change in detection rate (R and uncorrected p-value) for each of the two regions of interest (ROIs) exhibiting
Penelitian ini bertujuan untuk mendapatkan asal daerah bahan baku yang terbaik untuk pembuatan sirup gula kelapa dan untuk mendapatkan konsentrasi arang aktif yang
Modeling and Computation, Handbook of Statistics 25 (Dey, D. Intrinsic credible regions: An objective Bayesian approach to interval estimation. The case for objective Bayesian
Since all free critical points c ξ are symmetric and, by Lemma 6.2, have symmetric orbits, to find all possible stable dynamics of the maps O n,α (z) other than the
By distinguishing between the quality and quantity of access to information and communication technologies, together with institutional and geographical factors, and using a sample
