A holistic methodology cum database for
wave energy exploitation: Implementation
on the Galician coast (NW Spain)
Rodrigo Carballo Sánchez
Supervisors:
Prof. Gregorio Iglesias Rodríguez
Prof. José Ángel Fraguela Formoso
Tutor:
Prof. José Ángel Fraguela Formoso
DO*MAR Marine Science, Technology and Management
A holistic methodology cum database for
wave energy exploitation: Implementation
on the Galician coast (NW Spain)
A thesis submitted to the Universidade da Coruña in partial fulfilment of the requirements for the degree of
Doctor of Philosophy and the International Mention
A Coruña, September 2016
____________ Rodrigo Carballo Sánchez Author
APPROVED
____________ Prof. Gregorio Iglesias Rodríguez Supervisor
PhD thesis
A holistic methodology
cum
database for
wave energy exploitation: Implementation
on the Galician coast (NW Spain)
Author:
Rodrigo Carballo Sánchez
Supervisors: Prof. Gregorio Iglesias Rodríguez
Prof. José Ángel Fraguela Formoso
Committee
President
Secretary
Acknowledgements
First, I would like to express my most sincere gratitude to my supervisors, Prof. Gregorio Iglesias and Prof. José Ángel Fraguela. Their involvement in this thesis goes far beyond mere guidance or advice; their invaluable support and great patience represent the key not only to the success of this work but also growing as a scientist and, more importantly, as a person.
My special thanks to the co-authors of the publications constituting the lion’s share of this thesis, in particular to Prof. Francisco Taveira, Mr. Marcos Sánchez, and Dr. Víctor Ramos whose knowledge in the assessment of the wave energy resource was invaluable for the successful development of this piece of research. Thanks also to Mr. Néstor Areán whose expertise in computer systems and networking contributed to the user-friendly dissemination of the thesis results, and to Richard Lambert and Iván López who helped to improve the wording and style of this thesis.
My gratitude to Dr. Simon P. Neill, Dr. Matthew Lewis, Prof. Francisco Taveira and Dr. Paulo Rosa for their kindness, valuable advice and much help during my research stays at Bangor and Porto.
My appreciation to all my colleagues, but essentially friends, Alberte Castro, Ángela Vázquez, Carlos Pérez, Mario López, Miguel Álvarez, Miguel Veigas, Iago Fonteboa, Paula Pérez and Sharay Astariz, with whom I shared not only the day-to-day work, but also endless hours of amusement and entertainment.
Abstract
The exploitation of the wave energy resource in a coastal region is based on the definition of two main aspects: the wave energy converter (WEC) and the location to install a wave farm. This decision making should be conducted on the basis of an accurate analysis of different factors, amongst which the power performance is fundamental. With this in view, in this thesis a holistic methodology far from the conventional approach is developed whose implementation in a coastal region produces a database containing the required information for accurately computing the power performance of any WEC at any coastal location. The methodology cum
database is implemented on the Galician coast and a computer application developed so as to easily access and manipulate the large amount of information generated. As a result, the new decision-aid tool iWEDGE (intra-annual Wave Energy Diagram GEnerator) is available for the Galician coast, allowing the automatic reconstruction of annual and monthly high resolution characterization matrices at any coastal location, thereby providing the elements for a combined WEC-site selection.
Keywords: Methodology; Database; iWEDGE; Power performance;
Resumen
El aprovechamiento de la energía del oleaje en una región costera se basa en la definición de dos aspectos principales: el dispositivo convertidor de energía de las olas (WEC, wave energy converter) y la localización para instalar una planta de aprovechamiento undimotriz. Esta toma de decisiones debe ser realizada en base a un análisis de detalle de diferentes factores, entre los cuales el rendimiento energético es fundamental. Teniendo esto en consideración, en esta tesis se desarrolla una metodología holística que difiere en gran medida de los procedimientos convencionales, cuya implementación en una zona costera genera una base de datos que contiene la información necesaria para realizar estimaciones precisas del rendimiento de cualquier WEC en cualquier ubicación costera. La metodología cum base de datos se implementa en la costa gallega y se desarrolla una aplicación informática para acceder y manipular de modo sencillo la extensa información generada. Como resultado, la nueva herramienta de toma de decisiones
iWEDGE (intra-anual Wave Energy Diagram GEnerator) está disponible para la
costa gallega, la cual permite la reconstrucción automática de matrices de caracterización anual y mensual de alta resolución en cualquier localización costera, y por tanto proporciona los elementos para una selección combinada WEC-ubicación.
Resumo
O aproveitamento da enerxía da ondada nunha rexión costeira baséase na definición de dous aspectos principais: o dispositivo convertedor de enerxía das ondas (WEC, wave energy converter) e a localización para instalar unha planta de aproveitamento undimotriz. Esta toma de decisións deber ser realizada en base a unha análise de detalle de diferentes factores, entre os cales o rendemento enerxético é fundamental. Tendo isto en consideración, nesta tese desenvólvese unha metodoloxía holística que difire en gran medida dos procedementos convencionais, que ó ser aplicada nunha determinada rexión xera unha base de datos que contén a información necesaria para realizar estimacións precisas do rendemento de calquera WEC en calquera localización costeira. A metodoloxía cum base de datos aplícase na costa galega e desenvólvese unha aplicación informática para acceder e manipular de modo sinxelo a extensa información xerada. Como resultado, a nova ferramenta de toma de decisións iWEDGE (intraanual Wave Energy Diagram GEnerator) está dispoñible para a costa galega, a cal permite a reconstrución automática de matrices de caracterización anual e mensual de alta resolución en calquera localización costeira, e por tanto proporciona os elementos para unha selección combinada WEC-ubicación.
Preface
The exploitation of the wave energy resource in a coastal region is based on the combined selection of the most appropriate location and wave energy converter (WEC) for installing a wave farm. In this context, a large number of resource characterizations have been conducted over recent years. The greater part of these evaluations was focused on determining extreme and average wave conditions, along with characterizing in detail hot spots of interest. Despite all their interest, the resulting information does not provide the required elements for a combined WEC-site selection. For this purpose, it is necessary to bear in mind the final outcome of a wave energy resource assessment: to provide the elements for the reliable estimation of the performance of WECs at different locations of interest, based on which, an appropriate decision making can be performed.
In this thesis, a high resolution geospatial database covering the whole length of the Galician coast (NW Spain) is made available by defining and implementing a holistic methodology which is based on deepwater buoy data and spectral numerical modelling. Then, a MATLAB-based decision-aid tool is developed allowing the manipulation of the information generated and the automatic reconstruction of annual and intra-annual high resolution wave energy characterization matrices at any location within the Galician coast, or in other words, the required information for computing the power performance of any WEC-site combination of interest.
This thesis is structured in seven chapters as follows. First, Chapter I –
Introduction provides an overall perspective of this work. Then, in Chapter II –
Objectives, the final and intermediate objectives are presented. The three following chapters (Chapters III to V) correspond to original research articles published in peer-reviewed journals constituting the main body of this work. In Chapter VI –
(Chapters III to V) is performed. Finally, in Chapter VII – Conclusions, the main contributions and findings, along with the planned future research, are presented.
This work has been conducted in the framework of the grant Development of a Geospatial Database for the Exploitation of the Wave Energy Resource along the Galician Coast funded by the Barrié Foundation, the project DPI2009-14546-C02-02 Assessment of the Renewable Energy Resources of the Ministry of Science and Innovation and the project Online Application and High Resolution Management System for the Exploitation of the Wave Energy Resource in the Atlantic Region of
Europe supported by Iberdrola Foundation. The wave data have been kindly
Contents
Index of figures and tables ... xi
Symbols and abbreviations ... xiv
I Introduction ... 1
1. Motivation and scope of the thesis ... 2
2. Justification of the unity and coherence of the thesis ... 4
II Objectives ... 7
III A high resolution geospatial database for wave energy exploitation ... 10
Abstract ... 11
1. Introduction ... 11
2. Database development ... 12
2.1. Characterization of the deepwater wave energy resource ... 12
2.2. Selection and propagation of the relevant wave energy cases ... 14
2.3. Wave energy resource at a particular location ... 16
2.4. A Matlab-based toolbox for characterization matrix generation ... 17
3. Case study ... 18
4. Conclusions ... 20
Acknowledgements ... 21
List of Symbols ... 22
IV Intra-annual wave resource characterization for energy
exploitation: A new decision-aid tool ... 23
Abstract ... 24
1. Introduction ... 24
2. Deep water energy bin characterization ... 25
3. Coastal resource characterization and data storage: iWEDGE ... 26
4. iWEDGE application ... 28
5. Conclusions ... 30
Acknowledgements ... 30
References ... 30
V The intra-annual variability in the performance of wave energy converters: A comparative study in N Galicia (Spain) ... 32
Abstract ... 33
1. Introduction ... 33
2. Deepwater resource analysis ... 34
2.1. Site selection ... 34
2.2. Wave data ... 34
2.3. Selection of wave conditions ... 35
3. Coastal resource characterization ... 35
3.1. Coastal modelling ... 35
3.2. Wave resource reconstruction ... 35
4. Monthly power performance computations ... 38
5. Conclusions ... 38
Acknowledgements ... 40
References ... 40
VI General discussion ... 42
1. Wave resource characterization for WEC performance computations ... 43
2. Methodology cum database implementation on the Galician coast ... 45
VII Conclusions ... 50
References ... 53
Index of figures and tables
Figures
Chapter III
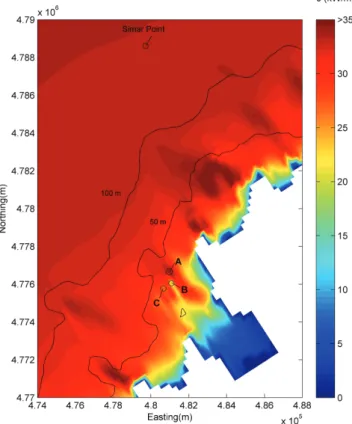
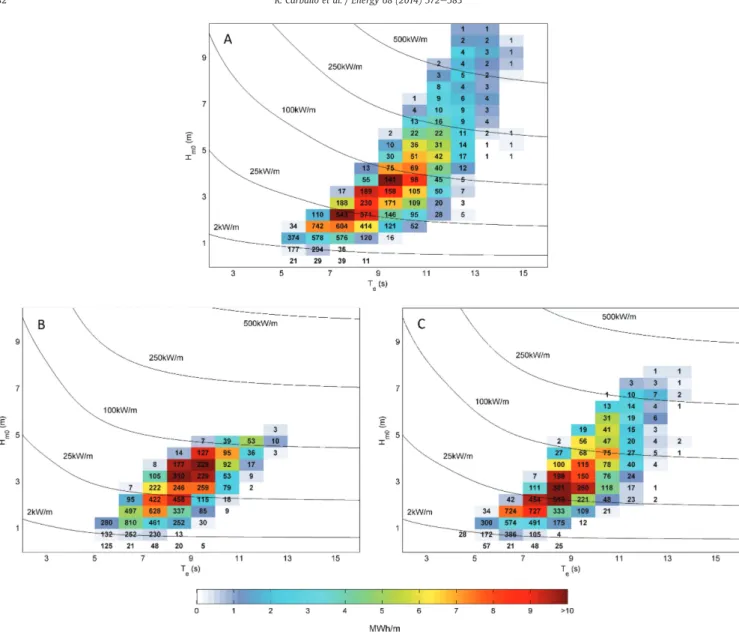
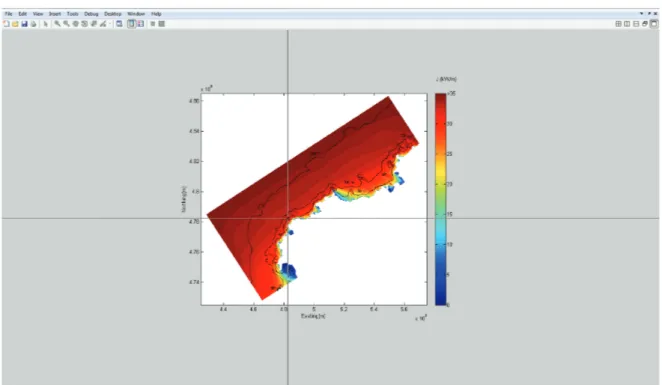
Figure 10. Average wave power [kW/m] throughout the Death Coast. The rectangle indicates the coastal zone within which the variations in the wave energy resource are analysed (Fig.11) ... 19 Figure 11. Average wave power map of the coastal zone marked in Fig. 10 with the locations (A, B, C and SIMAR) at which the characterization matrices are reconstructed ... 20 Figure 12. Characterization matrix at the SIMAR point closest to the proposed area for a wave farm. The colour plot indicates the energy available, and the numbers the occurrence in hours in an average year corresponding to each energy bin ... 20 Figure 13. Characterization matrices of the wave resource at points A, B, C within the proposed area for a wave farm. The colour plot indicates the energy available, and the numbers the occurrence in hours in an average year corresponding to each energy bin ... 21
Chapter IV
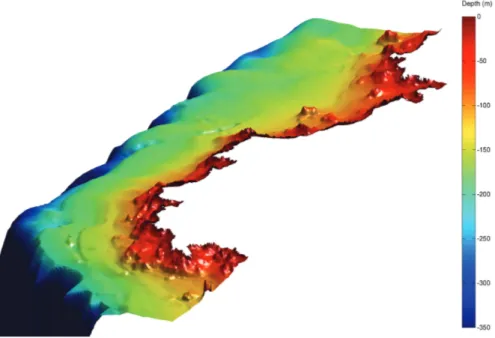
Figure 1. General view of the Iberian Peninsula (left) and detailed of the NW coast (right) within which the Death Coast is located (square) ... 25 Figure 2. January and July characterization matrices at the deep water buoy location ... 26 Figure 3. View of the 3D bathymetry interpolated to the numerical grid ... 27 Figure 4. Power matrix (in kW) of SSG technology ... 27 Figure 5. Monthly characterization matrices of winter season (October-March) ... 28 Figure 6. Monthly characterization matrices of summer season (April-September) ... 29 Figure 7. Monthly distribution of the available energy ... 29
Chapter V
Figure 3. Three-dimensional representation of the bathymetry configuration in the region ... 35 Figure 4. Omnidirectional monthly characterisation matrices of the resource at the nearshore location (resolution 0.5 m × 0.5 s) (For simplicity, only one in two months are shown) ... 36 Figure 5. Omnidirectional monthly characterisation matrices of the resource at the offshore location (resolution 0.5 m × 0.5 s) (For simplicity, only one in two months are shown ... 37 Figure 6. Power matrices of Pelamis (above) (resolution 0.5 m × 0.5 s), and Oyster technologies (below) (resolution 0.5 m × 1 s) showing the efficiency (in terms of power output [kW]) for the different wave height and period combinations ... 39 Figure 7. Power performance at the nearshore location in terms of energy production, Eo, (above) and capacity factor, Cf, (below) for Pelamis, Oyster
and B-HBA technologies ... 39 Figure 8. Power performance at the offshore location in terms of energy production, Eo, (above) and capacity factor, Cf, (below) for Pelamis, AWS
and Aqua Buoy technologies ... 40
Tables
Chapter III
Table 1. Power matrix of a WEC in terms of power output (kW) ... 13 Table 2. Power matrix of a WEC in terms of efficiency (%) ... 14 Table 3. Sensitivity analysis (percentage of the total annual energy, % Energy, and percentage of the total annual time, % Time) ... 15
Chapter V
Symbols and abbreviations
Symbols
C phase velocity [ms-1] Cf capacity factor Cg group velocity [ms-1]
Cθ propagation velocity in θ-space [ms-1]
Cσ propagation velocity in σ-space [ms-1] Eb energy provided by each bin [MWhm-1] Eo monthly energy output [Whm-1]
H1/3 significant wave height [m]
Hm0 spectralsignificant wave height [m] f wave frequency [Hz]
fp peak wave frequency [Hz]
g gravitational acceleration [ms-2]
h local water depth [m]
J wave power per unit width [kWm-1]
Jb wave power per unit width of each bin [kWm-1]
k wave number [m-1]
mn n-th spectral moment [m2Hz-n]
n number of hours of a period considered [h]
N wave action density [m2Hz-2] Ob occurrence of each each bin [h]
Pb power output of a WEC for each energy bin[kW]
S spectral density [m2Hz-1]
t time [s]
Te energy period [s] Tp peak period [s]
β spectrum wave parameter γ peak enhancement factor
π pi
ρ seawater density [kgm-3] σ relative frequency [Hz] θ wave direction [º]
θm mean wave direction [º]
ζ width of the spectral peak region
Abbreviations
AWS Archimedes Wave Swing GUI graphical user interface
IF impact factor
iWEDGE intra-annual Wave Energy Diagram GEnerator OTD overtopping device
OWC oscillating water column SWAN Simulating WAves Nearshore WAB wave activated body
WEC wave energy converter
I
Introduction
1.
Motivation and scope of the thesis
Wave energy has emerged as one of the most powerful renewables with the potential to replace part of the energy fossil fuel generation (Bahaj, 2012). For this potential to be realized, it is necessary to develop efficient and reliable wave energy converters (WECs). As a result of the intensive research conducted over recent years to develop WECs (Babarit et al., 2012; Falcão, 2010), the exploitation of this form of energy is approaching commercial viability.
a given location, and (ii) to define the location within a coastal region or area allowing the greatest performance for a given technology.
The assessment of the power performance of a wave energy converter at a coastal site involves two tasks: (i) the characterization of the wave resource at the location in question, and (ii) the computation of the energy production and, on this basis, other performance parameters of interest. Unfortunately, these tasks are generally seen as disconnected and tackled as such; they are, however, deeply interrelated —so much so that they should be treated as two phases of the same procedure—. As a consequence, the way in which the greater part of the assessments have been conducted over recent years gives rise to a lack of the elements required for properly conducting this estimation.
The aforementioned limitation arises from the power performance of WECs largely depending on the characteristics of the wave climate at a specific location which stems from their efficiency —either expressed in terms of power output or percentage over the total energy available, as described by their power matrix— significantly varying with the wave conditions. Therefore, if accurate performance computations are to be conducted, the resource at a particular location of interest needs to be described by means of a characterization matrix (or energy diagram), examining the available energy and occurrence for the different wave conditions, expressed as joint combinations of the relevant spectral parameters, or the so-called energy bins. Then, the energy production of a given WEC at a site of interest would be the result of combining the device’s power matrix with the location’s characterization matrix. For this purpose, the characterization matrices should be computed following a specific procedure (Carballo and Iglesias, 2012; Henriques et al., 2013) differing from the conventional one, designed to cover a significant percentage of the total energy resource available and to obtain a specific level of resolution of the energy bins (the same as that of the device’s power matrix). On top of that, the wave energy resource may largely vary within short distances throughout a specific coastal region (e.g., Iglesias and Carballo, 2009b), meaning that the WEC providing the greatest performance is likely to vary depending on the location within the coastal area considered. In consequence, any resource assessment with a view to installing a wave farm in a coastal region should allow the accurate computation of the resource characterization matrix at any site of interest within the region, and thus the estimation of the performance of any WEC-site combination.
to compute the performance of a WEC at a coastal site exhibiting significant intra-annual energy variability on the basis of mere intra-annual figures may conduct to ill-informed decision making. Instead, intra-annual matrices of the resource should be computed covering a temporal period (e.g., monthly, seasonal…) reflecting the variability of the resource. However, as stated, conventional resource assessments usually focus on average (or extreme) values, thereby providing little information regarding the intra-annual distribution of the resource. This results in the required information for generating intra-annual characterization matrices being currently only available at a limited number of coastal sites, usually those where a buoy has been in operation over large periods.
In this thesis, a geospatial database for the exploitation of the wave energy resource over the whole length of the Galician coast (NW Spain) is made available by developing and implementing a holistic methodology, based on deepwater buoy data and high resolution spectral numerical modelling, allowing the consideration of virtually the totality of the available resource. Then, a MATLAB-based decision-aid tool is developed so as to easy access and manipulate the database generated, allowing the automatic reconstruction of annual and intra-annual high resolution characterization matrices of the wave energy resource at any site within the Galician coast, and therefore the computation of the power performance of any WEC-site combination.
The methodology cum database herein presented is developed through a series of research articles, published in peer-reviewed journals, composing the main body of this thesis, each of them constituting a fundamental step towards the achievement of the final objective of this work: to make available a feasible and reliable procedure whose implementation in a given coastal region provides the required information for proper wave energy exploitation decision making.
2.
Justification of the unity and coherence of the
thesis
This thesis is structured in seven chapters as follows. First, the present Chapter (I – Introduction) provides an overall perspective of this work. Then, in Chapter II –
integration forms a whole through which a holistic methodology cum database for wave energy exploitation is developed. For this purpose, each of the publications deals with one of the three intermediate objectives as stated in Chapter II.
In Chapter III – A high resolution geospatial database for wave energy exploitation, a comprehensive methodology far from the conventional approach is presented so as to characterize the wave resource with the adequate resolution and accuracy in order to provide the elements for accurate performance computations of WECs. The implementation of this methodology is shown through a case study covering the whole Death Coast (Galicia, NW Spain). Then, a brand new MATLAB-based tool called WEDGE (Wave Energy Diagram GEnerator) is developed to easily access to the resulting database and automatically compute annual wave characterization matrices with the required resolution for performance computations purposes at any site throughout the Death Coast. Then, the interest of this methodology cum database is investigated, in particular with respect to the spatial resolution provided. This chapter has been published in Energy in 2014, journal indexed in the Journal Citation Reports with an impact factor, IF, of 4.844 (year 2014).
In Chapter IV – Intra-annual wave resource characterization for energy exploitation: A new decision-aid tool, the methodology cum database previously developed is extended in order to consider the intra-annual variations of the resource, and implemented in the same region, the Death Coast. In the same way, the MATLAB-based tool is also extended so as to allow the automatic computation of intra-annual characterization matrices. This new decision-aid tool is called
iWEDGE (intra-annual Wave Energy Diagram Generator). Afterwards, the need for considering the intra-annual variations for a proper characterization of the resource in this region is further analysed. This chapter has been published in
Energy Conversion and Management in 2015, journal indexed in the Journal
Citation Reports with an IF of 4.801 (year 2015).
In Chapter V – The intra-annual variability in the performance of wave energy
converters: A comparative study in N Galicia (Spain), the aforementioned
methodology cum database considering the intra-annual variations of the resource is implemented in the northern coastal region of Galicia. Next, the importance of considering the intra-annual variations for reliable performance computations of different WEC-site combinations is further investigated. This chapter has also been published in Energy in 2015 (IF=4.292, year 2015).
achievement of the final objective— and therefore providing coherence and unity to this thesis.
II
Objectives
The final objective of the present thesis consists in developing a comprehensive methodology allowing the generation of a database for accurately computing the performance of any WEC-site combination in a coastal region, and implementing it on the Galician coast, thereby providing the required information for proper wave energy decision making throughout this region. For attaining this final objective, the following intermediate objectives —each of them corresponding to a publication in a peer-reviewed journal which constitute the main body of this work— are established:
(i). To develop and implement in a coastal region of interest a methodology allowing the reliable computation of the annual performance of any WEC-site combination within the region.
Tasks involved: to develop a methodology whose implementation in a coastal region provides the required information for reconstructing the resource in the form of a high resolution annual characterization matrix at any location; to implement the methodology in a coastal region of interest in Galicia; to develop a computer application for easily accessing and manipulating the information generated; to analyse through a case study the need of the spatial resolution level provided.
(ii). To extend the methodology defined in (i) so as to consider the intra-annual variations of the wave energy resource, and implement it to the same coastal region.
through a case study the need for analysing the resource in terms of intra-annual characterization matrices.
(iii). To implement the methodology presented in (i) and extended in (ii) to another coastal region, showing the interest and functionality of the methodology cum database developed.
III
A high resolution geospatial database
for wave energy exploitation
R. Carballo, M. Sánchez, V. Ramos, F. Taveira-Pinto and G. Iglesias
Energy 68, 572–583 (2014) Elsevier, ISSN: 0360-5442
A high resolution geospatial database for wave energy exploitation
R. Carballoa,*, M. Sáncheza, V. Ramosa, F. Taveira-Pintob, G. Iglesiasc aUniv. of Santiago de Compostela, Hydraulic Eng., Campus Univ. s/n, 27002 Lugo, Spain
bUniv. of Porto, Faculty of Engineering, Rua Dr. Roberto Frias, 4200-465 Porto, Portugal
cUniv. of Plymouth, School of Marine Science and Engineering, Marine Building, Drakes Circus, Plymouth PL4 8AA, United Kingdom
a r t i c l e i n f o
Article history:
Received 14 October 2013 Received in revised form 30 December 2013 Accepted 24 February 2014 Available online 21 March 2014
Keywords: Wave power Database Characterization matrix Energy production WEDGE
a b s t r a c t
The estimation of energy production of a given WEC (wave energy converter) at a given coastal site is the basis for correct decision-making regarding wave energy exploitation in a coastal region. Nevertheless, the procedure followed by the conventional approach to characterize the wave energy resource does not provide the required information to obtain an accurate estimate. In this work, this information is pro-vided for the region with the greatest resource in the Iberian Peninsula, the Death Coast (NW Spain). For this purpose, a geospatial database is produced by using a methodology which involves the consideration of virtually the totality of the resource together with the implementation of a high resolution spectral numerical model. In addition, a Matlab-based toolbox called WEDGE (Wave Energy Diagram GEnerator) is implemented to access the database and automatically generate high resolution energy diagrams (or characterization matrices) of the wave energy resource at any coastal location within this region. In this way, a precise computation of energy production of any WEC at any site of interest can now be per-formed. Finally, the functionality of the database is shown through a case study of a recently proposed wave farm.
Ó2014 Elsevier Ltd. All rights reserved.
1. Introduction
The need for increasing the share of renewable energies to the total energy production has resulted in a growing interest in marine energies, amongst which wave energy has a great potential[1,2]. Wave energy is approaching viability as commercial power source as a result of the intensive research conducted over recent years to develop WECs (wave energy converters)[3]. This intensive research includes waveflume tests[4], 3D tank tests[5], the implementation of numerical models[4,6]or parametric studies[7]. On the other hand, numerous assessments of the available resource were also performed with the aim of installing a wave farm. They covered areas with substantial resource such as UK[8], Spain [9,10], the Black Sea[11,12], Portugal[13,14] or US[15]. The greater part of these assessments was focused on quantifying the total available resource in a particular region, making available valuable infor-mation about the characteristics of their wave climate and of the most appropriate areas for wave energy exploitation. Nevertheless, it is necessary to bear in mind thefinal outcome that a wave energy resource assessment should provide: the elements for the estima-tion of energy producestima-tion of any WEC at any locaestima-tion of interest in a coastal region. This arises from the need for comparing the energy
production of different WECs at different locations within a coastal region and, on this basis, i) to select the WEC that performs best at each location of interest and ii) to define the location providing the largest energy production for a given technology. In consequence, the estimation of energy production is of crucial importance to determine the viability of a project. Unfortunately, the way in which most of the assessments were conducted over the last years gives rise to a lack of the elements needed to properly conduct this estimation.
The energy production of a WEC at a particular coastal location is the result of combining the power matrix of the selected WEC with the energy diagram or characterization matrix at the location, representing the available energy and occurrence for the different wave height and period combinations [16]. Within the typical procedure, followed by most of the resource assessments con-ducted, there are two factors that represent a limitation when it comes to obtaining a coastal characterization matrix[16,17]: i) the number of wave conditions considered (normally no more than a few wave cases or a mere determination of the amount of kWm1 available in an average year) and ii) the resolution of the wave energy characterization parameters. This provokes that the result-ing coastal wave energy resource information cannot be used for describing the resource in the form of a characterization matrix with the adequate level of resolution (the same as that of the power matrix of the WEC) for accurate energy production computations.
*Corresponding author. Tel.:þ34 982 285900; fax:þ34 982 285926.
E-mail address:rodrigo.carballo@usc.es(R. Carballo).
Contents lists available atScienceDirect
Energy
j o u r n a l h o me p a g e : w w w . e l s e v i e r . c o m/ l o c a t e / e n e r g y
In this work, there is developed a high resolution geospatial database of the wave energy resource throughout the most powerful coastal region in the Iberian Peninsula, the Death Coast (NW Spain) (Fig. 1) [18], following a comprehensive procedure which differs from the conventional methodology (Section2). As a result, the information required for reconstructing high resolution characterization matrices at any coastal site is now available. Furthermore, a Matlab-based toolbox is implemented, giving easy access to the information stored and allowing the automatic computation of the characterization matrices with the adequate resolution. In Section 3, the interest of the database is shown through the analysis of a recently proposed area for the installation of a wave farm in this coastal region. Finally, in Section4, the main conclusions of the present work are drawn.
2. Database development
The present database has been developed by implementing a methodology composed of different steps. Given its complexity, in Fig. 2, a completeflow chart is presented with the aim of guiding and signposting the reader through this Section.
2.1. Characterization of the deepwater wave energy resource
Thefirst step towards the assessment of the wave climate in a coastal region is to investigate its deepwater climate and, on this basis, to determine the wave conditions of interest. In the case of the Death Coast, it can be accurately characterized by the Vilán-Sisargas buoy located at approximately the middle point of the
deepwater contour (Fig. 1). The dataset cover a period of around 14 years (1998e2012), comprising a total number of near 100,000 sea states with an hourly frequency.
For this purpose, the following spectral parameters of each sea state are computed from their hourly wave spectra: spectral wave height,Hm0, energy period,Te, and mean wave direction,qm.Hm0is
the spectral estimate of the significant wave height (or the average height of the highest 1/3 of the waves of a sea state),Tethe period of
a sinusoidal wave with the same energy as the sea state, andqmthe mean direction of the waves of the sea state.
They are computed respectively as follows[19]:
Hm0 ¼4ðm0Þ
1
2; (1)
TehT10 ¼
m1
m0 ;
(2)
qm ¼ m01
Z2p
0
ZN
0
qSðf;qÞdf dq; (3)
where m1 and m0 represent respectively the minus first and
zeroth moments of the wave spectrum, andS(f,q) the spectral en-ergy density which specifies how energy is distributed as a function of frequencies (f) and directions (q). Next, the wave resource is characterized based on the probability distribution of the three aforementioned parameters (1e3) and using the concept ofenergy
bindefined as trivariate intervals of significant wave height, energy
period, and wave direction [e.g. Hm0 ¼ 2e2.5 m, Te¼ 8e8.5 s,
qm¼326.25e348.75][16].
A key aspect for a successful wave energy characterization is the selection of the adequate resolution or size of the energy bins. A concise way to present the predicted performance of a WEC is its power matrixeas the power curves in wind energy. It describes the WEC’s performance for the different joint combinations of wave height and energy period. As stated, the actual energy that a WEC would produce at a site of interest is the result of combining its power matrix with the characterization matrix of the wave energy resource at that location. At present, two different power matrices can be provided by the different device developers: in terms of power output (Table 1) and in terms of efficiency (Table 2) for the different wave conditions (or energy bins). For energy production computations, the power matrix should be combined with the occurrence or with the total energy available of each energy bin
specified by the characterization matrix depending on the infor-mation provided by the WEC developer (Table1or2, respectively). Despite that at the moment there is no information being provided by device developers regarding how wave direction affects the performance of WECs (or in other words, it is assumed that, in the case of offshore and nearshore devices, they swing with the change in the wave direction or, in the case of onshore devices, the waves approach the shore parallel to the bottom contours as a result of the refraction process), the deepwater wave direction needs to be taken into account for an accurate resource assessment, as it greatly af-fects the wave propagation process and thereby the distribution of the resource giving rise to areas of high and low energy concentration.
On these grounds, it emerges that the resolution of the energy bins of the characterization matrices at a point of interest should be at least of the same level than that of the power matrix of the
Deepwater buoy data
Spectral parameters (Hm0, Te, șm)
hourly sea states
Allocation of sea states to energy bins
Power computation Determination of Occurrence Energy of each bin Selection of energy bins
(95% total energy)
Propagation of energy bins
Spectral parameters at each grid node
(Hm0, Te, șm, J)
DATABASE WEDGE tool Characterization matrix WEC’s Power matrix Energy production
Fig. 2.Flow chart of the development of the database.
Table 1
Power matrix of a WEC in terms of power output (kW).
Hm0vsTe 5.0 6.0 7.0 8.0 9.0 10.0 11.0 12.0 13.0 14.0 15.0 16.0
1.0 10 54 124 176 188 170 144 116 94 66 44 40
1.5 48 216 474 672 716 652 548 444 356 284 228 180
2.0 106 482 1050 1460 1538 1418 1210 986 794 634 508 350
2.5 190 854 1742 2232 2340 2212 1938 1668 1376 1116 898 646
3.0 1300 2516 2940 2900 2934 2598 2272 1936 1652 1376 964
3.5 2900 3000 3000 3000 2920 2888 2506 2142 1834 1300
4.0 3000 3000 3000 3000 3000 2900 2640 2350 1730
4.5 3000 3000 3000 3000 2940 2700 2460 1906
5.0 3000 3000 3000 3000 3000 2740 2134
selected converter (they have to be combined), which means that the resolution of the deepwater characterization on which they are based should be also of the same level. Based on the information provided by the different wave energy device developers[20,21] the selected size of the energy bins are set to the highest resolu-tion of a WEC’s power matrix currently available: 0.5 m ofHm0and
0.5 s ofTe. Regards mean wave direction, in the present work
in-tervals of 22.5are used, which bring about an accurate description of the wave resource in NW Spain[16].
Once defined the resolution of the trivariate intervals, each of the hourly sea states in the dataset is assigned to the corresponding energy bin [e.g. Hm0 ¼ 3e3.5 m, Te ¼ 9e9.5 s, qm ¼ 303.75e 326.25], and their wave power per unit width, J, computed ac-cording[22],
J ¼ rg
16H
2
m0Cg; (4)
whereris the seawater density,gis the gravitational acceleration, andCgis the group velocity, or the celerity at which wave energy is
carried, which can be calculated as[23],
Cg ¼
1 2
1þsin2hkhð2khÞ
gT
2ptanhðkhÞ
(5)
wherekis the wave number andhthe local water depth. Now, the contribution to the total resource of each energy bin and its occurrence can be computed and used to produce a 3D
characterization matrix. For clarity,Fig. 3(a) shows the omnidirec-tional representation (2D) of the 3D characterization matrix, with 0.5 m intervals ofHm0and 1 s ofTe(of a maximum of 0.5 s for
clarity), with the colour plot representing the annual energy available (in MWh per meter of wave front) and the numbers, the occurrence (in hours per year) of eachHm0andTecombination.
2.2. Selection and propagation of the relevant wave energy cases
The next step in the methodology is to propagate the most representative deepwater wave cases or energy bins e those providing the bulk of the energy. Although the conventional pro-cedure is to consider a handful of study cases, recent studies have shown the importance of considering a high percentage of the total energy[16,17], which clearly will result in a more accurate estimate of the available resource and in consequence of energy production. In practice, it requires the consideration of a large number of energy bins, which means to propagate a large number of wave conditions and as a result a greater computational effort. In the present study, a sensitivity analysis (Table 3) is performed, showing the number of cases or energy bins that would be necessary to consider if a certain level of energy and time is to be achieved. It can be observed that, instead of propagating a great amount of cases so as to consider 100% of the available energy, the consideration of the 787 most energetic energy bins is enough to represent 95% of the resource (corresponding to 88.7% of the time). However, the consideration of a lower level of energy would not reduce significantly the number Table 2
Power matrix of a WEC in terms of efficiency (%).
Hm0vsTe 5.0 6.0 7.0 8.0 9.0 10.0 11.0 12.0 13.0 14.0 15.0 16.0
0.5 70.5 69.0 66.6 60.0 54.4 50.5 46.4 43.1 39.5 37.3 32.4 30.9
1.5 69.0 66.6 60.0 54.4 50.5 46.4 43.1 39.5 37.3 32.4 30.9
2.5 66.6 60.0 54.4 50.5 46.4 43.1 39.5 37.3 32.4
3.5 54.4 50.5 46.4 43.1 39.5 37.3 32.4
4.5 50.5 46.4 43.1 39.5 37.3 32.4
5.5 43.1 39.5 37.3
of cases to be propagated. The representation of the omnidirec-tional characterization matrix corresponding to 95% of energy (Fig. 3(b)) shows that the remaining 5% is mostly composed of two types of sea states: i) very low energetic sea states due to reduced wave heights and periods (sea states of under 1 m ofHm0are not
considered) and ii) very powerful sea states with very low occur-rence (extreme conditions). In both conditions, WECs do not operate; in thefirst case, they cannot operate due to the reduced wave height (Tables 1and2), and in the second case, WECs stop working to protect themselves (survival mode). This means that 95% of energy virtually represents 100% of the exploitable resource. Nevertheless, the consideration of a lower level of energy, may lead to not taking into account a large number of wave cases during which the WEC would operate. On this basis, the number of cases corresponding to 95% of energy of the total resource is retained in this work.
To propagate the selected wave conditions there is used the spectral model SWAN (Simulation WAves Nearshore)[24], which computes the evolution of the wave spectrum by solving the action
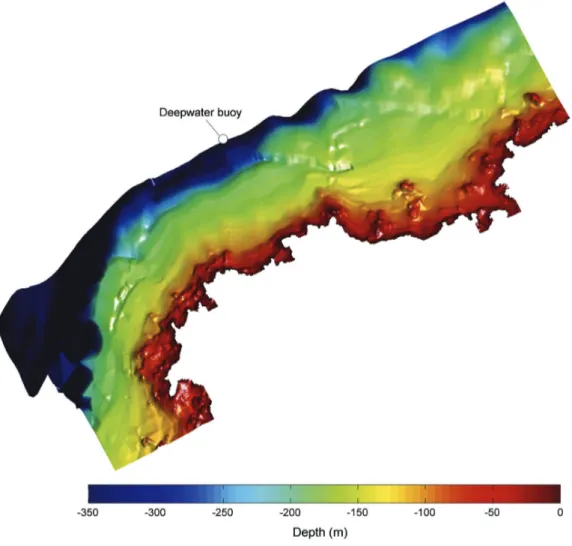
balance equation. For this purpose a high-resolution grid is con-structed (Fig. 4). The area covered by the grid is determined ac-cording to two prerequisites: i) the offshore boundary is located so deep that transformation processes have not yet influenced the wavefield (deepwater condition) and ii) the lateral boundaries are distant enough so that any disturbance that may exist along them, cannot reach the region of interest.
The grid has a varying size decreasing from the deepwater contours towards approximately a 120 m water depth, the maximum depth at which offshore devices are expected to be deployed (and therefore the area of interest for wave energy exploitation). A key aspect to take into account is the fact that a strong variation in the available energy may exist in short distances (over a scale of hundreds of meters or even less), arising from a sudden variation of water depth. In other words, the character-ization matrices within the coastal region may greatly differ over short distances. This variation should be properly modelled, for which the implementation of a high resolution grid is required. After a thorough analysis of the bathymetry of the area of study (Fig. 5) and considering previous wave energy studies in the region [19], the grid size in the area of interest (of under a depth of 120 m) is set to 200 m, muchfiner than that normally used following a conventional procedure. This results in a total number of grid nodes of 69,847.
Prior to propagating the selected energy bins, the model is validated by comparing the numerical results and buoy records. For this purpose, the model is forced with deepwater conditions recorded by the Vilán-Sisargas buoy covering a 14-day period (half-month), from 1.2.2011 to 15.2.2011, and the results compared with Table 3
Sensitivity analysis (percentage of the total annual energy, % Energy, and percentage of the total annual time, % Time).
Number of energy bins % Energy % Time
182 50 42.8
381 75 66.8
622 90 83.5
787 95 88.7
1554 100 100
hourly sea state records provided by a coastal buoy located at a 60 m water depth (Fig. 1). This period is selected insofar as it con-siders the whole range of wave conditions that a WEC can harness, including very powerful sea states. Excellent agreement is found between computational results and measurements (Fig. 6), obtaining a correlation coefficient ofR¼0.924 andR¼0.917 for wave height and wave power, respectively.
Once validated the numerical model, the selected wave cases (787 energy bins) are propagated towards the coast. The wave conditions prescribed at the open ocean boundary representing each energy bin are set to those providing the average energy of the corresponding bin and the remaining spectral parameters defined following previous wave resource studies in the region[16]. For instance, in the case of the energy bin [Hm0¼3e3.5 m,Te¼9e9.5 s,
qm ¼ 303.75e326.25], the parameters propagated are:
Hm0¼3.269 m,Te¼9.25 s,qm¼315.
2.3. Wave energy resource at a particular location
This step of the methodology consists in obtaining the modified wave parameters at any site within the Death Coast (grid nodes of the computational domain) with a view to provide the elements allowing the computation of energy production. For this purpose, after running the model, the spectral parametersHm0,Te, andqmat
each grid node are obtained for each wave condition propagated and the wave power is computed according to[25]:
J ¼ rg Z2p
0
ZN
0
Sðf;qÞCgðf;hÞdfdq: (6)
Subsequently, the energy associated with each wavefield is obtained from its wave power and their probability of occurrence Fig. 5.3D bathymetry of the Death Coast region.
01/020 02/02 03/03 04/02 05//02 06/02 07/02 08/02 09/02 10/02 11/02 12/02 13/02 14/02 1
2 3 4 5x 10
5
J(W/m)
Jbuoy Jmodel
01/020 02/02 03/03 04/02 05//02 06/02 07/02 08/02 09/02 10/02 11/02 12/02 13/02 14/02 2
4 6 8
H m0
(m)
from the characterization of the deepwater wave resource (although the wave field is transformed as it propagates from deepwater to the shore, its probability of occurrence is conserved). As a result, the same spectral parameters of interest at the deep-water buoy are now available at any point of the computational grid. Therefore, the wave resource at any location within this region can be reconstructed in the form of a characterization matrix (with the same resolution of energy bins as the deepwater character-ization, and spatial resolution as the computational grid), following the same procedure explained in Section2.1.
2.4. A Matlab-based toolbox for characterization matrix generation
Thefinal step of this work is to develop a toolbox capable of reading the information stored in the database, and automatically reconstructing the wave energy resource, in terms of an energy diagram or characterization matrix with the appropriate resolution at any point within the Death Coast. Therefore, any device devel-oper, policy maker, researcher or stakeholder will be able to easily compute the energy production of any WEC at any location of interest.
For this purpose, it would be enough to compute and store the
figures corresponding to the total energy available and the number of hours of occurrence of each energy bin at each grid node (the
information included in the characterization matrix) and then develop a programme to handle this information. The problem lies in the fact that the storage of 69,847 characterization matrices (number of grid nodes) represents an enormous amount of data to be stored (it would occupy a great part of a personal computer hard disk) which, in addition, would considerably slow down (or even impede) the functioning of the programme. With this in view, a set of programmes written in MATLAB, which can directly read the information resulting from the 787 numerical propagations and automatically reconstruct (in real time) the characterization matrices, was developed without the need for storing a huge amount of data. The result is the toolboxWEDGE (Wave Energy Diagram GEnerator), a package of routines which works as follows. First, the toolbox is invoked by typing WEDGE in the Matlab Command Window (Fig. 7). Then, the user is asked to define the resolution of the energy bins of the characterization matrix (obvi-ously, the maximum resolution available isHm0¼0.5 m,Te¼0.5 s
in case of considering an omnidirectional matrix), which should be of the same level as that of the power matrix of the device used for energy production computations. Next, the toolbox asks for the location of interest where the characterization matrix is to be computed. This can be done in two different ways: i) by introducing manually the spatial coordinates or ii) by using a GUI (graphical user interface) specially designed for this purpose. If the user
chooses the second option, a map of the average power available including the bathymetric isolines is automatically plotted on which a pointer is available for the interactive selection of the desired location (Fig. 8). When the user defines a location, the code
finds the closest grid node (node_X and node_Y inFig. 7). After-wards, the information at this node corresponding to the spectral parameters stored resulting from the 787 wave cases propagated, as well as the number of annual hours of occurrence of each wave case, are read and used by the toolbox to reconstruct the corre-sponding energy diagram (characterization matrix) with the appropriate resolution (Fig. 9). As stated before, the computations are performed in real time, a process which only takes a few sec-onds. The total energy and the number of hours of occurrence corresponding to each energy bin of the characterization matrix (matrix_ener_year and matrix_hour_year variables, respectively), together with other data of interest are automatically stored within the structured variabledata_location(Fig. 7). Thereby, the user can select the required information for energy production calculations depending on the characteristics of the device’s power matrix (Table1or2).
It is important to note that the energy bins of the character-ization matrix showed (Fig. 9) correspond with a bivariate distri-bution of the Hm0 and Te in which the qm is neglected
(omnidirectional matrix). This stems from the fact that, as stated in Section2.1, the power matrices currently provided by device de-veloperse with which the characterization matrices have to be combined in order to compute the energy productioneare also omnidirectional. Nevertheless, the wave direction is taken into account throughout the development of the database; in particular, the numerical model computes the modification of the wave di-rection of each energy bin in their propagation from deepwater towards the coast, and the results are stored within the database together with the remaining spectral parameters. Thus, the user can use the database to generate 3D characterization matrices (including wave direction), if the information related to the
varia-Finally, some regions of interest for wave energy exploitation have been shown to exhibit a significant seasonal or even monthly wave climate variability [26e31]. In this case, in addition to the
total energy production, intra-annual wave resource information should be analysed for computing other parameters of interest providing relevant information for the proper configuration of WECs (e.g. installed capacity)[16].
3. Case study
The interest of the present database, as previously explained, lies in two facts. Infirst place it has been shown in Section2the need for describing the resource in the form of a characterization matrix with the appropriate resolution of energy bins, given that Fig. 8.GUI for selecting a point of interest where the characterization matrix is to be computed.
the WEC’s power matrix with which it has to be combined has also a specific bin resolution. The current lack of this information is solved for the Death Coast by means of the present database, which is capable of generating characterization matrices with the same resolution as the maximum resolution of the WECs’ power matrices. In second place, the irregular bathymetry of some areas may cause abrupt changes in the spatial distribution of the resource, and therefore the characterization matrices within the coastal region may greatly differ in short distances. Thus, this resource variability should be properly described for accurate wave energy production computations.
In this section, the importance of the spatial resolution provided by the present database for properly describing the spatial vari-ability of the wave energy resource, is analysed through a case study. The available wave power in this region has been previously studied, and several hot spots identified and proposed as possible areas for wave energy exploitation[18]. One of these areas is of special interest, due to its being located next to two harbours (Fig. 1), and thus selected for further analysis with the database.
Prior to this work, the only data available for energy production computations in this region were those corresponding to the SIMAR-44 dataset (black circles inFig. 1) (in addition to buoy data), composed of hindcast wave data covering a 44-year period (1958e 2001) with a 3-h frequency. These dataset were obtained using the WAM third generation spectral model forced with wind fields provided by the REMO atmospheric model within the HIPOCAS project[32] which in turn was forced with data resulting from global atmospheric reanalysis computed by the U.S. National Center for Environmental Prediction. Despite their constituting a set of
energy a WEC would produce at a specific coastal location of in-terest. In the present case study, the closest SIMAR point to the proposed area for wave energy exploitation (Fig. 1) is located at a distance of more than 20 km and, more importantly, at an utterly different depth. Therefore, the resource provided by SIMAR point is expected to be quite different from that within the area of interest, which in turn would lead to significant inaccuracies when computing the energy production in the proposed area, should SIMAR characterization matrix be used for this purpose. In addi-tion, SIMAR dataset does not provide information related to theTe;
instead, the peak period,Tphas to be transformed intoTeassuming
a specific spectrum, leading to a less precise estimation of the en-ergy contained in each enen-ergy bin.
In order to accurately define the deviation of the wave resource between the closest SIMAR point and within the area proposed for a wave farm, the characterization matrices at SIMAR location and at three locations within the area of interest are compared (Figs. 10 and11). In the case of the SIMAR point the characterization ma-trix (Fig. 12) is computed assuming thatTe¼0.9Tpfollowing
pre-vious studies[16]. In addition, it has been stated that in areas with irregular bathymetry, as it is the case, changes in the available wave energy resource could exist over scales of hundreds of meters or even less, meaning that the energy that could be produced at different locations within the proposed area could greatly differ. On this basis the three locations selected (A,B,C) are separated by a distance of less than 500 m (Fig. 11) and their characterization matrices computed by means of the database (Fig. 13). For clarity and comparison purposes, the resolution of the energy bins is set to
H ¼0.5 m andT ¼1 s (of a maximum ofT ¼0.5 s).
Fig. 10.Average wave power [kW/m] throughout the Death Coast. The rectangle indicates the coastal zone within which the variations in the wave energy resource are analysed (Fig. 11).
proposed area, as it could be expected for the distance and different depth. In addition, when comparing the characterization matrices at the three points (A, B, C) within the area of interest, significant deviations, although of less importance, are again observed. The major difference consists in that, whereas at point A the bulk of the
energy is distributed over a wide range ofHm0andTe, at points C
and especially B, it is concentrated within a reduced number of energy bins. Obviously, the significant dissimilarities in the resource will lead to significant deviations in the estimation of the actual energy a WEC would produce.
4. Conclusions
A correct decision-making regarding wave energy exploitation should be based on an accurate knowledge of the different factors affecting its exploitation. Amongst them, the estimation of energy production of a WEC at a location of interest is of key importance. In this paper, a comprehensive procedure, far from the conventional approach, is implemented in the Death Coast (NW Spain) with the aim of developing a geospatial database of the wave energy resource providing the required information for conducting this estimation with accuracy and reliability throughout this region.
First, the deepwater wave energy resource is characterized based on a large dataset of spectral buoy records and following the
energy binconcept, or trivariate intervals of significant wave height, energy period and mean wave direction. Furthermore, in contrast with the conventional approach which considers only a handful of study cases and a limited resolution of the energy bins, this work covers 95% of the total energy (which in practice represents virtually 100% of the exploitable resource) with a resolution of 0.5 m of wave height, 0.5 m of period and 22.5of wave direction. This resolution is shown to be enough to characterize the resource with a view to energy production calculations. Next, a high reso-lution numerical model (grid spacing of 200 m) is implemented and a total of 787 wave cases (those corresponding to 95% energy level) are propagated.
Finally, a Matlab-based toolbox called WEDGE capable of accessing the database and of reconstructing the wave energy resource at any point in the Death Coast is implemented. It allows the selection of any location (resolution of 200 m) and the computation of its characterization matrix with the aforemen-tioned size of energy bins. Once computed the matrix, the relevant Fig. 11.Average wave power map of the coastal zone marked inFig. 10with the
lo-cations (A, B, C and SIMAR) at which the characterization matrices are reconstructed.
information is automatically stored and thereby, it suffices to combine it with the corresponding information contained in the WEC’s power matrix to determine the energy production at the desired location.
The interest of this database, and in particular of the spatial resolution provided, is further investigated by means of a case study, a recently proposed wave farm in the Death Coast. Several wave characterization matrices are generated and compared: i) a characterization matrix at the SIMAR point closest to the proposed area for the wave farm, which is at a distance of more than 20 km (the only wave resource dataset available prior to the present work), and ii) three characterization matrices at three different locations within the proposed area, separated by less than 500 m. It is shown that,first, in the present case study SIMAR dataset are not valid for energy production computations and further information is necessary, and second, a high resolution spatial database (more than 500 m) is required in such regions of irregular bathymetry as the Death Coast.
database allows the generation of high resolution characterization matrices at any coastal site and thus providing accuracy and reli-ability in the computation of the energy that any WEC would produce at any location of interest. Although the present database is currently only available for this region, the procedure developed in this work could be used to produce a database in any other coastal region in which long-term deepwater data are available.
In future work, the database will be extended so as to produce additional information of interest for wave energy exploitation. In particular, it will be extended in order to compute intra-annual characterization matrices providing relevant information for the proper configuration of a WEC at a specific location of interest.
Acknowledgements
This work has been conducted in the framework of the project
Development of a Geospatial Database of the Exploitation of the Wave
Fig. 13.Characterization matrices of the wave resource at points A, B, C within the proposed area for a wave farm. The colour plot indicates the energy available, and the numbers the occurrence in hours in an average year corresponding to each energy bin. (For interpretation of the references to colour in thisfigure legend, the reader is referred to the web version of this article.)
Renewable Energy Resourcesof the Spanish Ministry of Science and Innovation.
List of symbols
Hm0 significant wave height [m]
Te energy period [s] qm mean wave direction []
mn n-th spectral moment [m2Hzn]
S spectral density [m2Hz1]
q wave direction []
f wave frequency [Hz]
J wave power per unit width [kWm1]
r seawater density [kgm3]
g gravitational acceleration [ms2]
Cg group velocity [ms1]
k wave number [m1]
h local water depth [m]
Tp peak period [s]
References
[1] Bahaj AS. 8.01-Generating electrical power from ocean resources. In:
Sayigh Ali, editor. Comprehensive renewable energy. Oxford: Elsevier; 2012. pp. 1e6.
[2] Lund H. Renewable energy strategies for sustainable development. Energy
2007;32(6):912e9.
[3] Falcão AFdO. Wave energy utilization: a review of the technologies. Renew
Sustain Energy Rev 2010;14(3):899e918.
[4] Lopes MFP, Hals J, Gomes RPF, Moan T, Gato LMC, Falcão AFdO. Experimental
and numerical investigation of non-predictive phase-control strategies for a
point-absorbing wave energy converter. Ocean Eng 2009;36(5):386e402.
[5] Fernandez H, Iglesias G, Carballo R, Castro A, Fraguela JA, Taveira-Pinto F, et al. The new wave energy converter WaveCat: concept and laboratory tests. Mar Struct 2012;29:58e70.
[6] Cruz JMBP, Sarmento AJNA. Sea state characterisation of the test site of an
offshore wave energy plant. Ocean Eng 2007;34(5e6):763e75.
[7] Caska AJ, Finnigan TD. Hydrodynamic characteristics of a cylindrical
bottom-pivoted wave energy absorber. Ocean Eng 2008;35(1):6e16.
[8] Smith HCM, Haverson D, Smith GH. A wave energy resource assessment case
study: review, analysis and lessons learnt. Renew Energy 2013;60(0):510e21. [9] Iglesias G, Carballo R. Wave energy and nearshore hot spots: the case of the SE
Bay of Biscay. Renew Energy 2010;35(11):2490e500.
[10]Iglesias G, Carballo R. Wave energy resource in the Estaca de Bares area
(Spain). Renew Energy 2010;35(7):1574e84.
[11] Akpinar A, Kömürcü MI. Wave energy potential along the south-east coasts of
the Black Sea. Energy 2012;42:289.
[12] Akpınar A. Kömürcü M_I. Assessment of wave energy resource of the Black Sea based on 15-year numerical hindcast data. Appl Energy 2013;101(0):502e12.
[13] Rusu L, Guedes Soares C. Wave energy assessments in the Azores islands.
Renew Energy 2012;45:183e96.
[14] Rusu E, Guedes Soares C. Wave energy pattern around the Madeira Islands.
Energy 2012;45(1):771e85.
[15] Lenee-Bluhm P, Paasch R, Özkan-Haller HT. Characterizing the wave energy
resource of the US Pacific Northwest. Renew Energy 2011;36(8):2106e19.
[16] Carballo R, Iglesias G. A methodology to determine the power performance of
wave energy converters at a particular coastal location. Energy Convers Manag 2012;61(0):8e18.
[17] Iglesias G, Carballo R. Choosing the site for thefirst wave farm in a region: a case study in the Galician Southwest (Spain). Energy 2011;36(9):5525e31. [18] Iglesias G, Carballo R. Wave energy potential along the Death Coast (Spain).
Energy 2009;34(11):1963e75.
[19] Carballo R, Iglesias G. Wave farm impact based on realistic wave-WEC
interaction. Energy 2013;51(0):216e29.
[20] The Carbon Trust. Oscillating water column wave energy converter evaluation
report. Arup Energy (for Carbon Trust); 2005.
[21] Babarit A, Hals J, Muliawan MJ, Kurniawan A, Moan T, Krokstad J. Numerical
benchmarking study of a selection of wave energy converters. Renew Energy 2012;41:44e63.
[22] Iglesias G, López M, Carballo R, Castro A, Fraguela JA, Frigaard P. Wave energy potential in Galicia (NW Spain). Renew Energy 2009;34(11):2323e33.
[23] Dean RG, Dalrymple RA. Water wave mechanics for engineers and scientists.
World Scientific; 1991.
[24] Booij N, Ris RC, Holthuijsen LH. A third-generation wave model for coastal
regions 1. Model description and validation. J Geophys Res C Oceans 1999;104(C4):7649e66.
[25] Iglesias G, Carballo R. Offshore and inshore wave energy assessment: Asturias (N Spain). Energy 2010;35(5):1964e72.
[26] Neill SP, Hashemi MR. Wave power variability over the northwest European
shelf seas. Appl Energy 2013;106(0):31e46.
[27] Iglesias G, Carballo R. Wave resource in El Hierrodan island towards energy
self-sufficiency. Renew Energy 2011;36(2):689e98.
[28] Sierra JP, González-Marco D, Sospedra J, Gironella X, Mösso C,
Sánchez-Arcilla A. Wave energy resource assessment in Lanzarote (Spain). Renew Energy 2013;55(0):480e9.
[29] Iglesias G, Carballo R. Wave power for La Isla Bonita. Energy 2010;35(12):
5013e21.
[30] González-Marco D, Sierra JP, Fernández de Ybarra O, Sánchez-Arcilla A.
Im-plications of long waves in harbor management: the Gijón port case study.
Ocean Coast Manag 2008;51(2):180e201.
[31] Veigas M, Iglesias G. Wave and offshore wind potential for the island of
Tenerife. Energy Convers Manag 2013;76:738e45.
[32] Pilar P, Soares CG, Carretero JC. 44-year wave hindcast for the North East
Atlantic European coast. Coast Eng 2008;55(11):861e71.
IV
Intra-annual wave resource
characterization for energy exploitation:
A new decision-aid tool
R. Carballo, M. Sánchez, V. Ramos, J.A. Fraguela and G. Iglesias
Energy Conversion and Management 93, 1–8 (2015) Elsevier, ISSN: 0196-8904
Intra-annual wave resource characterization for energy exploitation:
A new decision-aid tool
R. Carballoa,⇑, M. Sáncheza, V. Ramosa, J.A. Fraguelab, G. Iglesiasc
aUniv. of Santiago de Compostela, Hydraulic Eng., Campus Univ. s/n, 27002 Lugo, Spain
bUniv. of A Coruña, Naval Architecture and Ocean Eng., EPS, Mendizábal s/n, 15403 Ferrol, Spain
cUniv. of Plymouth, School of Marine Science and Engineering, Marine Building, Drake Circus, Plymouth PL4 8AA, United Kingdom
a r t i c l e i n f o
Article history:
Received 23 February 2014 Accepted 24 December 2014 Available online 17 January 2015
Keywords:
Intra-annual variability Power performance High-resolution iWEDGE
a b s t r a c t
The wave energy resource is usually characterized by a significant variability throughout the year. In esti-mating the power performance of a Wave Energy Converter (WEC) it is fundamental to take into account this variability; indeed, an estimate based on mean annual values may well result in a wrong decision making. In this work, a novel decision-aid tool,iWEDGE (intra-annual Wave Energy Diagram GEnerator) is developed and implemented to a coastal region of interest, the Death Coast (Spain), one of the regions in Europe with the largest wave resource. Following a comprehensive procedure, and based on deep water wave data and resolution numerical modelling, this tool provides the monthly high-resolution characterization matrices (or energy diagrams) for any location of interest. In other words, the information required for the accurate computation of the intra-annual performance of any WEC at any location within the region covered is made available. Finally, an application ofiWEDGE to the site of a proposed wave farm is presented. The results obtained highlight the importance of the decision-aid tool herein provided for wave energy exploitation.
Ó2015 Elsevier Ltd. All rights reserved.
1. Introduction
Wave energy has emerged as one of the renewables with the capacity to contribute large amounts of energy to society[1]. For this purpose, different types of Wave Energy Converters (WECs) are close to achieving a commercial stage[2–4]. There exist a wide variety of WECs which can be classified based on different criteria, such as the distance to the shoreline and water depth, the size and orientation relative to the waves, and the principle of operation. Regarding the principle of operation, three main types can be distinguished: overtopping devices (OTDs) [5], oscillating water columns (OWCs)[6,7]and wave activated bodies (WABs)[8].
Overall, the selection of the suitable converter depends on dif-ferent aspects, amongst which the magnitude and distribution of the available resource is of major importance. Therefore, along with the development of WECs, a good climate description is cru-cial for a proper decision making and planning of the resource exploitation. In particular, the distribution of the energy resource in a region is the basis for the combined selection of the most appropriate location and type of WEC, as well as to define its opti-mum configuration. Furthermore, the optiopti-mum configuration of a
WEC should be defined through an exhaustive analysis of different power performance parameters of a selected WEC-site combina-tion. This is of special interest in the case of islands or when a spe-cific energy demand is to be supplied[9–13]and energy storage is required[14]. In this vein, it is important to bear in mind that the information required at a given coastal location for WEC perfor-mance computations is a characterization matrix (or energy dia-gram) describing the available energy and occurrence of the different combinations of the relevant spectral parameters or
energy bins[15]. This information is then combined with the power matrix of the WEC in question to compute the various performance parameters.
In addition, it has been shown that the regions with the greatest wave energy potential exhibit an important intra-annual variabil-ity of the resource[16,17]which may lead to a significant intra-annual variability in the power performance of WECs. Thus, to compute the power performance of a WEC at a coastal site exhib-iting significant intra-annual energy variability on the basis of mere annual figures may lead to an incorrect decision making regarding the definition of the wave farm configuration. Instead, intra-annual matrices of the resource covering a period (e.g., monthly, seasonal. . .) capable of reflecting the existing variability of the resource should be generated at the location of interest. In spite of this, regional assessments usually focus on averaged
⇑Corresponding author. Tel.: +34 982 285900; fax: +34 982 285926.
E-mail address:rodrigo.carballo@usc.es(R. Carballo).
Energy Conversion and Management 93 (2015) 1–8
Contents lists available atScienceDirect


![Fig. 10. Average wave power [kW/m] throughout the Death Coast. The rectangle indicates the coastal zone within which the variations in the wave energy resource are analysed ( Fig](https://thumb-us.123doks.com/thumbv2/123dok_es/7031511.312364/35.892.210.697.118.557/average-rectangle-indicates-coastal-variations-energy-resource-analysed.webp)