Decomposition and nutrient release from leaf litter in
Eucalyptus grandis
plantations on three different soils in Entre Ríos, Argentina
Descomposición y mineralización de la hojarasca foliar en plantaciones de
Eucalyptus grandis
en tres tipos diferentes de suelos en Entre Ríos, Argentina
Juan F Goya a*, Jorge L Frangia, Carolina Péreza,Fernando Dalla Teab
*Corresponding autor: a Universidad Nacional de La Plata, Laboratorio de Investigación de Sistemas Ecológicos y Ambientales
(LISEA), CC 31, 1900 La Plata, Argentina, tel.-fax: +54-221-4271442, jgoya@agro.unlp.edu.ar, lisea@agro.unlp.edu.ar
b Forestal Argentina SA, CC 32, 3200 Concordia, Argentina.
SUMMARY
The decay of organic matter returned to the soil via litter fall is an important source of nutrients for vegetation uptake. The rate of decomposition of organic matter, release, and immobilization of nitrogen, phosphorus, potassium, calcium, magnesium, manganese, iron and aluminum of fresh leaf litter of Eucalyptus grandis were measured using litter bags in three trial plots located on an Oxic Quartzipsamment (red sandy), a Fluventic Haplumbrept (dark sandy), and an Argiudolic Pelludert soil (black clay soils). The annual rate of decay of dry matter (k) was faster in clay soil (0.44) than in both sandy soils (0.30). Temporal patterns of changes in nutrient concentration in leaf litter were similar at both sandy soil sites compared to the clay soil. Nitrogen and phosphorus increased over time at all sites, but their immobilization was greater at the clay soil site. Calcium, magnesium and manganese fluctuated with a different pattern in each soil type. Iron and aluminum showed a similar pattern of increasing concentration at each site. A higher rate of dry mass loss, together with an increase in nitrogen and phosphorus immobilization, was observed at the more fertile clay soil site.
Key words: decay rate, sandy soil, clay soil, nitrogen, phosphorus.
RESUMEN
La descomposición de la materia orgánica que ingresa al suelo a través de la caída a la hojarasca es una fuente importante de nutrientes para la vegetación. Se estimaron la tasa de descomposición de la materia orgánica, la liberación/inmovilización de nitrógeno, fósforo, potasio, calcio, magnesio, manganeso, hierro y aluminio de hojas recién caídas de Eucalyptus grandis utilizando bolsas de descomposición en parcelas de ensayo situadas en tres tipos de suelos: Oxic Quartzipsamment (arenoso), Fluventic Haplumbrept (mestizo) y Argiudolic Pelludert (arcilloso). La tasa anual de descomposición de la materia seca (k) fue más rápida en el suelo arcilloso (0,44) que en los suelos arenoso y mestizo (0,30). El patrón temporal de cambios de las concentraciones de nutrientes en la hojarasca fue similar entre los suelos arenoso y mestizo, comparados con el arcilloso. La concentración de nitrógeno y fósforo aumentó con el tiempo en los tres sitios, pero su inmovilización fue mayor en el sitio arcilloso. Las concentraciones de calcio, magnesio y manganeso fluctuaron de forma diferente en cada tipo de suelo. En cada sitio, las concentraciones de hierro y aluminio aumentaron de manera similar. Una mayor tasa de pérdida de masa seca, junto con un aumento de inmovilización de nitrógeno y fósforo se observó en el suelo arcilloso, relativamente más rico en nutrientes.
Palabras clave: tasa de descomposición, suelo arenoso, suelo arcilloso, nitrógeno, fósforo.
INTRODUCTION
The decay of organic matter returned to the soil via litter fall is an important source of inorganic ions for vegetation uptake. Nutrients are released from decaying organic matter by physical (leaching) and biological (mi-crobial decay) processes (Baker and Attiwill 1985). The sequence from fresh litter to stable soil organic matter has been defined as a decay continuum (Melillo et al. 1989). Release/immobilization proceeds through time in different ways according to the mobility, concentration and biotic
role of nutrients, the activity of organisms and the physi-cal environment.
Leaf and woody litter are important pools of organic matter and nutrients in E. grandis plantations. Fourteen year old plantations have 25 Mg ha–1 of litter with a low concentration of nitrogen (8 kg Mg–1 ) and phosphorus (0.25 kg Mg–1) (Dalla Tea and Marcó 1991). Annual litter fall is ca. 6 Mg ha–1 and litter stock attains 20 Mg ha–1 at a red sand site (Goya et al. 1997a), resulting in a total litter turnover time of 3.3 yr. Returned dry matter is combustible fuel and a source of nutrients entering the mineral soil via burning or decay. Burning of harvesting slash is a common practice in Entre Ríos. A lack of H layer, scarcity of humus formation and a high annual disappearance of organic matter in the forest floor under
Eucalyptus spp. plantations have been reported (Cozzo 1976, Madeira 1989).
Organic stocks and litter fall rates, together with decay rates, influence organic matter disappearance. However, the aboveground net productivity and nutrient concentration in leaves among E. grandis plantations differ markedly according to site conditions (Cozzo 1976, Marcó 1988, Goya et al. 1997ab).
The C:N, C:P and N:P ratios, as well as lignin:N, have been used as quality indexes of decomposing organic matter in different ecosystems (Brinson 1977, Vogt et al. 1986, Baker III et al. 2001). Ratios also indicate the relative abundance of nutrients considered and some thresholds have been established where decomposition readily occurs (Alexander 1977). Physicochemical properties of soils are important controlling decomposition processes and dry matter quality (Anderson and Flanagan 1989). Clay soils have higher content of bases, pH and water reten-tion. These conditions accelerate decomposer activity and rates during the initial phase of decomposition (Anderson 1988, Oades 1988, O’Connell and Grove 1996, Louzada
et al. 1997).
The decomposition and nutrient release rate of leaf litter among soil types with different physical and chemi-cal characteristics, and different water retention behavior were investigated (Graciano et al. 2005). The dynamic of organic matter decay and release-immobilization of nitrogen, phosphorus, calcium, potassium, magnesium, manganese, iron and aluminum in recent fallen leaves of
E. grandis was followed at three plantations on red sandy, dark brown sandy and black clay soil sites.
The hypotheses stated were: (1) decomposition occurs faster at more humid and fertile site where leaves have higher nitrogen, phosphorus and potassium concentration in biomass, and (2) the release-immobilization pattern of each nutrient is different due to different site conditions.
METHODS
Study sites. This study was carried out in three ex-perimental sites supporting 15-year-old E. grandis stands originally planted with 1,100 trees ha–1 from South African
provenances. Stands characteristics are shown in table 1. The three sites were located in the vicinity of Concordia city (31º 23’ S, 58º 02’ W) in the Province of Entre Ríos, Argentina. Annual means are 18.9° C of temperature and 1307.8 mm of precipitation (SMN 1992). Soil types are Oxic Quartzipsamment (Entisols; local name: red sandy), Fluventic Haplumbrept (Entisols; local name: dark brown sandy), and Argiudolic Pelludert (Vertisols; local name, black clay soils) (Marcó 1988, Soil Survey Staff 1992, Dalla Tea and Marcó 1996). The red sandy soil is deep (> 150 cm) and well drained. The dark brown sandy soil is a sandy loam, well drained and less deep, ca 70 cm. The black clay soil is a silty clay loam, with < 35 cm depth, impeded drainage and saturated to water stagnated condi-tions mainly during November, when rainfall is intense and precipitation is greater than potential evapotranspiration. Although summer is the rainiest season, water deficits are common. Soil humidity equivalent, cation exchange capacity and base saturation increase in the mentioned soil sequence (table 1).
Decay assays. Leaves for decay assays were collected during the main fall period (January-February). The fine and coarse debris present in a 9 x 9 m quadrat per site were cleaned off, and waited for 10 days to collect leaves recently fallen. The collected leaves were air-dried for one day before the beginning of the decomposition assay employing the mesh-bag method (Bocock et al. 1960). Fifty nylon bags of 10 x 20 cm, 4 mm mesh, per site, were filled with 10 g air-dried foliage, and returned to the corresponding site. A dry weight factor per site was obtained after re-weighing five bags dried at 70° C to constant weight. Bags were located on the ground on February 20th, 1994 (day 0) and five bags per site were randomly collected after 20, 46, 90, 136, 186, 271, 360 and 551 days, ending on August 25th, 1995. They were dried at 70° C to constant weight also.
Data analyses. The exponential model proposed by Olson (1963) was employed to calculate the decomposition constant (k). Regression analyses were used to estimate a release constant (k) for nutrients that fitted the exponential model. Maximum amount of nitrogen (and phosphorus) accumulated per unit of initial litter mass during the immobilization phase was calculated from the slope and intercept of the linear regression equation between nitrogen (or phospho-rus) concentration and dry mass remaining. Data of initial points, where lixiviation of soluble compounds occurred, were previously excluded (Aber and Melillo 1980, 1982, Aerts and de Caluwe 1997).
Statistics. Time 0 nutrient concentration in leaf litter among sites, initial and final nutrient concentrations in leaf litter in each site, the C:nutrient and N:P ratios, were compared using one way ANCOVA and Tukey’s test (α= 0.05). Data were tested for normality and homocedasticity, no data transformation was done.
Slope decomposition values (k) of the models adjusted for each site were compared using covariance analysis (ANCOVA, α= 0.05) (Sokal and Rohlf 1981). ANCOVA analyses used the site as a main factor, the logarithm of
remaining dry weight as the dependent variable, and time as the covariate. The comparison of the decomposition rates between soils, based on the slopes of the regressions of dry weight on time, involved the problem of autocor-related errors which affect the inferential procedure. Thus, a conservative significance level of 0.01 was adopted.
RESULTS
Nutrient concentrations in the remaining leaf litters.
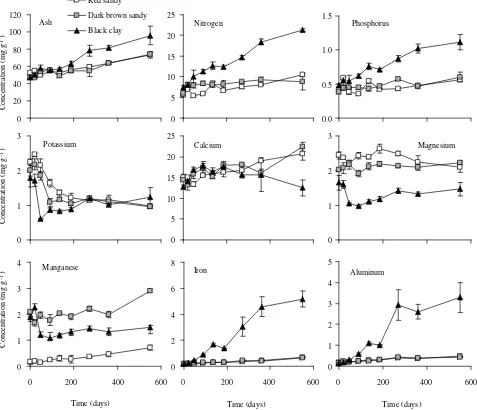
Nitrogen, phosphorus, potassium, iron and aluminum concentration in recent fallen leaves did not differ signifi-cantly among sites at the beginning of the assay (0 day). Calcium, magnesium, manganese and ash concentration were higher at red sandy soil (table 2). Ash concentra-tion increased significantly during the 551-day-interval at all sites. The increment was lower for sandy soils (red sandy = 1.4-fold, dark brown sandy = 1.6-fold) than for the black clay soil (2-fold) (figure 1). The temporal pat-terns of nutrient concentrations in residual leaf litters were generally similar between red sandy and dark brown sandy soils as compared to black clay soil (figure 1).
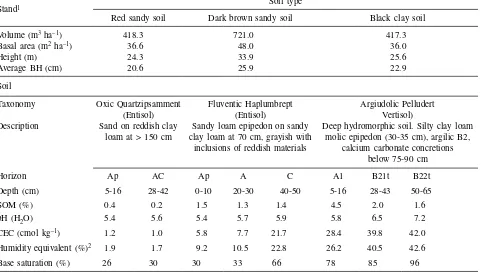
Table 1. Stand parameter and soil characteristics of three study sites with plantations of E. grandis inConcordia, Entre Ríos.
Características estructurales de los rodales y de los suelos en los tres sitios de estudio con plantaciones de E. grandis en Concordia, Entre Ríos.
Stand1 Soil type
Red sandy soil Dark brown sandy soil Black clay soil
Volume (m3 ha–1) 418.3 721.0 417.3
Basal area (m2 ha–1) 36.6 48.0 36.0
Height (m) 24.3 33.9 25.6
Average BH (cm) 20.6 25.9 22.9
Soil
Taxonomy Oxic Quartzipsamment (Entisol)
Fluventic Haplumbrept (Entisol)
Argiudolic Pelludert Vertisol) Description Sand on reddish clay
loam at > 150 cm
Sandy loam epipedon on sandy clay loam at 70 cm, grayish with
inclusions of reddish materials
Deep hydromorphic soil. Silty clay loam molic epipedon (30-35 cm), argilic B2,
calcium carbonate concretions below 75-90 cm
Horizon Ap AC Ap A C A1 B21t B22t
Depth (cm) 5-16 28-42 0-10 20-30 40-50 5-16 28-43 50-65
SOM (%) 0.4 0.2 1.5 1.3 1.4 4.5 2.0 1.6
pH (H2O) 5.4 5.6 5.4 5.7 5.9 5.8 6.5 7.2
CEC (cmol kg–1) 1.2 1.0 5.8 7.7 21.7 28.4 39.8 42.0
Humidity equivalent (%)2 1.9 1.7 9.2 10.5 22.8 26.2 40.5 42.6
Base saturation (%) 26 30 30 33 66 78 85 96
1 Stands characteristics from Goya et al. (1997b). SOM: soil organic matter. CEC: cation exchange capacity.
[image:3.612.77.558.123.396.2]Table 2. Nutrient concentration in Eucalyptus grandis leaf litter at the beginning of the decay assay at three sites in Concordia, Entre Ríos. Standard deviations in parenthesis. Different letters indicate significant differences among sites (n= 5, P < 0.05).
Concentración de nutrientes en la hojarasca foliar de E. grandis al comienzo del ensayo de descomposición en tres sitios en Concordia, Entre Ríos. Desviación estándar en paréntesis. Letras diferentes indican diferencias significativas entre sitios (n = 5, P < 0,05).
Soil type
Nutrient concentration (mg g–1)
N P K Ca Mg Mn Fe Al Ash
Red sandy soil 5.8 a (1.04)
0.4 a (0.03)
2.2 a (0.16)
15.0 a (1.34)
2.4 a (0.17)
2.5 a (0.16)
0.2 a (0.05)
0.2 a (0.02)
52.4 a (1.47) Dark brown sandy soil 6.0 a
(0.61)
0.4 a (0.05)
2.0 a (0.28)
14.5 ab (0.41)
2.0 a (0.07)
2.1 ab (0.06)
0.2 a (0.04)
0.2 a (0.02)
47.0 b (0.82) Black clay soil 7.4 a
(0.92)
0.5 a (0.04)
1.8 a (0.46)
12.7 b (0.68)
1.7 b (0.37)
1.9 b (0.27)
0.2 a (0.04)
0.2 a (0.02)
47.6 b (1.32)
Figure 1. Ash and nutrients concentration in decomposing leaf litter of E. grandis plantations over time at three sites in Concordia, Entre Ríos. Standard error bars are shown (n = 5).
Concentración de cenizas y nutrientes durante la descomposición de la hojarasca foliar enplantaciones de E. grandis en tres sitios en Concordia, Entre Ríos. Las barras verticales indican el error estándar (n = 5).
Potassium
0 1 2 3
Concentration (mg g
-1
)
Phosphorus
0.0 0.5 1.0 1.5
Magnesium
0 1 2 3 Calcium
0 5 10 15 20 25 Ash
0 20 40 60 80 100 120
Concentration (mg g
-1)
Red sandy
Dark brown sandy
Black clay Nitrogen
0 5 10 15 20 25
Iron
0 2 4 6 8
0 200 400 600
Time (days)
Aluminum
0 1 2 3 4 5
0 200 400 600
Time (days) Manganese
0 1 2 3 4
0 200 400 600
Time (days)
Concentration (mg g
[image:4.612.64.539.129.234.2] [image:4.612.59.536.271.681.2]Nitrogen and phosphorus concentrations showed a simi-lar pattern and their concentrations increased over time at all sites being more striking at black clay soil (figure 1). Potassium diminished to 50% of the initial concentration and reached similar values in all sites at the end of the study period (figure 1). At the end of the assay, calcium concentration at red sandy and dark brown sandy soils was higher than at the beginning and was significantly greater than black clay soil where calcium was similar to initial values (figure 1). Magnesium concentration at red sandy and dark brown sandy soils was significantly higher and less variable than at black clay soil. However, final values at all sites were not very different than their respective initial values (figure 1). Manganese concentra-tion was significantly higher and increased with decay time at both sandy sites. After an initial fluctuation, in black clay soil manganese stabilized at a lower value than the initial one (figure 1). Iron and aluminum showed a pattern of increasing concentration at each site but, despite their similar initial concentrations, sites differed significantly in their concentration increment during the study period. Iron and aluminum concentration at black clay soil after 551 days were, respectively, 26 and 21 times greater than initial concentrations. However, at red sandy and dark brown sandy soils they increased 3-4-times (figure 1).
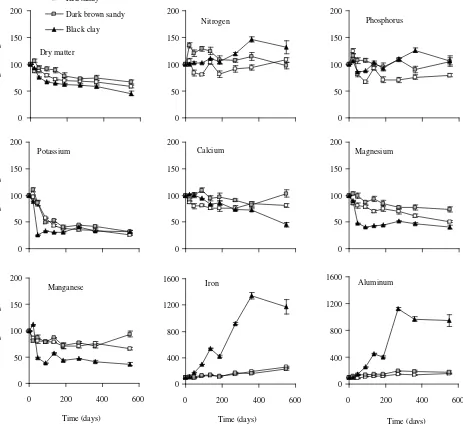
Decomposition rates of leaf litter and nutrient release or immobilization from decaying leaf litter. Dry matter decay rates of E. grandis were similar in both sandy soil sites (red sandy and dark brown sandy), and both were significantly lower than in the black clay soil site (table 3). Large dry matter losses occurred in the first 4-6 months of decay during the end of summer and autumn in all sites (figure 2).
Nutrients may be grouped in four groups according to their net gain or loss during decomposition: (1) nitrogen and phosphorus, (2) potassium, (3) magnesium, manganese and calcium, and (4) iron and aluminum.
(1) Nitrogen and phosphorus. Nutrient content in de-caying leaves fluctuated over time between immobilization and release, with a trend towards net retention in relation to dry matter, depending on soil type. Nitrogen and phos-phorus net release during the first year occurred at both sandy soil sites, but more evidently at red sandy soil. At the end of the assay the remnant nitrogen content at red sandy and dark brown sandy soils and that of phosphorus at dark brown sandy and black clay soils were similar to the initial nutrient content. The remnant content of nitrogen at black clay soil was 32% higher than the initial one, and phosphorus content at red sandy soil was 21% less than the initial one (figure 2).
At all sites we found a significant negative relation-ship between the percent of remaining dry matter and its nitrogen concentration. The immobilized nitrogen per gram of initial litter at red sandy soil was 6-7 times lower
than at the other sites (table 4). There was not significant relationship at red sandy soil between remaining dry mass and phosphorus concentration. Black clay soil immobilized twice more phosphorus per gram of initial leaf litter than did dark brown sandy soil (table 4).
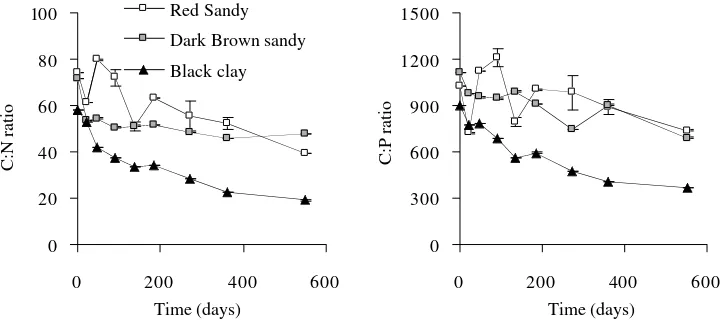
The C:N and C:P ratios in leaf litter were related to nitrogen and phosphorus retention or release behavior at
each site. A C:N ≈ 30 to 35 indicated a threshold between
release and retention at black clay soil, below this threshold there was net release. This threshold was higher at dark brown sandy soil: C:N ≈ 50 – 55. This relationship was weaker, and more erratic during the first 6 months at red sandy soil with a threshold for C:N ≈ 60 (figure 3). The C:P ratio at red sandy and dark brown sandy soils was related to both processes; if C:P>1,000 immobilization oc-curred, when 1000 > C:P > 800 release or immobilization was found and, with a C:P < 800 release predominated. Immobilization at black clay soil, was related to a C:P ratio > 900, with a 900 > C:P > 400 release or immobili-zation occurred and with a C:P < 400 release was found (figure 3).
The initial N:P ratio was among 14 and 16, and 19 to 23 at the end of the assay. The N:P ratio incremented significantly through time toward similar and higher values among sites.
(2) Potassium. Nutrient characterized by a fast initial release rate during 3 to 5 months followed by changes Table 3. Decay rate (k), half life (0.693/k), turnover time (1/k), standard error (SE) and adjustment of the exponential model of decomposing leaf litter (dry matter and organic matter) in
E. grandis plantations, at three sites in Concordia, Entre Ríos. Exponential model: Xt = X0 e-kt, where X
0 is the initial mass, Xt
is the mass at time t, and k the instantaneous decay rate (Olson 1963). Different letters indicate significant differences among sites (n = 90, P < 0.01).
Tasa de descomposición (k), vida media (0,693/k), tiempo de renovación (1/k), error estándar (SE) y ajuste del modelo exponencial de descomposición de la hojarasca foliar (materia seca y materia orgá-nica) en plantaciones de E. grandis, en tres sitios en Concordia, Entre Ríos. Modelo exponencial: Xt = X0 e-kt, donde X
0 es el peso inicial, Xt
es el peso en el tiempo t, y k es la tasa instantánea de descomposición. Letras diferentes indican diferencias significativas entre sitios (n = 90,
P < 0,01).
Soil type
k
(year–1)
Half-life (year)
1/k
(year) Model
SE
Adjusted R² Leaf litter dry matter
Red sandy soil 0.30 b 2.4 3.3 0.082 0.79
Dark brown sandy soil 0.30 b 2.3 3.4 0.062 0.89
Black clay soil 0.44 a 1.6 2.3 0.109 0.82
Leaf litter organic matter
Red sandy soil 0.32 b 2.2 3.1 0.073 0.85
Dark brown sandy soil 0.30 b 2.3 3.4 0.050 0.91
Figure 2. Change of remaining dry matter and nutrients in decomposing leaf litter of E. grandis plantations over time at three sites in Concordia, Entre Ríos. Standard error bars are shown (n = 5).
Peso remanente de materia seca y nutrientes durante la descomposición de la hojarasca foliar enplantaciones de E. grandis en tres sitios en Concordia, Entre Ríos. Las barras verticales indican el error estándar (n = 5).
Dry matter
0 50 100 150 200
% of original weight
Red sandy
Dark brown sandy
Black clay
Nitrogen
0 50 100 150 200
Phosphorus
0 50 100 150 200
Manganese
0 50 100 150 200
0 200 400 600
Time (days)
% of original weigth
Magnesium
0 50 100 150 200
Iron
0 400 800 1200 1600
0 200 400 600
Time (days)
Aluminum
0 400 800 1200 1600
0 200 400 600
Time (days) Calcium
0 50 100 150 200 Potassium
0 50 100 150 200
% of original weigth
weakly or not significantly correlated with the loss of organic matter, together with a final concentration lower than initial (figure 2).
Potassium release dominated the initial phase of de-composition (46 days) increasing its importance in the sequence red sandy (14%), dark brown sandy (25%), black clay (75%) soils. However, the regression slope (k) of potassium content in dry matter versus time was sig-nificantly different from zero at red sandy soil (k = 0.9;
P < 0.001; adjusted R² = 0.79) and dark brown sandy soil (k = 0.7; P < 0.001; adjusted R² = 0.69) only, with a good adjustment to the exponential model in both sites. At black clay soil, potassium content stabilized after the
initial release (45 d) and posterior immobilization (90 d), resulting in similar remnant weight of potassium (26-32%) at all sites at the end of the assay.
(3) Magnesium, manganese and calcium. Nutrient release for these nutrients was relatively associated with organic matter loss. Nutrient content versus time fitted the exponential regression model only for calcium at black clay soil (k = 0.5; P < 0.001; adjusted R² = 0.94), magnesium
at red sandy soil (k = 0.4; P < 0.001; adjusted R² = 0.88)
and dark brown sandy soil (k = 0.2; P < 0.001; adjusted
R² = 0.81), and manganese at red sandy soil (k = 0.2;
P < 0.05; adjusted R² = 0.45). During the first year of
[image:6.612.69.532.68.492.2]Table 4. Models of dry matter loss vs. nutrient concentration (nitrogen and phosphorus) (df = 6), and maximum amount of immobilized nitrogen and phosphorus (mg nutrient /g initial litter) in E. grandis plantations at three sites in Concordia, Entre Ríos.
Modelos de la pérdida de materia seca vs. la concentración de nutrientes (nitrógeno y fósforo) (gl = 6), y máxima cantidad de ni-trógeno y fósforo inmovilizado (mg nutriente/g inicial de hojarasca) en plantaciones de E. grandis en tres sitios en Concordia, Entre Ríos.
Soil type Slope Adjusted
R² P Immobilization
Nitrogen
Red sandy soil –53.5 0.61 0.013 0.31
Dark brown sandy soil –202.7 0.51 0.027 2.00
Black clay soil –27.9 0.77 0.002 2.27
Phosphorus
Red sandy soil –286.5 – 0.570 –
Dark brown sandy soil –1,466.8 0.58 0.017 0.03
Black clay soil –543.1 0.68 0.007 0.06
and manganese was larger than immobilization (figure 2). Calcium content at both sandy soil sites stayed around 80% of initial content (figure 2). Calcium release at black clay soil was similar to dry matter decay (ca. 45% of initial) at the end of assay (figure 2). At this end, the net loss of magnesium was 49%, 26% and no significant at red sandy, dark brown sandy and black clay soils, respectively. Manganese release after 551 d was only significant at red sandy (34%).
(4) Iron and aluminum. Nutrient immobilization in-creased continuously over time, and nutrient concentration increased throughout the decay interval (figure 2). To the end of the assay, decomposing leaves exhibited greater content with an accumulation of aluminum (900%) and iron (1,200%) at black clay soil. Aluminum accumulated
ca. 50-80% and iron ca130–160% of initial content at the end of the studied period at red sandy and dark brown sandy soils, respectively.
DISCUSSION
Effect of site on decomposition rates of leaf litter.
Melillo et al. (1989) described the mass loss by a two-phase model: an initial two-phase of constant mass loss and a phase of very slow loss.At all sites the pattern of remnant weight over time suggests that, at ca. two years of decay, leaves remained at Phase I of Melillo et al. (1989).
The red sandy soil was more similar to black clay soil respect to stand structure and productivity. However these sites showed greater differences in patterns of decomposition and nutrient release rates of leaf litter. As hypothesized, the decay rate was significantly faster at black clay soil site, where a higher OM and inorganic colloids content of
soil determined a higher nutrient content, water holding capacity, water retention and reduced infiltration; creat-ing better conditions for microbial decomposers activity and leaching at L layer. These conditions favor a greater abundance of decay intervening fauna (O’Connell and Grove 1996, Louzada et al. 1997).
Effect of site on nutrient release/immobilization patterns from leaf litter. The classification of nutrients according to their net gain or loss during decay showed that, with the exception of the fourth group (for aluminum and iron), the three first groups presented patterns similar to those of Baker and Attiwill (1985).
Despite no significant differences in chemical quality of the senescent leaves among sites at zero time, the lower C:N and C:P ratios at the black clay soil site at the end of the assay can be explained by a higher net nitrogen and phosphorus immobilization together with a faster organic matter decay, compared to both sandy soil sites. The decrease in C:N and C:P ratios was 67% and 59% of the initial value at black clay soil, whereas they were 47-34% for C:N and 28-38% for C:P at sandy sites. Nitrogen and phosphorus immobilization is a characteristic process in litter decomposition of Eucalyptus spp., with absolute increments of these nutrients (Baker and Attiwill 1985, Adams and Attiwill 1986, Attiwill et al. 1996, O’Connell and Grove 1996, Keith 1997, Corbeels et al. 2003). Our data suggest that nitrogen and phosphorus dynamics in decomposing leaf litter is affected by the soil properties of the site.
There is a theoretical critical detritus C:N ratio of approximately 30:1 above which heterotrophic microorgan-isms are N-limited and below which they are C-limited (Kaye and Hart 1997). The ratios for the three sites are higher than optimum for microorganisms during part of the decay period. The C:N and C:P ratios showed that soils of low fertility have higher immobilization thresholds than do fertile soils. However, at the three soil sites nutrient release occurred at high C:P values, much higher than C:P < 200 reported as a threshold for mineralization to occur (Duchaufour 1970). Nitrogen-limited environments generally show a higher dry mass loss per unit of nitrogen retained during decomposition (higher nitrogen-efficiency) but a slower decomposition rate (Swift et al. 1979, Pastor
et al. 1987, Seastedt et al. 1992). The lower immobilization of nitrogen and phosphorus (higher efficiency of decom-position) in sandy sites was consistent with the measured lower decomposition rate of leaf litter. Immobilization of nitrogen in Eucalyptus spp. forests has been considered a mechanism of resistance and recovery against perturba-tions (Adams and Attiwill 1986). Given immobilization of nitrogen and phosphorus in the studied plantations, leaf litter can be considered a sink (Piatek and Allen 2001).
The increased trends of N:P ratio during decomposition at the three sites might be explained by a higher proportional increase in nitrogen than in phosphorus concentration, as is also shown by a higher immobilization of nitrogen (5-34%) than phosphorus (0–12%). Atmospheric nitrogen could be the source for the increase in nitrogen content above the initial content in litter in different soils, meanwhile the phosphorus temporarily immobilized at the clay soil was probably supplied by soil P-released under anoxic conditions during water saturated periods as reported by Ponnamperuma (1972) for rice cultivated soils. Black clay soils were under rice cultivation before they were converted to eucalypt plantations.
Litter decay is a complex process with marked differ-ences among nutrients in their rates of release. Potassium, magnesium and calcium are among the most mobile nutrients in litter of eucalyptus forests (Attiwill 1968, O’Connell and Grove 1996). The release of nutrients that are not limiting microbial decomposers, and are not structurally bound in litter, may exceed mass loss, and leaching of leaf litter is commonly associated with the fast initial release of potas-sium (Baker and Attiwill 1985, Blair 1988, O’ Connell and Grove 1996). Sites order of increasing loss (red sandy, dark brown sandy and black clay soils) coincided with the increasing water influence at the soil surface. However, at all sites the final release of potassium was similar. That showed that potassium contribution to soil per unit of litter mass did not differ among sites.
Calcium, magnesium and manganese are associated with cell structures and are usually lost through litter de-composition (Baker and Attiwill 1985, Rustad and Cronan 1988, O’Connell and Grove 1996). In this study, calcium,
magnesium and manganese mineralization showed that nutrient losses were higher in the site with higher rate of dry mass loss (e.g. clay soil site). The ratios C:Ca, C:Mg and C:Mn at the start and end, at each site, remained un-changed, corroborating that the release of these nutrients was related to the rate of carbon release.
Aluminum and iron were accumulated in decompos-ing litter along the assay period, with a different order of magnitude among sandy and clay soils. That could be due to adsorption of these ions onto surfaces of decaying litter (Rustad and Cronan 1988). These authors mentioned that solubility of aluminum and iron increased during humid periods. The clay soil properties - higher content of organic matter, more water content, retention and also saturation and flooding periods- help to support the observed high-est rates of iron and aluminum accumulation and lowhigh-est C:Fe and C:Al ratios.
ACKNOWLEDGEMENTS
This research was funded by the Instituto Nacional de Tecnología Agropecuaria (INTA), Argentina, and devel-oped under cooperative agreement with the International Institute of Tropical Forestry-USDA Forest Service, Puerto Rico. Authors thank Mary Jeanne Sánchez, and Marcelo Arturi, for chemical and statistical support, respectively. We also thank to Corina Graciano, Marcelo Barrera and two anonymous reviewers for their valuable comments. This work was supported by PICT 2000–10061 (FONCyT-ANPCyT) and the Academia Nacional de Agronomía y Veterinaria, Argentina.
Figure 3. C:N and C:P ratios in decomposing leaf litter of E. grandis plantations over time at three sites in Concordia, Entre Ríos. Standard error bars are shown (n = 5).
Cocientes C:N y C:P durante la descomposición de la hojarasca foliar en plantaciones de E. grandis
en tres sitios en Concordia, Entre Ríos. Las barras verticales indican el error estándar (n = 5).
0 300 600 900 1200 1500
0 200 400 600
C:P ratio
0 20 40 60 80 100
0 200 400 600
Time (days) Time (days)
C:N ratio
Red Sandy
Dark Brown sandy
[image:8.612.115.476.62.222.2]REFERENCES
Aber JD, JM Melillo. 1980. Litter decomposition: measuring relative contributions of organic matter and nitrogen to forest soils. Can. J. Bot. 58: 416-421.
Aber JD, JM Melillo. 1982. Nitrogen immobilization in decaying hardwood leaf litter as a function of initial nitrogen and lignin content. Can. J. Bot. 60: 2263-2269.
Adams AM, PM Attiwill. 1986. Nutrient cycling and nitrogen mineralization in eucalypt forest of south-eastern Australia. II. Indices of nitrogen mineralization. Plant Soil 92: 341-362.
Aerts R, H de Caluwe. 1997. Nutritional and plant-mediated controls on leaf litter decomposition of Carex species.
Ecology 78: 244-260.
Alexander M. 1977. Introduction to Soil Microbiology. New York, USA. John Wiley. 491 p.
Anderson DW. 1988. The effect of parent material and soil development on nutrient cycling in temperate ecosystems.
Biogeochemistry 5: 71-97.
Anderson JM, PW Flanagan. 1989. Biological processes regulating organic matter dynamics in tropical soils. In Coleman D, JM Oades, G Uehara eds. Dynamics of Soil Organic Matter in Tropical Ecosystems. Hawaii. Niftal. p. 97-123. Attiwill PM. 1968. The loss of elements from decomposing litter.
Ecology 49: 142-145.
Attiwill PM, PJ Polglase, CJ Weston, MA Adams. 1996. Nutrient cycling in forests of south-eastern Australia. In Attiwill PM, MA Adams eds. Nutrition of Eucalypts. Canberra, Australia. CSIRO. p. 191-227.
Baker TG, PM Attiwill. 1985. Loss of organic matter and elements from decomposing litter of Eucalyptus obliqua L’Hérit. and Pinus radiata D. Don. Australian Forest Research
15: 309-319.
Baker III TT, BB Lockaby, WH Conner, TE Meier, JA Stanturf, MS Burke. 2001. Leaf litter decomposition and nutrient dynamics in four southern forested floodplain communities.
Soil Science 65: 1334-1347.
Blair JM. 1988. Nutrient release from decomposing foliar litter of three species with special reference to calcium, magnesium and potassium dynamics. Plant Soil 110: 49-55.
Bocock KL, O Gilbert, CK Capstick, DC Twinn, JS Waid, MJ Woodman. 1960. Changes in leaf litter when placed on the surface of soils with contrasting humus types. I. Losses in dry weight of oak and ash leaf litter. J. Soil Sci. 11: 1-9.
Brinson M. 1977. Decomposition and nutrient exchange of litter in an alluvial swamp forest. Ecology 58: 601-609. Coombs J, G Hind, RC Leegood, LL Tienszen, A Vonshsk. 1985.
Analytical techniques. In Coombs J, DO Hall, SP Long, JMO Scurlock eds. Techniques in Bioproductivity and Photosyntesis, Oxford, UK. Pergamon Press. p. 219-228. Corbeels M, AM O’Connell, TS Grove, DS Mendham, SJ Rance.
2003. Nitrogen release from eucalypt leaves and legume residues as influenced by their biochemical quality and degree of contact with soil. Plant Soil 250: 15-28. Cozzo D. 1976. Tecnología de la forestación en Argentina y
América Latina. Buenos Aires, Argentina. Hemisferio Sur. 610 p.
Dalla Tea F, MA Marcó. 1991. Respuesta del Eucalyptus grandis
a la aplicación de fertilizantes en suelos arenosos del N.E. de
Entre Ríos. In Jornadas sobre Eucaliptos de Alta Productividad. Buenos Aires, Argentina. CIEF. p. 290-300.
Dalla Tea F, MA Marcó. 1996. Fertilizers and Eucalypt plantations in Argentina. In Attiwill PM, MA Adams eds. Nutrition of Eucalypts. Canberra, Australia. CSIRO. p. 327-333. Duchaufour P.1970. Précis de Pédologie. Paris, France. Masson
et. Cie. 481 p.
Goya JF, JL Frangi, F Dalla Tea, MA Marcó, F Larocca. 1997a. Biomasa, productividad y contenido de nutrientes en plan-taciones de Eucalyptus grandis en el NE de la Provincia de Entre Ríos. In XII JornadasForestales de Entre Ríos. Concordia, Argentina. p. III-1-19.
Goya JF, JL Frangi, F Dalla Tea, MA Marcó, F Larocca. 1997b. Relación entre biomasa aérea, área foliar y tipos de suelos en plantaciones de Eucalyptus grandis del NE de Entre Ríos, Argentina. Revista de la Facultad de Agronomía de La Plata 102: 11-21.
Graciano C, JJ Guiamet, JF Goya. 2005. Impact of nitrogen and phosphorus fertilization on drought responses in Eucalyptus grandis seedlings. For. Ecol. Manage. 212: 40-49. IPCC (Intergovernmental Panel on Climate Change) 1996.
Greenhouse Gas Inventory Reference Manual. Guidelines for National Greenhouse Gas Inventories Volume 3. United Kingdom. IPCC, OECD and IEA.
Kaye JP, SC Hart. 1997. Competition for nitrogen between plants and soil microorganisms. Trends Ecol. Evol. 12: 139-143. Keith H. 1997. Nutrient cycling in eucalypt ecosystems. In
Williams JE, JZ Woinarski eds. Eucalypt Ecology, individu-als to ecosystems. Cambridge, UK. Cambridge University Press. p. 197-226.
Lockaby BG, MR Walbridge. 1998. Biogeochemistry. In Messina MG, WH Conner eds. Southern Forested Wetlands: Ecology and Management. Florida, USA. Lewis Publishers. p. 149-172.
Louzada JNC, JH Schoereder, P De Marco Jr. 1997. Litter de-composition in semideciduous forest and Eucalypt spp. crop in Brazil: a comparison. For. Ecol. Manage. 94: 31-36. Luh Huang CY, EE Schulte. 1985. Digestion of plant tissue for
analysis by ICP emission spectroscopy. Communications in Soil Science and Plant Analysis 16: 943-958.
Madeira MAV. 1989. Changes in soil properties under eucalyptus plantations in Portugal. In Pereira JS, JJ Landsberg eds. Biomass Production by Fast-Growing Trees. Dordrecht, Netherlands. Kluwer Academic Publ. p. 91-99.
Marcó MA. 1988. Incidencia del origen de la semilla y el sitio en el crecimiento de E. grandis en el Nordeste de Entre Ríos. In III Jornadas Forestales de Entre Ríos. Concordia, Argentina. p. 1-15.
Melillo JM, JD Aber, AE Linkins, A Ricca, B Fry, KJ Nadelhoffer. 1989. Carbon and nitrogen dynamics along the decay continuum: plant litter to soil organic matter. Plant Soil
115: 189-198.
Oades JM. 1988. The retention of organic matter in soils.
Biogeochemistry 5: 35-70.
O’Connell AM, TS Grove. 1996. Biomass production, nutri-ent uptake and nutrinutri-ent cycling in the jarrah (Eucalyptus marginata) and karri (Eucalyptus diversicolor) forests of south-western Australia. In Attiwill PM, MA Adams eds. Nutrition of Eucalypts. Canberra, Australia. CSIRO. p. 155-189.
Pastor J, MA Stillwell, D Tilman. 1987. Little bluestem litter dynamics in Minnesota old fields. Oecologia 72: 327-330.
Piatek KB, HL Allen. 2001. Are forest floors in mid-rotation stands of loblolly pine (Pinus taeda) a sink for nitrogen and phosphorus? Can. J. For. Res. 31: 1164-1174. Ponnamperuma FN. 1972. The chemistry of submerged soils. In
Brady NC ed. Advances in Agronomy24. New York, USA. Academic Press. p. 29-96.
Pritchett WL. 1986. Suelos forestales. México, México. Limusa. 634 p.
Rustad LE, C Cronan. 1988. Element loss and retention during litter decay in a red spruce stand in Maine. Can. J. For. Res. 18: 947-953.
Seastedt TR, WJ Parton, DS Ojima. 1992. Mass loss and nitrogen dynamics of decaying litter of grasslands: the apparent low nitrogen immobilization potential of root detritus. Can. J. Bot. 70: 394-391.
SMN (Servicio Meteorológico Nacional, AR). 1992. Estadísticas Climatológicas 1981-1990. Fuerza Aérea Argentina, Comando de Regiones Aéreas. Buenos Aires, Argentina. Servicio Meteorológico Nacional. (Serie B NE 37)
Sokal RR, FJ Rohlf. 1981. Biometry. San Francisco, USA. Freeman Press. 859 p.
Soil Survey Staff. 1992. Key to Soil Taxonomy. Agency Int. Develop-USDA Soil Conservation Service. Blacksburg, Virginia. Pocahontas Inc. (SMSS Technical Monograph N° 19) Swift MJ, OW Heal, JM Anderson. 1979. Decomposition in
Terrestrial Ecosystems. California, USA. University of California Press. 372 p.
Vogt KA, CC Grier, DJ Vogt. 1986. Production, turnover, and nutrient dynamics of above- and belowground detritus of world forests. Advances Ecol. Res. 15: 303-377.
Wilde SA, RB Corey, JG Iyer, GK Voigt. 1979. Soil and plant analysis for tree culture. New Dehli, India. Oxford & IBH Publishing. 224 p.