EICT Microsimulations for New
Public Policy Initiatives for
Mexico to tackle poverty
Araceli Ortega Díaz
Tecnológico de Monterrey
•
This paper estimates a Heckman correction equation to perform
simulations of an earned income tax credit (EITC) program for single
mothers, using an income and expenditure household survey to
assess the poverty reduction.
•
The results show that poverty decreases at least four percentage
points more with this program than with the current cash transfer
program “PROSPERA”, and at half cost.
•
In addition an income tax credit program fosters women formal
Motivation
•
This study main´s motivation emerged from the fact that after 19 years of
using cash transfers in Mexico, and not graduating people out of poverty it
is necessary to move to programs that can effectively graduate them in a
more sustainable and inclusive way.
•
Developed countries like Canada, United States, Austria, Australia,
Belgium, Finland, France, Finland, Germany, Greece, Italy, Netherlands,
New Zealand and the UK have stablished programs with employments
components that fight poverty more effectively than cash transfers due to
their influence in generating sustainable income. One of these programs is
the Earned Income Tax Credit (EITC), implemented since 1975 in United
States, the New Zeeland´s Working for Families Tax Credit in 1984 and the
UK´s Working Tax Credit in 1999. (Eissa, Kleven, & Kreiner, 2008b)
Why suggesting EITC and not more Cash transfers?
People do work in México, but they do it informally, more tan 60% of our labor force is informal.
0.42 0.47 0.52 0.57 0.62 0.67 0.72
1 child 2 child 3 child 4 child 5 or more chidren
Graph 2. Single women who work as a proportion of the total single women, 14 year old or more, according to the number of children born alive to them.
Source: Author´s own elaboration using ENOE quarterly data.
When the number of children increase from 2 to 3, 4 or 5 the female labor participation decreases .
Table 1. Average years of schooling of single mothers
aby size of locality according to
contractual situation.
Number of inhabitants Employment
status Less than 2 500 2,500 to 14,999 15,000 to 99,999 100,000 and more
Unemployed 4.0 4.7 6.6 9.6
Employed 6.0 7.8 8.2 10.6
Difference 2.1 3.1 1.7 1.0
a: Single mothers include unmarried, divorced and widow women without the presence of a male couple.
Source: Own estimation with data ENIGH 2014
Employed single/alone women with children in different geographical areas have more years of years of schooling on average. Whether it is a requirement to work or it is and effect of working is out of the scope of this papers, but it is observed that working women has at least 1 years of schooling more.
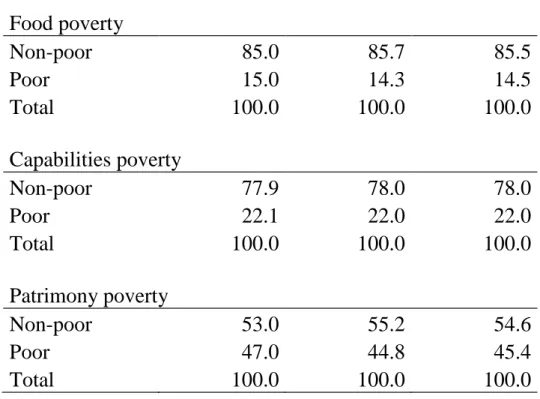
Table 2. Distribution of women by employment status and poverty
Unemployed Employed Total Food poverty
Non-poor 85.0 85.7 85.5 Poor 15.0 14.3 14.5 Total 100.0 100.0 100.0 Capabilities poverty
Non-poor 77.9 78.0 78.0 Poor 22.1 22.0 22.0 Total 100.0 100.0 100.0 Patrimony poverty
Non-poor 53.0 55.2 54.6 Poor 47.0 44.8 45.4 Total 100.0 100.0 100.0
Source: Own elaboration with data from ENIGH 2014
Taking into account the widest definition f poverty (patrimony) , it is observed that whether women are employed of unemployed there is still poverty, therefore any alternative program to cash transfers that offers employment should be [email protected]
Table 3. PROSPERA Beneficiaries
3. CASH TRANSFERS PROGRAM
Population in
2012 115 million Mexicans
19.7% in food poverty (22.66 million people) 28% in capabilities poverty (32.2 million people) 52.3% in patrimony poverty (60.15 million people)
Beneficiaries 5.2 million Families (25 million people.)
1. Enrolment and attendance: Primary, Secondary and Upper secondary. Higher education from September 2014.
2. Basic Health Services 3. Nutrition
Increase in school enrolment and attendance, but low performance. Increase in terminal efficiency
No impact Educational quality, employability and leave poverty Poor
Components
Impacts
Graph 4. PROSPERA budget (right) and Families supported (left)
Source: Own elaboration using data from 2nd Government Report, 2013-2014.
4. Earned Income Tax Credit (EITC)
Graph 5: Effect of EITC and CCT on budget constrain
B C
A
Hours worked/ Leisure
Consumption / Income
0
Phase in w(1+t) Flat
region w Phase out
w(1-t)
5. Simulation Methodology
The methodology of (Eissa et al., 2008b) is followed to estimate an equation that identifies women with characteristics that are likely to be incorporated in the Mexican labour force, these characteristics are related to schooling level, experience, age, geographical area and number of children.
To predict the labour income of those that do not work a wage equation in logs using Heckman (1979) selection equation is estimated. Estimating this equation corrects the bias caused by the decision of participating in the labour force.
Based on Heckman, the first stage consists in estimating a Probit model of labor participation:
𝑃𝑟𝑜𝑏 𝑆𝑖 = 1| 𝑍𝑖 = Φ 𝑍𝑖𝛾
S equals one for those who work, and Z is a vector of socioeconomic variables that determine whether the person would work or not. In the second stage consist in estimating the amount of wage.
𝐸 𝑌𝑖| 𝑋𝑖, 𝑍𝑖 , 𝑆𝑖 = 1 = 𝑋𝑖𝛽 + 𝜌𝜆 𝑍𝑖𝛾 , con 𝜆 𝑍𝑖𝛾 = ϕ 𝑍𝑖𝛾
Φ(𝑍𝑖𝛾)
For those who do not work we assume a distribution of the error with zero mean and variance equal to the variance of the error of people that work.
First. Once the person works, the taxable income and the amount of tax that each person should pay is calculated because the EITC is based on the wage and the rest of the taxable income.
Table 4 shows the two official definitions of taxable income by two Mexican government institutions: the Treasury (SHCP) and the National Council of Evaluation of the Social Policy (CONEVAL), the latter is the institution in charge of calculating the official poverty measures, and for that duty, it has to calculate an official income measure of the households. Therefore, the net income of households I calculated according to CONEVAL, and the tax rates calculated using the SHCP official laws.
Net income Gross income Investments income
Monetary income plus the non monetary income, minus the gifts
given by the household.
Monetay income plus the non monetary income.
Interests from fixed terms investments, interests from loans,
interests from saving accounts and yields from bonds and
warrants.
Labor income from professional activities and rentals, income from
corporate activities and interests, (pp.96).
Labor income, income from professional activities and rentals,
income from corporate activities, interests and contributions to social
security, (pp 95).
Interest on fixed maturities, from savings accounts and loans, (pp.
97). CONEVAL
SHCP
The second step consists in calculating the annual amount of credit to be reimbursed to those female workers that accomplish the EITC requirements based on age, number of children and income.
In the third stage, once net income and the income tax to be paid are calculated, the amount of tax credit is estimated and the beneficiaries of the program identified.
There are two strong assumptions.
First, that there exists labour demand for women who want to work.
Second, it is assumed that the costs of participating in the labour force are zero, this is an strong assumption and is extensively discussed in (Eissa et al., 2008b).
If women is selected to work, the household labour income is the sum of workers wage and the amount of EITC received.
Table 9. Heckman selection model
Variable Natural logarithm of
annual wage per hour
Indicator person working
Schooling 0.109 0.003
(15.29)** -0.3
Experience -0.009
-0.61
Experience squared 0
-1.48
Indicator rural areas -0.265 0.146
(3.54)** -1.64
Age 0.2
(7.88)**
Age squared -0.003
(9.19)**
Annual labour income realized by other household members 0
-0.77
Other income recipients -0.605
(4.84)**
Widow -0.368
(2.86)**
Separated or divorced -0.117
-1.11
Children with disabilities 0.194
-1.2
Children from 0 to 2 years -0.345
-1.85
Children 3 to 5 years -0.105
-0.74
Children from 6 to 12 years 0.005
-0.06
Members with 65 years or more 0.058
-0.37
Number of household members 0.271
(4.50)**
Constant 2.01 -2.597
(9.72)** (4.83)**
Observations 2144 2144
t statistics in parentheses
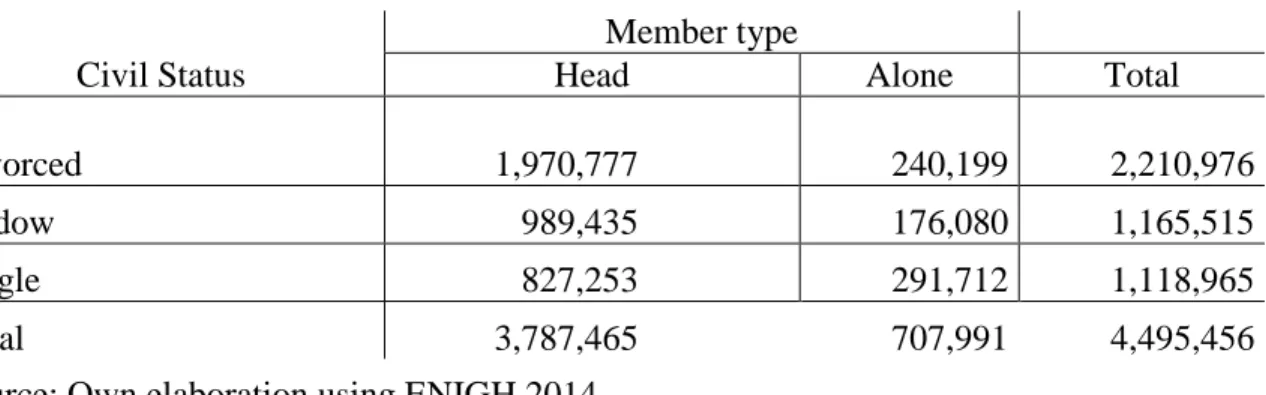
Table 8. Women alone, widow, single and divorce
Civil Status
Member type
Head Alone Total
Divorced 1,970,777 240,199 2,210,976
Widow 989,435 176,080 1,165,515
Single 827,253 291,712 1,118,965
Total 3,787,465 707,991 4,495,456
Source: Own elaboration using ENIGH 2014
This paper focus on single mothers, this means women in
working age that are single, widow or divorced and there is not a male partner in the household that provides income for them, and their low income made them eligible to be EICT
beneficiaries.
In the case of eligible women that do not work, the labour participation probability is used to select them, if it is higher than 0.5 the person is assumed to enter the labour
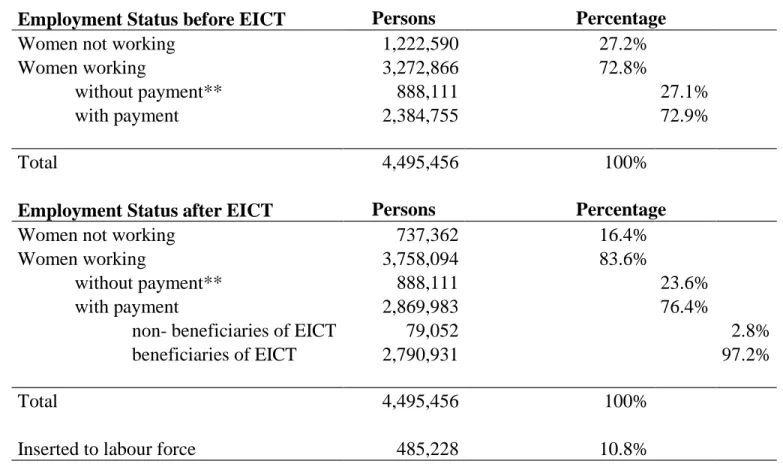
Table 10. Results of simulation for employment
6. Results
Employment Status before EICT Persons Percentage
Women not working 1,222,590 27.2%
Women working 3,272,866 72.8%
without payment** 888,111 27.1%
with payment 2,384,755 72.9%
Total 4,495,456 100%
Employment Status after EICT Persons Percentage
Women not working 737,362 16.4%
Women working 3,758,094 83.6%
without payment** 888,111 23.6%
with payment 2,869,983 76.4%
non- beneficiaries of EICT 79,052 2.8%
beneficiaries of EICT 2,790,931 97.2%
Total 4,495,456 100%
Inserted to labour force 485,228 10.8%
** There is a variety of cases of women who declare working and received
Finally, the net income of the family is calculated. This calculation is done for four simulations;
1) for the family non-receiving neither PROSPERA nor EITC, 2) receiving just PROSPERA,
3) receiving EITC and 4) receiving both.
The population of single mothers and women alone have a total poverty of 46.4%, PROSPERA would only decrease 1 percentage point their poverty, whereas EITC would decrease in 14.1 percentages points the poverty. And if both are combined poverty would decrease 15.1 percentage points.
6. Results
Table 11. Poverty measures with and without transfers
Income Poverty Measure Net Income calculation Food Capabilities Patrimony Without CCT nor EITC 16.3% 23.9% 46.4% With Prospera 14.5% 22.0% 45.4% With EITC 10.7% 16.1% 32.3% With Prospera and EITC 9.0% 14.6% 31.3%
EITC could be a better option for the government to tackle poverty than a then current cash transfer program Prospera, mainly for the following reasons:
Cost less than Prospera
Poverty reduction is faster and decrements are higher (14.1 percentages points).
It is more sustainable as is people acquire more skills while working, as well as social benefits because they work in the formal sector.
Workers contribute to tax and the pensions system, making it more sustainable.
May create sense of pride by being productive and actively participating in the country’s economy and diminishes stereotypes.