Analysis of the water balance under regional scenarios of climate change for
arid zones of Colombia
Jesús Efrén OSPINA-NOREÑA,a* Carlos Alberto DOMÍNGUEZ-RAMÍREZ,a Emel Enrique VEGA-RODRÍGUEZ,b Aquiles Enrique DARGHAN-CONTRERAS,a
and Luis Ernesto RODRÍGUEZ-MOLANOa
a Facultad de Ciencias Agrarias, Departamento de Agronomía, Universidad Nacional de Colombia, Carrera 30 núm.
45-03, Edificio 500, Bogotá D. C., Colombia
b Facultad de Ciencias, Universidad Nacional de Colombia, Carrera 30 núm. 45-03, Edificio 476, Bogotá D. C.,
Colombia
* Corresponding author; [email protected]
Received: October 9, 2016; accepted: December 7, 2016 RESUMEN
En este trabajo se analizan en detalle los parámetros implicados en el balance hídrico. Se consideran las condiciones actuales y el cambio climático en una zona representativa de clima árido en Colombia: la región desértica de Uribia en el departamento de La Guajira. Con este fin se seleccionaron algunas estaciones cli-matológicas que, de acuerdo con los valores registrados de temperatura y precipitación, pueden considerarse representativas de áreas climáticas áridas o desérticas según el índice de Lang (PCP/Tavg). Se construyó una línea de referencia a partir de los registros históricos de precipitación y temperatura y se analizó su comporta-miento. Los datos de las estaciones se obtuvieron de la base de datos del Instituto de Hidrología, Meteorología y Estudios Ambientales de Colombia. Después de calcular los escenarios de referencia, se estimó el balance hídrico actual tomando en cuenta las variables originales e incluyendo, cuando fue necesario, nuevos paráme-tros para el cálculo de la ecuación simplificada de continuidad. El análisis incluyó parámeparáme-tros como potencial de evapotranspiración, humedad del suelo, almacenamiento o recarga y sus cambios, déficit y exceso hídrico, escorrentía, periodos de recarga y uso del agua. Las anomalías de temperatura y precipitación se calcularon tomando en cuenta los nuevos escenarios climáticos “trayectorias representativas de concentración” para diferentes periodos (de corto y largo plazo). Con las anomalías encontradas se ajustó la línea de referencia para las variables mencionadas anteriormente, y los parámetros asociados se analizaron en el contexto del balance hídrico. En escenarios de cambio climático, el balance hídrico proyecta una posible intensificación de las condiciones desérticas en la región de Uribia-Guajira, ya que se espera una disminución en el índice de Lang de su valor actual de 18.7 (desértico) a 17 en 2050 y 14.5 en 2070, como resultado de una reducción de las precipitaciones (2.4 y 11%) y un incremento de la temperatura anual promedio de alrededor de 1.7 ºC con el modelo HadGEM2-ES para el periodo 2041-2060 y de 3.7 ºC con el modelo GFDL-CM3 para el periodo 2061-2080. Esto se comprueba mediante la clasificación climática de Thornthwaite, que tipifica el área de estudio como una zona árida con recursos hídricos limitados y sin excedentes. Este déficit podría acarrear graves consecuencias ambientales, problemas sociales y declinación de la productividad agrícola e industrial de la región.
ABSTRACT
This work discusses in detail the parameters involved in water balance. The analysis is performed by con-sidering the current conditions and climate change in a climatic zone that represents the arid regions of Co-lombia: The municipality of Uribia (desert) in the state of La Guajira. For this purpose, some climatological stations, which by their reported values of temperature and precipitation can be considered representative of the arid or desert climatic zones according to the Lang’s index (PCP/Tavg), were selected. Then, with
© 2017 Universidad Nacional Autónoma de México, Centro de Ciencias de la Atmósfera.
historical temperature and precipitation values registered at the station of the area, the baseline was built and its behavior analyzed. The station data were obtained from the database of the Instituto de Hidrología, Meteorología y Estudios Ambientales (Institute of Hidrology, Meteorology and Environmental Studies) of Colombia. After estimating the baseline scenarios, the current water balance on the site was calculated by taking into account the original variables and including new parameters, if necessary, for the calculation of the simplified continuity equation. The analysis included parameters such as potential and actual evapotrans-piration, moisture of soil, storage or recharge and their changes, water deficit and excess, runoff, periods of recharge, and water use. Anomalies in temperatures (ºC) and precipitation were calculated by taking into account the new climate scenarios “representative concentration pathways” for different periods (short- and long-term). With the anomalies identified, the baseline for the above-mentioned variables was adjusted. Again, the associated parameters were analyzed and discussed in the context of water balance. In climate change scenarios, the water balance projects a prospective exacerbation of desert conditions in the Uribia-Guajira region, since a decrease in the Lang’s index from its current value of 18.7 (desert) to 17.0 in 2050 and 14.5 in 2070 is expected, as a consequence of a decrease in precipitation (2.4 and 11.0%) and an increase in an-nual temperature of about 1.7 ºC with the HadGEM2-ES model for the period 2041-2060 and 3.7 ºC with the GFDL-CM3 model for the period 2061-2080. This can be verified by means of the Thornthwaite climate classification, which categorizes the area of study as an arid zone with limited and no excess of water. This deficit could lead to serious environmental consequences, social problems and a decline in the industrial and agricultural productivity of the zone.
Keywords: Cimate change, water balance, climatic scenarios, arid zones.
1. Introduction
According to the Intergovernmental Panel on Climate Change (IPCC, 2013), the increase of greenhouse gases in the atmosphere may have an influence on the mean global warming of the Earth’s surface within the range of 0.5 to 1.3 ºC during the period 1951-2010. Regarding the natural internal variability, it is expected that average annual and seasonal temperature increases will be higher in the tropics and subtropics than in the mid-latitudes. For the period 2081-2100, the average Earth’s temperature is expected to be in the ranges derived from the new climate change scenarios brought into consideration, that is, with increases of 0.3-1.7 ºC (RCP 2.6), 1.1-2.6 ºC (RCP 4.5), 1.4-3.1 ºC (RCP 6.0), and 2.6-4.8 ºC (RCP 8.5). Likewise, by the end of the century the average annual precipitation estimated for the RCP 8.5 scenario is expected to increase in high latitudes and in the equatorial Pacific Ocean, while it could decrease in many dry zones in mid-latitudes and subtropics. This scenario also suggests huge impacts in zones with climates similar to the study area. Arid and semi-arid regions in mid-latitudes and subtropics are likely to have less rain, hence, it is estimated that for each degree of global warming, approximately 7% of the global population will be exposed to a reduction of at least 20% in hydric resources (IPCC, 2013, 2014; Jiménez Cisneros et al., 2014).
This results in alterations of the hydrological cy-cle, such as increase or reinforcement of evaporation
due to higher temperatures, and an increase in ac-tual, global and regional evapotranspiration, which will be affected by variations in precipitation levels, spatiotemporal changes in rain distribution, values of daily temperature, aerosols concentration, alteration of net radiation, vapor pressure deficit, and wind speed (IPCC, 2007; Bates et al., 2008; Fu et al., 2009; McVicar et al., 2010; Miralles et al., 2011; Wang A. et al., 2011; Kundzewicz et al., 2007). These features could have a negative influence on the water sources.
as a consequence of compaction or other impacts resulting from urbanization, apart from disturbing the natural systems. Similarly, regarding freshwater systems, using land for agriculture in the future, in particular for irrigation, which represents almost 90% of the global demand of water, will severely impact its availability for domestic use and the proper func-tioning of ecosystems (Döll, 2009).
Groundwater systems change at a slower pace than water available in the surface. Studies regarding climate change to assess and analyze groundwater systems are limited, information is scarce and there is no access to the databases necessary for their study and analysis. Meanwhile, droughts affect agriculture in terms of quality and quantity, having a direct influ-ence on food security and sovereignty, water supply for the consumption of different productive sectors and others. Semi-arid and semi-humid regions around the world as Australia, the west of the USA, the south of Canada and the Sahel have suffered very long droughts —in some cases during many years with different intensities— but climate change can affect them, since it is expected that drought conditions increase by about 30% by the end of the century (Kundzewicz et al., 2007).
In Colombia, according to the Instituto de Hi-drología, Meteorología y Estudios Ambientales (Institute of Hidrology, Meteorology and Environ-mental Studies) (IDEAM, 2010), in the state of Guajira and some other regions of the Caribbean, there are areas where water is highly deficient, e.g., to the south of the Sierra Nevada de Santa Marta and in the sub-basins of the Magdalena and Cauca rivers, corresponding to the high parts of the basin; to the Savannah of Bogotá; to the Alto Cauca, and to the basin of the Chicamocha river. When a dry climatic condition occurs (average year), the water yield re-duces significantly as compared to normal conditions. In particular, a significant reduction is observed in the Caribbean, more specifically in the Guajira.
The natural supply (availability) of the hydric re-source in an average year and a dry year has regional differences that are important to discriminate. In the hydrographic area of the Caribbean, the reduction of the natural supply of this resource varies for these conditions between 46% in Atrato-Darién and 73% in Catatumbo. Within the same area, in the Urabá Antioqueño this difference is of 68%, in Sinú of 59%, and in the Guajira of 63% (IDEAM, 2010).
On the other hand, IDEAM (2015a) suggests that the main reductions in precipitations by the end of the century will occur in the states of San Andrés and Providencia, Magdalena, and Guajira. This report also estimates that in the average ensemble scenario, potential droughts may occur in the north of Cesar, Magdalena and Guajira by 2100. Furthermore, it is suggested that the probability of a shortage of food harvested in the region could increase. The hydric shortage could affect sectors such as agriculture, and in particular stockbreeding, as well as the energy and tourism sectors in the Caribbean (IDEAM, 2015a).
This study aims to determine the water balance under climate change scenarios (RCP 4.5 and RCP 8.5) in two periods of time (2041-2060 and 2061-2080), based on the validation and modeling of the climatic and hydrologic parameters that are distinc-tive of a region which represents extreme desert conditions in Colombia, in order to describe the impact of surface and groundwater availability on ecosystems, domestic use, and the productivity of the primary and industrial sectors.
2. Materials and methods
2.1 Description of the study area
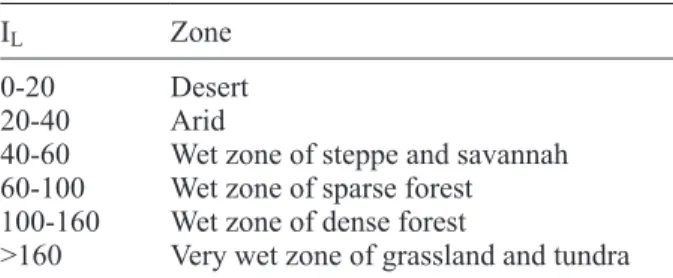
An area that represents the arid and desert condi-tions in Colombia was selected in order to analyze and assess the parameters involved in water balance and the effects of climate change in such region. The area selected corresponds to a desert zone initially classified according to the Lang’s index (IL) or the
ratio between annual precipitation (PCP) and average temperature (Tavg) (Table I), located in the
munici-pality of Uribia in the state of Guajira.
To describe the climate in the study area and elaborate its baseline, a climatological station was selected, which represented the zone and also had
Table I. Climatic zones according to Lang’s index (PCP/ Tavg).
IL Zone
0-20 Desert
20-40 Arid
40-60 Wet zone of steppe and savannah 60-100 Wet zone of sparse forest 100-160 Wet zone of dense forest
historical records with relevant variables, such as Tavg, maximum and minimum temperature (Tmax,
and Tmin, respectively), PCP, and evaporation (Ev),
among others. The baseline covers the period be-tween 1976 and 2005. The data were obtained from the IDEAM database.
2.2 Calculation of water balance parameters in normal conditions
Water balance is considered an essential tool to locate and establish crops, track their growth and development, and program and perform hydraulic infrastructure works (e.g., infrastructure for irrigation and drainage, program activities for management and irrigation, etc.). If, for example, water availability to perform agricultural activities in any location de-pends on precipitation and its resupply of moisture to the soil, the fluctuations between precipitation and evapotranspiration (which are essential components for water balance), will influence the availability of water for the crops.
In order to assess the parameters involved in water balance (other than the variables already analyzed), it is necessary to consider the potential evapotranspiration (ETo). To calculate ETo, the FAO Penman-Monteith method was taken into account (FAO, 209), which is the only method recommended to determine ETo with climatic parameters (Eq. 1).
ETo = 0.408∆ (Rn – G) + γ ∆ + γ (1 + 0.34U2)
U2 (es – ea)
900
T + 273 (1)
where ETo represents the baseline evapotranspiration (mm day–1), R
n the net radiation in the crop surface (MJ m–2 day–1), G the soil heat flow (MJ m–2 day–1),
T the air average temperature at a 2-m height (ºC), U2 the wind speed at a 2-m height (m s–1), es the saturation’s vapor pressure (kPa), ea the actual vapor pressure (kPa), es – ea the vapor pressure deficit (kPa), Δ the slope of the vapor pressure curve (kPa ºC–1),
and γ the psychrometric constant (kPa ºC–1).
The estimation was made with the help of the Cropwat 8.0 software, which requires location data, such as country, station, altitude, coordinates (longitude and latitude); it also requires climatic data such as maximum and minimum temperature, relative humidity, wind speed and insolation or hours of sunlight.
After obtaining the monthly value of PCP and ETo, other variables of the water balance were calculated. This consisted in defining the following parameters (in mm): the difference between precip-itation and evapotranspiration (PCP – ETo [Δ]); the reserve or storage of usable water R(Sto); the deficit, excess, and variation in the reserve or storage of us-able water (Def, Exc and ΔR [ΔSto], respectively); the actual evapotranspiration; the replacement (R); and the usage (U).
Hence, it was verified if ETo was higher or lower than PCP in the period considered (PCP – ETo = Δ). The difference or result classified the months as follows: dry months if (PCP – ETo < 0) and humid months if (PCP – ETo > 0). To define the R(Sto) of usable water, the following is taken into account: when more inputs than outputs are produced in a month, (PCP > ETo), surplus water will increase the soil reserve; on the contrary, if there are more outputs than inputs, the soil reserve will decrease.
At this point, it is important to emphasize that the reserve or storage of usable water in the soil is not uniform; it depends on the type and character-istics related to the different types of soil. In this particular case, taken as a climatic reference for the study area, the maximum capacity of reserve or storage of water (field capacity [FC]) is 100 mm. Thus, R can only have values between 0 (dry soil, without water available for plants) and 100 (optimal humidity content).
Initially, the month when the positive Δ period starts was identified, and a value of 100 was assigned to it. Some authors propose that a hypothetical value should be assigned to a month and annual calcula-tion cycles should be conducted until reaching the suggested hypothesis.
For calculation purposes, it is usually assumed that after a dry period the soil reserve is null (0). As a result, the calculation of R begins with the first humid month and the previous month receives a null (0) reserve. Then, next month’s R or Sto are calculated by adding the previous month’s R to PCP – ETo = Δ of the current month (Eq. 2)
Ri = Ri–1 + (PCPi – EToi) (2)
0, R is = 0 and the value (result) transfers to Def. The rules are based on Ri; in other words, Ri = Ri – 1
+
(PCPi– EToi) if 0 < Ri – 1 + (PCPi– EToi)<Rmax; Ri = Rmaxif Ri – 1 + (PCPi– EToi) > Rmax;and Ri = 0 if 0 > Ri – 1 + (PCPi – EToi). Later, the variation between the reserve and the storage of usable water (ΔR or Δ Sto) is calculated based on the result of the difference between the value of storage of usable water of the month considered and the last month. If the sign is positive, it means the replacement (R) of the soil moisture, and if the sign is negative, it means the utilization (U) of the soil moisture (ΔRi = Ri – Ri – 1).
Finally, ETa is determined. The following cases can occur each month: If PCP ≥ ETo, then ETa = ETo; and if PCP < ETo, then ETa = PCP + | Δ Sto |. The coefficient ETa/ETo determines the growth pe-riods, considering that the months with ETa/ETo ≥ 0.60 are appropriate to develop crops, although it is necessary to estimate each coefficient for every crop and phenological stage.
2.3 Climate classification by the Thornthwaite method
After conducting the water balance, climate classifi-cation was performed according to the Thornthwaite method as follows.
2.3.1 Moisture index
According to Thornthwaite, the humidity or aridity of a climate can be expressed in terms of the water excess index (Ih) and the aridity index (Ia), for which
the following equations are used:
Ih = (Exc/ETo)•100 (3)
Ia = (Def/ETo)•100 (4)
Since the excess or lack of water generally occur in different seasons or periods, both should have a moisture index (Im), positively affecting the first one and negatively the second one, like this:
Im = Ih – Ia = (100•Exc – 100•Def)/ETo (5)
Positive values of Im correspond to humid cli-mates, while negative values of Imdetermine dry climates; the ranges and classification of types of climates in accordance with Im values are presented in annex A1.
2.3.2 Seasonal variation of the effective humidity The moisture index can indicate how humid or arid a region is, but it cannot differentiate the seasonal variations; therefore, in humid climates (Im > 0) it could be necessary to determine whether there are dry seasons and assess the drought degree, while in dry climates (Im < 0) it could be necessary to deter-mine whether there are humid seasons and assess the humidity degree. Annex A2 presents the subdivisions for humid climates (A, B, C2) and dry climates (C1,
D, E).
2.3.3 Index of thermal efficiency
The potential evapotranspiration is a thermal efficien-cy index, and it can be considered as a climate factor that involves the day length and temperature. This index enables the differentiation between mesother-mal and megathermesother-mal climatic zones. Classifications based on this index are comparable to those derived from the moisture index; thus, they are designated by similar symbols (see annex A3).
2.3.4 Thermal efficiency concentration during the summertime
In equatorial zones, where the day length is approxi-mately the same during the whole year and tempera-ture is also uniform (thermal fluctuations are small),
the ETo seasonal variation will be slight; similarly,
ETo corresponding to any three consecutive months will be approximately 25% of the annual ETo.
The thermal efficiency concentration can be cal-culated using the next equation:
EC = (ETov/ETo)*100 (6)
where EC is the thermal efficiency concentration during summer, ETovthe evapotranspiration of the three summer months, and ETo the annual evapo-transpiration. Annex A4 shows the different thermal floors according to the thermal efficiency concentra-tion in summer.
2.4 Calculation of the water balance parameters in climate change conditions
respectively. These scenarios and periods were select-ed because the first results of a preliminary assessment of Lang’s index suggested an optimistic scenario, while the second results implied a pessimistic scenario for the region. The projected anomalies were retrieved from the scenarios provided by WorldClim Global Climate Data with a 2.5 min latitude and longitude resolution equivalent to about 4.5 × 4.5 km, which are available at http://www.worldclim.org/cmip5_2.5m. Afterwards, a reassessment of other variables and parameters involved in water balance and the classi-fication by the Thornthwaite method was conducted.
3. Analysis and results
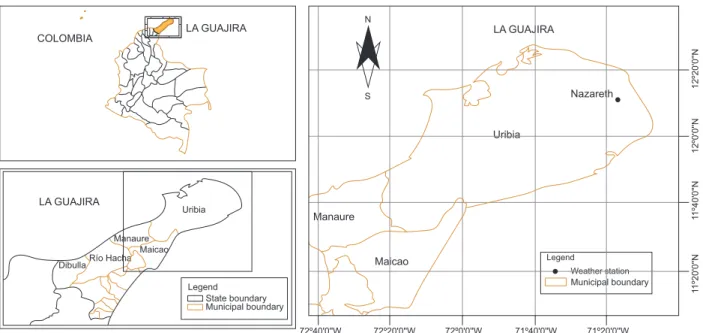
The station selected was Nazareth, located at 72º 15'57'' W, 11º 42' 50'' N in the state of Guajira (Fig. 1). Studies in this zone are critical, since the potential effects of climate change could certainly exacerbate the already deficient conditions, threatening the natural supply of water, its accessibility and all the activities that depend on this resource, increasing the gap between the natural supply and the constantly growing demand for the resource. This would in-crease the index of pressure over the resource and encourage or lead to conflicts.
As mentioned above, the IL for the area selected
was IL = 510.2/27.3 = 18.7, which classifies it as a
desert zone according to Lang’s climatic zones clas-sification (see Table I).
Analysis of the values collected at the station en-abled us to determine why the study area has a Tmax,
Tavg and Tmin of 32.5, 27.3 and 22.0 ºC, respectively
(Fig. 2a). Even though PCP is scarce (about 510.2 mm), evaporation and evapotranspiration are higher than 2044.5 and 1521.1 mm, respectively (Fig. 2b) (the latter figure accounts for extreme desert conditions).
Figure 2 shows the monthly behavior of the temperature, precipitation and evaporation variables analyzed in the station. It exhibits the current monthly values (baseline) of the main variables.
As mentioned above and can be observed in Fig. 2 and Table II, extreme conditions exist in all the variables in the state of Guajira, which has direct influence on arid conditions, access to water and other parameters and variables related to the hydric resource and, certainly, on the activities and sectors that depend on it (particularly the primary sector, i.e., agriculture, livestock, forestry).
In Figure 2b it is evident that in the municipality of Uribia evaporation basically exceeds by far the values of precipitation all year round.
Table III shows the results of applying the ex-plained procedure to calculate water balance in the study area.
It is worth noting that in the study area precipita-tion is scarce and ETo has a high rate that leads to a humidity deficit of 1010.9 mm, which comprehends the period between January and September, without
COLOMBIA LA GUAJIRA LA GUAJIRA
Nazareth
Uribia
Manaure
Maicao
S N
LA GUAJIRA
Uribia
Legend
Legend
Weather station
State boundary
72º40'0''W 72º20'0''W 71º40'0''W 71º20'0''W
11º20'0''N
12º20'0''N
11º40'0''N
12º0'0''N
72º0'0''W Municipal boundary
Municipal boundary Manaure
Maicao Río Hacha Dibulla
excess. There is only a water replacement rate of 20.7 mm and 28.5 mm in October and November, respectively; 43.1 mm are used in December and 6.0 mm in January. According to the ETa/ETo values presented in Table III, only the period from
October to December would be appropriate for the development of some crops. These aspects confirm the results of the comparison between PCP, Ev and ETo (Figs. 2b and 3) and to the observations made using IL.
20 22 24 26 28 30 32 34
Tmax Tmin Tavg
Month
a
0 50 100 150 200
PCP Ev
Water layer (mm)
b
Temperature (°C)
Januar y
Februar y
March Apri l
May June JulyAugust
SeptemberOctoberNovemberDecember
Month
Januar y
FebruaryMarc h
April May June JulyAugust
SeptemberOctoberNovemberDecember
Fig. 2. (a) Monthly behavior of temperature at Uribia-Guajira. (b) Monthly behavior of precipitation and evaporation at Uribia-Guajira.
Table II. Monthly values baseline (January [J] to December [D])
V/month J F M A M Jn Ju A S O N D Sum/avg
Tmax (ºC) 29.7 30.7 31.3 32.8 32.7 33.3 33.5 34.2 34.4 33.6 31.9 31.3 32.5 Tmin (ºC) 21.1 21.2 20.8 22.4 22.7 23.3 23.4 21.9 22.8 21.9 21.6 20.6 22.0 Tavg (ºC) 25.8 26.0 26.5 27.0 27.6 28.0 28.0 28.4 28.6 28.1 27.3 26.2 27.3 PCP (mm) 18.7 9.1 9.7 22.1 37.2 13.3 7.0 13.1 44.3 146.2 134.8 54.7 510.2 RH (%) 81.5 80.6 80.7 80.8 81.0 80.1 80.1 80.1 80.9 83.2 84.1 82.9 81.3
Ev (mm) 113 155 182 173 193 212 214 221 206 155 121 102 2044.5
V: variable.
Table III. Current water balance at the Nazareth station (January [J] to December [D]).
V/month J F M A M Jn Ju A S O N D Total
PCP 18.7 9.1 9.7 22.1 37.2 13.3 7.0 13.1 44,3 146.2 134.8 54.7 510.2
ET0 105.5 111.5 131.8 122.4 131.4 140.5 151.3 155.0 142.2 125.5 106.3 97.9 1521.1 Δ –86.8 –102.4 –122.1 –100.3 –94.2 –127.2 –144.3 –141.9 –97.8 20.7 28.5 –43.1
R Sto 0.0 0.0 0.0 0.0 0.0 0.0 0.0 0.0 0.0 20.7 49.2 6.0
Def 80.7 102.4 122.1 100.3 94.2 127.2 144.3 141.9 97.8 0.0 0.0 0.0 1010.9
Exc 0.0 0.0 0.0 0.0 0.0 0.0 0.0 0.0 0.0 0.0 0.0 0.0 0.0
Δ Sto –6.0 0.0 0.0 0.0 0.0 0.0 0.0 0.0 0,0 20.7 28.5 –43.1
ETa 24.7 9.1 9.7 22.1 37.2 13.3 7.0 13.1 44,3 125.5 106.3 97.9 510.2
ETa/ET0 0.2 0.1 0.1 0.2 0.3 0.1 0.05 0.1 0,3 1.0 1.0 1.0
R or U U R R U
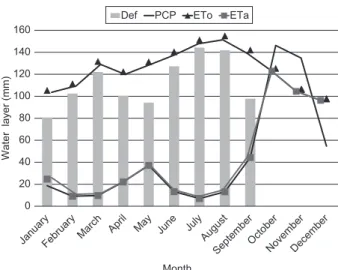
Figure 3 shows the behavior of PCP, ETo, ETa, Def and Excx of water in the study area, as a result of water balance analysis under the current climatic conditions.
In Figure 3, the area between the ETo and Eta lines means a deficit. PCP above ETa corresponds to the storage in reserve plus excess; ETa over PCP means a utilization of the soil reserve.
A climate classification by the Thornthwaite method was conducted, taking into account the results in Table III, Eqs. (3-6) and annexes A1 to A4, which demonstrated that under current condi-tions, the study area classifies as an arid zone with limited or no excess of water, megathermal, and with a low concentration of thermal efficiency. Its symbolic description would be EdA’a’ (see annexes A1 to A4), supporting the condition initially found when using IL.
Table IV shows the values obtained for the indexes related to climate classification by the Thornthwaite method.
All the factors so far analyzed are of great impor-tance, as already mentioned, when planning hydraulic infrastructure works, sowings and growing activities
of any type of crops. Likewise, they allow leading activities such as management of hydrographic basins, irrigation programs, production forecast, climate classification, crops zoning, among others.
3.1 Calculation of the water balance parameters under climate change conditions
The baseline of the main variables involved in the calculation of water balance was adjusted with the anomalies projected in the study area through the HadGEM2-ES and GFDL-CM3 models, RCP 4.5 and RCP 8.5 scenarios, for the periods 2041-2060 (focused on 2050) and 2061-2080 (focused on 2070), respectively.
Table V shows the adjusted baselines, namely future scenarios for Tmax, Tavg, Tmin, PCP and RH.
These scenarios suggest an annual reduction of 2.4% in precipitation within the study area for the HadGEM2-ES model (RCP 4.5, period 2041-2060), and 11.0% for the GFDL-CM3 model (RCP 8.5, period 2061-2080), moving from 510.2 to 498.2 and 510.2 to 454.2 mm, respectively. RH presents chang-es on a monthly basis, as Table V shows, reducing the annual average by 8.0% with the HadGEM2-ES model for the first period, moving from 81.3 to 73.3% in the second period with the GFDL-CM3 model. The average annual relative humidity reaches a value of 65.5%, indicating a reduction of about 15.8% in comparison with the current situation.
Regarding the average annual temperature, an increase of 1.7 ºC with the HadGEM2-ES model is projected in the study area for the period 2041-2060 (RCP 4.5), and of 3.7 ºC with the GFDL-CM3 model for the period 2061-2080 (RCP 8.5). In this regard, IDEAM (2015b) presents results for the average ensemble scenario, where it is suggested that by the end of the century temperature in the state of Gua-jira could increase 2.3 ºC on average compared to current values. IDEAM considers that the Alta and Media Guajira could have the highest increases, of approximately 2.5ºC, covering the municipalities of Uribia, Manaure and Maicao.
In terms of precipitation, the state of Guajira could have reductions of up to 20% on average by the end of the century. In particular, to the south of the state and in the municipalities of Rioacha and Dibulla the reductions could vary from 30 to 40% in relation to the current value (IDEAM, 2015b). Similarly, IDE-AM warns that for the periods 2011-2040, 2041-2070 0
20 40 60 80 100 120 140
160 Def PCP ETo ETa
Water
layer (mm
)
Month
Januar y
Februar y
Marc h
April May June JulyAugust
SeptemberOctoberNovemberDecember
Fig. 3. Current water balance, municipality of Uribia- Guajira.
Table IV. Indexes for climate classification.
Index Value Index Value
and 2071-2100, increases in temperature could be of 0.9, 1.6 and 2.3 ºC, and decreases in precipitation could be of about 14.5, 16.57 and 20.02%, respec-tively (IDEAM, 2015b). At this point, it is worth mentioning that even though a reduction in precipi-tation is relatively trivial, the increase in temperature reaches substantial values, which could significantly impact and transform the region, especially because currently precipitation in the study area is rare and temperature is very high.
Lang’s index shows a reduction from the current 18.7 to 17.0 in the HadGEM2-ES model for the period 2041-2060 (RCP 4.5), and to 14.5 with the changes projected in the GFDL-CM3 model for the period 2061-2080 (RCP 8.5). This suggests that, according to the projections found, current conditions in the study area will be exacerbated, which will change its classification to a desert zone as times goes by (Tables I and V).
Furthermore, the future climate classification by the Thornthwaite method, as well as by IL, show
that the study area is still an arid zone, with limited
or no excess of water, megathermal and with a low concentration of thermal efficiency (EdA’a’), ac-cording to the changes projected by the two models, but conditions become more deficient over time (see Tables IV and VI).
Table VI shows the values obtained for future indexes related to climate classification using the Thornthwaite method, taking into account the changes projected for the HadGEM2-ES model, pe-riod 2041-2060 (RCP 4.5), and GFDL-CM3, pepe-riod 2061-2080 (RCP 8.5).
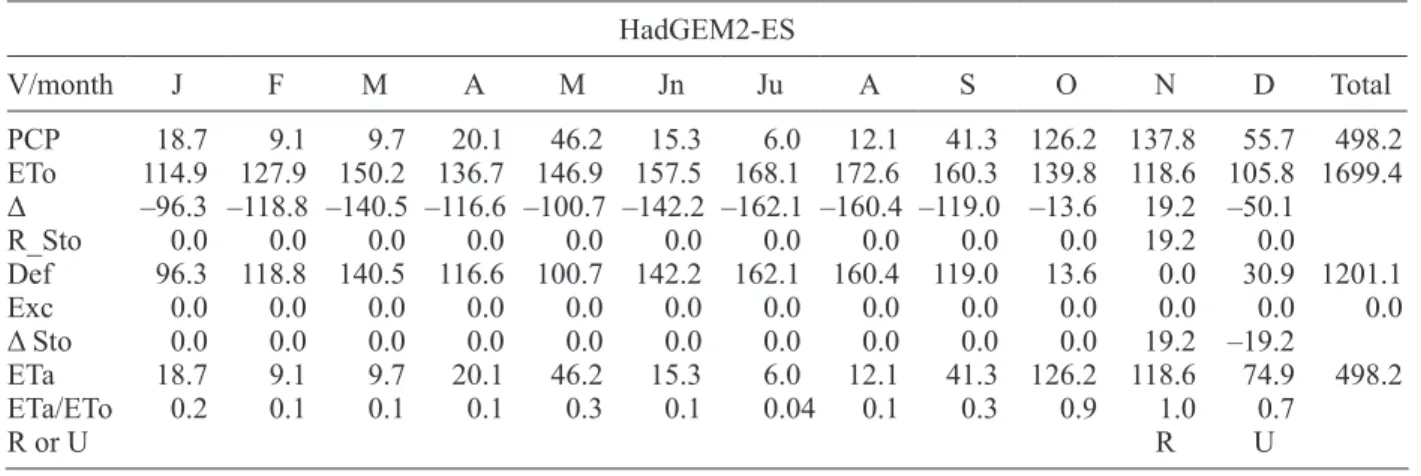
Tables VII and VIII present the water balance re-sults for the periods analyzed, considering changes in the climatic variables projected for the HadGEM2-ES and GFDL-CM3 models.
When comparing the results from tables III, VII and VIII, it is evident that expected climatic changes exacerbate the deficient conditions in the study area, considerably increasing ETo and Def as time goes by. This is why ETo varies from 1521.1 to 1699.4 mm with the changes projected by the
Had-Table V. Future climatic scenarios (Nazareth station, January [J] to December [D]). HadGEM2-ES, RCP4.5, focused on 2050
V/month J F M A M Jn Ju A S O N D Sum/avg
PCP 18.7 9.1 9.7 20.1 46.2 15.3 6.0 12.1 41.3 126.2 137.8 55.7 498.2 Tmax 31.5 32.7 33.2 34.5 34.3 35.0 35.2 35.9 36.3 35.4 33.7 33.1 34.2 Tmin 23.0 23.3 22.7 24.2 24.4 25.1 25.2 23.7 24.6 23.8 23.6 22.5 23.8 Tavg 27.3 28.0 27.9 29.4 29.3 30.0 30.2 29.8 30.5 29.6 28.6 27.8 29.0 RH 73.2 71.6 72.3 73.1 73.8 72.6 72.5 72.6 72.8 74.9 75.5 74.5 73.3
GFDL-CM3, RCP8.5, focused on 2070
V/month J F M A M Jn Ju A S O N D Sum/avg
PCP 19.7 10.1 10.7 25.1 48.2 30.3 9.0 11.1 28.3 100.2 106.8 54.7 454.2 Tmax 33.4 34.5 34.9 36.3 36.4 37.0 37.0 38.2 38.7 37.7 35.8 35.0 36.2 Tmin 24.9 25.0 24.5 26.1 26.6 27.3 27.1 25.9 26.9 25.6 25.3 24.4 25.8 Tavg 29.2 29.8 29.7 31.2 31.5 32.1 32.0 32.1 32.8 31.7 30.5 29.7 31.0 RH 65.6 64.7 65.4 65.9 65.4 64.5 65.4 63.9 63.8 66.5 67.5 66.9 65.5
Table VI. Indexes and future climate classification.
HadGEM2-ES, RCP4.5, focused on 2050 GFDL-CM3, RCP8.5, focused on 2070
Index Value Classification Index Value Classification
Ih = (Exc/ETo)•100 0.0
EdA’a’
Ih = (Exc/ETo)•100 0.0
EdA’a’
Ia= (Def/ETo)•100 70.7 Ia= (Def/ETo)•100 77.7
Im = Ih-Ia –70.7 Im = Ih-Ia –77.7
GEM2-ES model for the year in focus 2050, and to 1888.8 mm with the GFDL-CM3 model for the year in focus 2070, which represents an increase of 11.7 and 24.2%, respectively. Likewise, Def increases by 18.8% in the first analysis period and by 41.9% in the second period, while PCP satisfies part of the ETo, becoming ETa, with a reduction of 2.4% and 11.0% in the HadGEM2-ES and GFDL-CM3 models for the first and second analysis periods, respectively.
Under the models, periods and scenarios analyzed, it can be observed that with the estimated changes in the HadGEM2-ES model (RCP 4.5, year in focus 2050), only during November there is soil moisture replacement equivalent to 19.2 mm (which is used in December), while with the estimated changes in the GFDL-CM3 model (RCP8.5, year in focus 2070), there are no months in which water in the soil is replaced. In accordance with the ETa/ET0values shown in Tables VII and VIII, in the first period of
analysis only October, November and December would be appropriate to develop some crops that do not require much water. Finally, with the GFDL-CM3 model (2070), the appropriate months would be only October and November.
Table IX summarizes the annual changes expected for the scenarios analyzed.
Figures 4 and 5 illustrate the behavior of monthly PCP, ET0, ETa and Def within the study areas result-ing from the analysis of water balance under climate change conditions.
According to the results found, provisional crops such as corn, sorghum, cotton, melon, watermelon, and squash; permanent crops such as avocado, ba-nana, lemon, orange, coconut, lulo, mango, among others, reported in the study area by the Red de Información y Comunicación del Sector Agropec-uario Colombiano (Information and Communication Network of the Colombian Agro-livestock Sector,
Table VII. Water balance, RCP 4.5, focused on 2050 (Nazareth station, January [J] to December [D]). HadGEM2-ES
V/month J F M A M Jn Ju A S O N D Total
PCP 18.7 9.1 9.7 20.1 46.2 15.3 6.0 12.1 41.3 126.2 137.8 55.7 498.2
ETo 114.9 127.9 150.2 136.7 146.9 157.5 168.1 172.6 160.3 139.8 118.6 105.8 1699.4 Δ –96.3 –118.8 –140.5 –116.6 –100.7 –142.2 –162.1 –160.4 –119.0 –13.6 19.2 –50.1
R_Sto 0.0 0.0 0.0 0.0 0.0 0.0 0.0 0.0 0.0 0.0 19.2 0.0
Def 96.3 118.8 140.5 116.6 100.7 142.2 162.1 160.4 119.0 13.6 0.0 30.9 1201.1
Exc 0.0 0.0 0.0 0.0 0.0 0.0 0.0 0.0 0.0 0.0 0.0 0.0 0.0
Δ Sto 0.0 0.0 0.0 0.0 0.0 0.0 0.0 0.0 0.0 0.0 19.2 –19.2
ETa 18.7 9.1 9.7 20.1 46.2 15.3 6.0 12.1 41.3 126.2 118.6 74.9 498.2
ETa/ETo 0.2 0.1 0.1 0.1 0.3 0.1 0.04 0.1 0.3 0.9 1.0 0.7
R or U R U
Table VIII. Water balance, RCP 8.5, focused on 2070 (Nazareth station, January [J] to December [D]). GFDL-CM3
V/month J F M A M Jn Ju A S O N D Total
PCP 19.7 10.1 10.7 25.1 48.2 30.3 9.0 11.1 28.3 100.2 106.8 54.7 454.2
ETo 123.9 141.4 166.0 150.4 166.4 177.4 185.2 194.6 182.3 156.5 131.3 113.4 1888.8 Δ –104.2 –131.3 –155.3 –125.3 –118.2 –147.2 –176.2 –183.5 –153.9 –56.3 –24.5 –58.7
R_Sto 0.0 0.0 0.0 0.0 0.0 0.0 0.0 0.0 0.0 0.0 0.0 0.0
Def 104.2 131.3 155.3 125.3 118.2 147.2 1762 183.5 153.9 56.3 24.5 58.7 1434.6
Exc 0.0 0.0 0.0 0.0 0.0 0.0 0.0 0.0 0.0 0.0 0.0 0.0 0.0
Δ Sto 0.0 0.0 0.0 0.0 0.0 0.0 0.0 0.0 0.0 0.0 0.0 0.0
ETa 19.7 10.1 10.7 25.1 48.2 30.3 9.0 11.1 28.3 100.2 106.8 54.7 454.2
ETa/ETo 0.2 0.1 0.1 0.2 0.3 0.2 0.05 0.1 0.2 0.6 0.8 0.5
AGRONET), could be adversely affected by the decrease in precipitation and moisture of soil, and the increase in temperature and ETo.
Moreover, the production, performance and qual-ity of the products cultivated using irrigation systems (e.g., rice) will be affected by the increasingly defi-cient conditions of the municipality, unless some ad-justments are made to the existing irrigation systems, planning of products and the prospect sowing area; even a conversion of products should be considered. Also, progress should be made in investigations concerning the analysis of the viability of rainwater harvesting for those purposes.
IDEAM (2015b) suggests the main effects could be felt by the agricultural and livestock sectors, as well as by subsistence crops, due to the significant increases in temperature throughout the century and to the projected reductions in precipitations. The reduction in the natural supply of water could con-tinue to be one of the main effects on the study area, affecting the health sector due to nutritional factors related to food security.
4. Conclusions and recommendations
The increasingly negative changes projected will exacerbate the extreme arid conditions of Uribia and its surroundings, which certainly will significantly transform the flora and fauna components in their current natural ecosystems. This, in turn, will hinder the assessment of future vulnerability and negative impacts of expected climate changes, preventing the design and performance of efficient adaptation proposals.
The access to surface and ground freshwater for different productive uses and consumption (domestic, industrial, agricultural and for other productive sec-tors) will indeed be affected, causing and increasing substantial economic and social impacts, that could encourage or lead to serious conflicts over the use of water.
The high rates of ETo and the reduction in pre-cipitation and soil moisture can restrict agricultural
Table IX. Changes expected in the water balance.
V Current
(mm) HadGEM2-ES, focused on 2050 GFDL-CM3, focused on 2070RCP_4.5 % change RCP_8.5 % change
PCP 510.2 498.2 –2.4 454.2 –11.0
ETo 1521.1 1699.4 11.7 1888.8 24.2
Def 1010.9 1201.1 18.8 1434.6 41.9
Exc 0 0 0.0 0.0 0.0
ETa 510.2 498.2 –2.4 454.2 –11.0
0 20 40 60 80 100 120 140 160
180 Def PCP ETo ETa
Water layer (mm)
Month
Januar y
Februar y
Marc h
April May June JulyAugust
SeptemberOctoberNovemberDecember
Fig. 4. Water balance, Nazareth-Guajira station (Had-GEM2-ES, RCP4.5, year in focus 2050).
Fig. 5. Water balance, Nazareth-Guajira station (GF-DL-CM3, RCP8.5, year in focus 2070).
0 20 40 60 80 100 120 140 160 180
200 Def PCP ETo ETa
Water
layer (mm
)
Month
Januar y
Februar y
March Apri l
May June JulyAugust
activities, specially irrigated crops, resulting in the crops low or null performance and quality. Likewise, the aquifer recharge and water quality thereof may be negatively affected, since the infiltration rates would be null.
When comparing the baseline vs. future scenarios, climate classifications do not present changes, since the moisture index values vary within the warmer and drier class, precluding the isolation of significant changes in the classification results. However, it is clear that for each scenario the moisture index (Im)
decreases, enhancing the class characteristics. It is recommended to conduct research proposals and to create rainwater harvest projects, as well as employing water-efficient cultivation systems in the re-gion, in accordance with the new climate classification or to enhance its climatic characteristics, in order to implement strategies towards the adaptation to climate change and to tackle the potential negative impacts on the sectors and activities that could result affected.
Provided that irrigation systems work efficiently and can supply the current water demand for crops, ad-ditional water and the adjustments required to cover at least the projected deficit growth (equivalent to about 18.8% for the year in focus 2050 [HadGEM2-ES], and 41.9% for the year in focus 2070 [GFDL-CM3]) should be considered for their future functioning.
Different models were used for two periods, since they were selected from a range of future scenarios for the years 2050 and 2070. The HadGEM2-ES model proved to be the most optimistic for the study region with an RCP of 4.5 by 2050, while the GFDL-CM3 model, with an RCP of 8.5 by 2070, represented the most pessimistic condition. In other words, the study presents the most and least adverse situations, according to the different scenarios studied.
Acknowledgments
Authors would like to thank the Programa Nacional de Proyectos para el Fortalecimiento de la Investi-gación, la Creación y la Innovación en Posgrados de la Universidad de Colombia 2013-2015, for the financial support provided for the investigation de-velopment and the human talent training.
References
Almorox J., 2003. Climatología aplicada al medio am-biente y agricultura. Escuela Técnica Superior de Ingenieros Agrónomos, Madrid, 201 pp.
Bates B. C., Z. W. Kundzewicz, S. Wu and J. P. Palutikof (Eds.), 2008. Climate change and Water. Technical paper. Intergovernmental Panel on Climate Change, Geneva, 210 pp.
Döll P., 2009. Vulnerability to the impact of climate change on renewable groundwater resources: a glob-al-scale assessment. Environ. Res. Lett. 4, 035006, doi:10.1088/1748-9326/4/3/035006.
FAO, 2009. Evapotranspiración del cultivo. Guías para la determinación de los requerimientos de agua de los cultivos. Organización de las Naciones Unidas para la Agricultura y la Alimentación, Roma, 322 pp. Fu G., S. P. Charles and J. Yu, 2009. A critical overview of
pan evaporation trends over the last 50 years. Climatic Change 97, 193-214, doi:10.1007/s10584-009-9579-1. IDEAM, 2010. Estudio nacional del agua 2010. Instituto
de Hidrología, Meteorología y Estudios Ambientales. Bogotá, 421 pp.
IDEAM, PNUD, MADS, DNP, CANCILLERÍA, 2015a. Nuevos escenarios de cambio climático para Co-lombia 2011-2100. Herramientas científicas para la toma de decisiones, nivel nacional-regional. Tercera comunicación nacional de cambio climático. Bogotá, 15 pp.
IDEAM, PNUD, MADS, DNP, CANCILLERÍA, 2015b. Nuevos escenarios de cambio climático para Colombia 2011-2100. Herramientas científicas para la toma de decisiones. Tercera comunicación nacional de cambio climático. Bogotá, 60 pp.
IPCC, 2007. Cambio climático 2007. Informe de síntesis. Contribución de los grupos de trabajo I, II y III al Cuarto Informe de Evaluación del Grupo Intergu-bernamental de Expertos sobre el Cambio Climático. Ginebra, 104 pp.
IPCC, 2013. Cambio climático 2013. Bases físicas. Resu-men para responsables de políticas. Contribución del Grupo de Trabajo I al Quinto Informe de Evaluación del Grupo Intergubernamental de Expertos sobre el Cambio Climático. Ginebra, 34 pp.
Jiménez Cisneros B. E., T. Oki, N. W. Arnell, G. Benito, J. G. Cogley, P. Döll, T. Jiang and S. S. Mwakalila, 2014. Freshwater resources. In: Climate change 2014. Im-pacts, adaptation, and vulnerability. Part A: Global and sectorial aspects. Contribution of Working Group II to the Fifth Assessment Report of the Intergovernmental Panel on Climate Change (C.B. Field, V. R. Barros, D. J. Dokken, K. J. Mach, M. D. Mastrandrea, T. E. Bilir, M. Chatterjee, K. L. Ebi, Y. O. Estrada, R. C. Genova, B. Girma, E. S. Kissel, A. N. Levy, S. Mac-Cracken, P. R. Mastrandrea and L. L. White, Eds.). Cambridge University Press, pp. 229-269.
Kundzewicz Z. W., L. J. Mata, N. W. Arnell, P. Döll, P. Kabat, B. Jiménez, K. A. Miller, T. Oki, Z. Sen and I. A. Shiklomanov, 2007. Freshwater resources and their management. In: Climate change 2007. Impacts, adaptation, and vulnerability. Contribution of Work-ing Group II to the Fourth Assessment Report of the Intergovernmental Panel on Climate Change (M. L. Parry, O. F. Canziani, J. P. Palutikof, P. J. van der Lin-den and C. E. Hanson, Eds.). Cambridge University Press, pp. 173-210.
McVicar T. R., T. G. Van Niel, M. L. Roderick, L. T. Li, X. G. Mo, N. E. Zimmermann and D. R. Schmatz, 2010. Observational evidence from two mountainous regions that near-surface wind speeds are declining more rapidly at higher elevations than lower eleva-tions: 1960-2006. Geophys. Res. Lett. 37, L06402, doi:10.1029/2009GL042255.
Miralles D. G., T. R. H. Holmes, R. A. M. de Jeu, J. H. Gash, A. G. C. A. Meesters and A. J. Dolman, 2011. Global land-surface evaporation estimated from sat-ellite-based observations. Hydrol. Earth Syst. Sci. 15, 453-469, doi:10.5194/hess-15-453-2011.
Van Vuuren D. P., K. Riahi, R. Moss, J. Edmonds, A. Thomson, N. Nakicenovic, T. Kram, F. Berkhout, R. Swart, A. Janetos, S. K. Rose and N. Arnell, 2012. A proposal for a new scenario framework to support research and assessment in different climate research communities. Global Environ. Chang. 22, 21-35, http:// dx.doi.org/10.1016/j.gloenvcha.2011.08.002.
A1. Moisture index (Im)
Humid climates (Im > 0) Dry climates (Im < 0)
Value Symbol Denomination Value Symbol Denomination
Im > 100 A Perhumid (0 ≥ Im > –33,3) C1 Dry subhumid 100 ≥ Im > 80 B4 Very humid (–33,3 ≥ Im > –60) D Semiarid 80 ≥ Im > 60 B3 Humid (–100 ≥ Im > –60) E Arid 60 ≥ Im > 40 B2 Moderately humid
40 ≥ Im > 20 B1 Slightly humid 20 ≥ Im > 0 C2 Moist subhumid
A2. Seasonal variation of the effective humidity
Indexes of excess of humidity (Ih) for C1, D and E Indexes of aridity (Ia) for A, B and C2 climates
Range Symbol Denomination Range Symbol Denomination
0 < Ia < 10 d Limited or no excess
of water 0 < Ia < 16.7 r Little or no lack ofwater 10 < Ia < 20 s Moderate excess of
water in winter 16.7 < Ia < 33.3 s Moderate lack of water in summer 10 < Ia < 20 w Moderate excess of
water in summer 16.7 < Ia < 33.3 w Moderate lack of water in winter Ia > 20 s2 Large excess of
water in winter Ia > 33.3 s2 Considerable lack of water in summer Ia > 20 w2 Large excess of
water in summer Ia > 33.3 w2 Considerable lack of water in winter
A3. Index of thermal efficiency
ETo Range (mm) Acronym Climatic type ETo Range (mm) Acronym Climatic type ETo > 1140 A’ Megathermal 427 < ETo ≤ 570 C’2 Second mesothermal 997 < ETo ≤ 1140 B’4 Fourth mesothermal 285 < ETo ≤ 427 C’1 First mesothermal 885 < ETo ≤ 997 B’3 Third mesothermal 142 < ETo ≤ 285 D’ Tundra 712 < ETo ≤ 885 B’2 Second mesothermal ETo < 142 E’ Glacial 570 < ETo ≤ 712 B’1 First mesothermal
A4. Thermal efficiency concentration in summer EC (%) Acronym Climatic type
(concentration) EC (%) Acronym Climatic type(concentration)
EC < 48 a’ Low 68 > EC ≥ 61.6 b’1 Moderate
51.9 > EC ≥ 48 b’4 Moderate 76.3 > EC ≥ 68.0 c’2 High 56.3 > EC ≥ 51.9 b’3 Moderate 88 > EC ≥ 76.3 c’1 High
61.6 > EC ≥ 56.3 b’2 Moderate EC > 88 d’ Very high
![Table II. Monthly values baseline (January [J] to December [D])](https://thumb-us.123doks.com/thumbv2/123dok_es/5844286.149015/7.850.89.785.123.392/table-ii-monthly-values-baseline-january-j-december.webp)
![Table V. Future climatic scenarios (Nazareth station, January [J] to December [D]). HadGEM2-ES, RCP4.5, focused on 2050 V/month J F M A M Jn Ju A S O N D Sum/avg PCP 18.7 9.1 9.7 20.1 46.2 15.3 6.0 12.1 41.3 126.2 137.8 55.7 498.2 T max 31.5 32.7 33.2 34.](https://thumb-us.123doks.com/thumbv2/123dok_es/5844286.149015/9.850.148.731.942.1072/future-climatic-scenarios-nazareth-station-january-december-hadgem.webp)