SOUND QUALITY IN URBAN ENVIRONMENTS AND ITS
RELATIONSHIP WITH SOME ACOUSTICS PARAMETERS
J.M. Barrigón Morillas, V. Gómez Escobar, R. Vílchez-Gómez, J.A. Méndez Sierra, F.J. Carmona del Río
Dpto. de Física Aplicada, Universidad de Extremadura, Escuela Politécnica, Avda. Universidad, s/n, 10.071 Cáceres (España)
{barrigon@unex.es, valentin@unex.es, vilchez@unex.es, jmendez@unex.es, jcarmona@unex.es)
Resumen
En este trabajo presentamos, para 32 grabaciones sonoras realizadas en diferentes ambientes urbanos de la ciudad de Badajoz, un estudio de las relaciones existentes entre algunos parámetros sonoros psicoacústicos (sonoridad y agudeza) o indicadores tradicionales (LAeq) y la percepción de los
individuos del nivel de agrado o desagrado de tales ambientes sonoros. La muestra de la población utilizada se ha compuesto de 25 personas.
Se obtienen coeficientes de correlación altamente significativos para la percepción de un ambiente como muy desagradable y todos los indicadores utilizados. La agudeza es el parámetro que más variabilidad explica del desagrado percibido en función de la grabación presentada. El LAeq es el
parámetro que permite obtener mayor número de relaciones significativas con las diferentes formas de medir la sensación de agrado o desagrado de los ambientes sonoros.
Palabras-clave: calidad acústica, parámetros psicoacústicos, ruido urbano, paisaje sonoro.
Abstract
Different urban environments were analyzed acoustically, using 32 recordings obtained with binaural techniques of recording and reproduction. The relationships of the perception of pleasantness/unpleasantness as described by a sample of 25 inhabitants of these urban environments with two psychoacoustic parameters (loudness and sharpness) and the traditional measure of equivalent sound level (dBA) were analyzed in two forms, one using a verbal scale, and the other a numerical value for that perception.
Highly significant correlations were found between the perception of an environment as very unpleasant and the parameters considered for its acoustic characterization. The mean of the numerical value used to express the sensation of liking was significantly correlated with the three sound parameters.
2
1
Introduction
Due largely to urbanization, the environment in which we humans live out most of our lives has undergone major changes in only a very short time in evolutionary terms. These changes have been especially rapid since the Industrial Revolution [1-4]. Our acoustic environment is one aspect that has altered so rapidly that as a species we have had no time to adapt, and this lack of adaptation implies that we are prone to many situations of stress [5] that can lead to psychological conflict and direct health problems. In particular, environmental-noise related concepts such as annoyance, noisiness, noise discomfort, disturbance, and unpleasantness, which in the past would have been recognized only in very specific locations, are commonplace today.
One can consider three basic approaches to the study of the acoustic environment (the 'soundscape') and its influence on people's daily life, psychology, and health [6]. In practice, they are not always studied independently.
The first ('physical') approach is aimed at the objective evaluation of the acoustic environment and its comparison with some reference values of sound levels, etc. [7,8]. This is the principal approach in making noise maps, and forms the basis of much of European regulations and guidelines. Nevertheless, the sound parameters measured in this approach (generally, the A-weighted equivalent sound levels, dBA), although extensively used, have only a weak relationship with the characteristics of human perception, and are not based on the analysis of the signal domain frequency or the sound's temporal structure (modulation, tonality, etc.). Many studies in different countries worldwide, from the beginning of the last century [9] up to the present [10-13], have worked towards achieving an objective characterization of these new urban soundscapes. Although their underlying motivation is the effect of sound on people, their physical focus means that human sensations are only dealt with secondarily.
The second ('psychophysical') approach is specifically aimed at studying the relationship between the sound environment and human sensations, in particular, between the physical parameters associated with sound and people's responses. For instance, the objective variable ‘sound level’ is enriched with a subjective contribution (in terms of ‘annoyance’, ‘unpleasantness, ‘disturbance’, etc.) to allow a characterization of aspects that impact people's physical and psychological well-being negatively. Studies of this kind began to be carried out only a couple of decades after the first work using the 'physical' approach [14]. Different characteristics of the sound now acquire importance, such as the source, its spectrum, its temporal structure, the perceptual context, and personal or socio-demographic characteristics [15-18]. In almost all studies of this kind, measurements of the A-weighted equivalent sound level (dBA) are still used to characterize the objective component of the sound level.
Finally, a third ('perceptual') approach has taken form somewhat more recently, in which the soundscape is treated principally as a source of information and an element of the interrelationship between people and their environment. It is aimed at identifying and describing the bases of the psychological processes that underlie people's appraisal of sound. Pioneering work in this line was done by Schafer [19], and recently Raimbault et al. have described a partial union of this and the 'psychophysical' approaches [20].
The present work, too, while following mainly the 'psychophysical' approach, attempts to make a connection with 'perceptual' studies. In particular, we study the relationships between objectively measured parameters associated with the sound environment (the A-weighted sound level, loudness, and sharpness) and a subjective variable that characterizes people's response (the sensation of pleasantness/unpleasantness).
We selected for the present work a broad variety of acoustic environments that could be considered typical of modern cities. We characterized them by means of objective indices (LAeq, loudness, and
3
The group of subjects whose responses were studied was chosen to be representative of the overall Spanish population in such aspects as age, gender, and level of academic attainment, although it was not an objective of the work to look for correlations with these variables.
A complementary objective of the study was to evaluate the suitability of using psychoacoustic parameters to evaluate people's pleasantness/unpleasantness response to an acoustic environment, instead of the traditional parameter LAeq.
2
Methods
2.1 Equipment
We worked with a binaural recording and playback device (Noise Book from Head Acoustics). The device is fairly light and compact, consisting of a record-and-play unit connected to a computer, precision headphones for the binaural playback, and microphones for binaural recording integrated into the headphones. The aim is to record the sounds of the acoustic environment as closely as possible to the form in which a real subject would perceive them [21-23]. The parameters measured from each recording were loudness, sharpness, and A-weighted equivalent sound level (dBA).
2.2 Choice of the urban environments and the associated acoustic surroundings
As many recordings were made covering the variability of urban acoustic environments as were compatible with the reasonable number of sessions and total time that could be asked of the listeners. These were a total of 32 recordings lasting from 45 s to 3 min. To ensure that different kinds of urban environments were considered, the recordings were sorted into groups, and different measurements were made in each group. It is important to bear in mind that the purpose of this grouping was only for the convenience of organizing the data and analysis by groups was not an objective of the present work. The following were the eight groups formed according to the main noise source or the basic environment present: a) Fairly saturated rush-hour traffic environments (4 recordings); b) Traffic environments combined with other environments (4 recordings); c) Urban green zones (4 recordings); d) Building or road works (3 recording); e) Public transport termini (4 recordings); f) Crowded spaces (4 recordings); g) Children (3 recordings); h) Other urban environments (6 recordings).
2.3 Selection of the subjects
4
2.4 The questionnaire
The first part of the questionnaire included questions about the subject's socio-demographic situation (age, gender, level of academic attainment, profession, working status, etc,) and the physiological and psychological aspects mentioned above to ensure that the selection of the group of subjects was representative. There was also a free space provided for any other data that the subject considered relevant.
The second part consisted of items with closed, Likert-scale, responses about the pleasantness/unpleasantness of each recording of an acoustic environment. This type of scale has been shown to be optimal when the concept being studied is bipolar in nature, such as the present pleasantness/unpleasantness pair [20,25,26]. Seven responses were allowed: very pleasant, quite pleasant, somewhat pleasant, neither pleasant nor unpleasant, somewhat unpleasant, quite unpleasant, very unpleasant (muy agradable, bastante agradable, algo agradable, ni agradable ni desagradable, algo desagradable, bastante desagradable, muy desagradable, in Spanish). These responses were accompanied in the questionnaire by a number from 7 for ‘very pleasant’ to 1 for ‘very unpleasant’ for subsequent numerical analysis.
Finally, in the third part, the subject was asked to describe the sensations or feelings that the recordings produced, selecting three descriptors, if possible, from the following list: stress, annoyance, irritability, sadness, monotony, melancholy, mental fatigue, restlessness, ordinariness, fear, loneliness, tranquillity, relaxation, happiness, well-being, isolation, peace, calmness, entertainment, freedom (estrés, molestia, irritabilidad, tristeza, monotonía, melancolía, fatiga mental, nerviosismo, cotidianeidad, temor, soledad, tranquilidad, relajación, alegría, bienestar, aislamiento, paz, calma, diversión, libertad, in Spanish). If necessary, the subject could use any other descriptor not in the list.
2.5 Presentation of the recordings to the subjects
It was considered best for there to be no order of the different recordings in terms of the kind of acoustic environment, or of the different acoustic indices. Therefore a single, random, listening order was prepared to be used for all the listeners.
Since listening to all 32 recordings in a single session would have been exhausting for the listener, they were presented in three separate sessions, none of which lasted longer than 50 minutes. Sessions were conducted independently for each listener.
In the first session, listeners were informed about the subsequent procedure of the listening sessions and about the contents of the questionnaire. Then they were asked to respond to the first part of the questionnaire (socio-demographic situation, physiological and psychological aspects, and the free space). This was followed by auditions of the first recordings. The questions corresponding to each recording were answered immediately after the audition. The number of recordings listened to in each session depended on the subject (with the only constraint being that, as noted above, the entire session time was at most 50 minutes). Each subject completed the auditions in two subsequent sessions.
3
Results and discussion
3.1 Preliminary statistical analysis
The data obtained with the two channels were first analyzed with respect to the three acoustical parameters studied (LAeq and loudness and sharpness). Figure 1 shows the values of these parameters
5
Figure 1. Values of acoustic parameters for the 32 recordings in the right and left channels: (a) sound level; (b) sharpness; (c) loudness.
As can be seen in the figure 1, there were no major differences between the two channels in the values of the sound indices, as is also confirmed by the proximity of the means and medians of the two channels for the three acoustic parameters. Given this similarity and the lack of any standard procedure to estimate psychoacoustic parameters for binaural recordings, the means of the two channels were used to study the relationships between the acoustic parameters and the sensation of pleasantness/unpleasantness of the different acoustic environments.
Table 1. Mean values and other basic statistics of the 32 recordings.
LA,eq (dBA) Sharpness (acum) Loudness (sone)
Right Channel Left Channel Mean Value Right Channel Left Channel Mean Value Right Channel Left Channel Mean Value
Maximum 99.4 99.3 99.4 6.8 7.0 6.9 172.0 171.1 171.6
Minimum 48.9 48.1 48.5 1.8 1.8 1.8 6.1 5.8 6.0
Median 77.6 77.1 77.3 3.0 3.0 3.0 36.0 35.0 35.6
Mean value 76.1 76.1 76.1 3.1 3.0 3.1 40.2 39.9 40.1
Stan. dev. 9.6 9.7 9.6 0.9 0.9 0.9 28.8 28.3 28.5
3.2 Correlation analysis
We then analyzed the capacity of the measured sound indices to predict the feelings of pleasantness/unpleasantness that people would experience according to the characteristics of the different urban acoustic environments recorded. To this end, two correlation analyses were made of the relationship between the subjects' responses and the physical characteristics of the recordings – one using the verbal scale, and the other using the numerical value for those perceptions.
0 20 40 60 80 100
1 3 5 7 9 11 13 15 17 19 21 23 25 27 29 31
Recording number S o u n d l e v e l (d B A ) Right channel Left channel 0 1 2 3 4 5 6 7
1 3 5 7 9
1 1 1 3 1 5 1 7 1 9 2 1 2 3 2 5 2 7 2 9 3 1 Recording number S h a rp n e s s ( a c u m ) Right channel Left channel 0 20 40 60 80 100 120 140 160 180 200
1 3 5 7 9 11 13 15 17 19 21 23 25 27 29 31
6
3.2.1 Correlation analysis using the verbal scale
To study the possible linear relationship between each of the three indices and the percentage of subjects who expressed a specific level of the sensation of pleasantness/unpleasantness, we binned the responses into eleven categories: 1.- very unpleasant; 2.- quite unpleasant; 3.- somewhat unpleasant; 4.- high level of unpleasantness (very unpleasant plus quite unpleasant); 5.- unpleasant to some degree (very unpleasant plus quite unpleasant plus somewhat unpleasant); 6.- neither pleasant nor unpleasant; 7.- pleasant to some degree (very pleasant plus quite pleasant plus somewhat pleasant); 8.- high level of pleasantness (very pleasant plus quite pleasant); 9.- somewhat pleasant; 10.- quite pleasant, 11.- very pleasant.
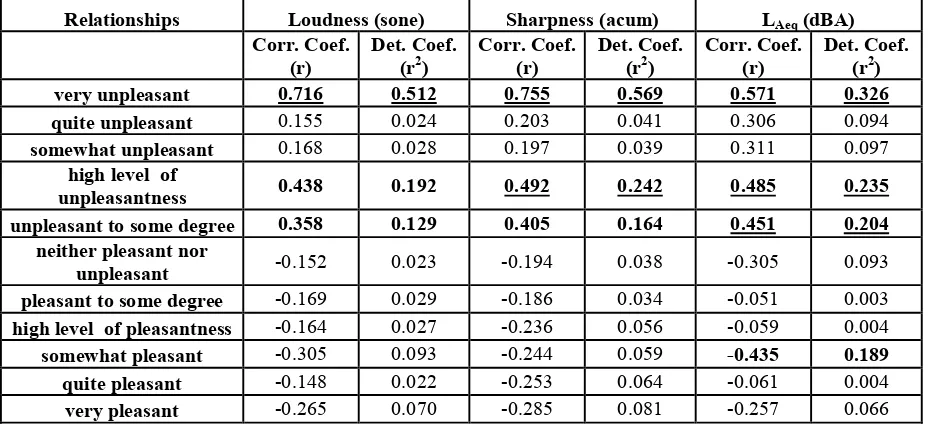
Table 2. Relationship between the sound indices and the categories of the subjects' responses about the feelings that the acoustic environments aroused. Bold underlined numbers indicate a high level of
significance (Prob32(|r|≥0.449) ≤1%); bold-only numbers indicate significance
(Prob32(|r|≥0.349) ≤5%).
Relationships Loudness (sone) Sharpness (acum) LAeq (dBA)
Corr. Coef. (r)
Det. Coef. (r2)
Corr. Coef. (r)
Det. Coef. (r2)
Corr. Coef. (r)
Det. Coef. (r2) very unpleasant 0.716 0.512 0.755 0.569 0.571 0.326 quite unpleasant 0.155 0.024 0.203 0.041 0.306 0.094 somewhat unpleasant 0.168 0.028 0.197 0.039 0.311 0.097
high level of
unpleasantness 0.438 0.192 0.492 0.242 0.485 0.235 unpleasant to some degree 0.358 0.129 0.405 0.164 0.451 0.204
neither pleasant nor
unpleasant -0.152 0.023 -0.194 0.038 -0.305 0.093 pleasant to some degree -0.169 0.029 -0.186 0.034 -0.051 0.003 high level of pleasantness -0.164 0.027 -0.236 0.056 -0.059 0.004 somewhat pleasant -0.305 0.093 -0.244 0.059 -0.435 0.189 quite pleasant -0.148 0.022 -0.253 0.064 -0.061 0.004 very pleasant -0.265 0.070 -0.285 0.081 -0.257 0.066
Table 2 gives the results for these correlations. One observes from Table 2 that there were some relationships whose correlation coefficients (r) indicate a high degree of significance (Prob32(|r|≥0.449) ≤1%) (denoted as bold underlined numbers in Table 2). This was the case for the
relationships between the environments classified as ‘very unpleasant’ (Category 1) and the three sound indices studied (loudness, sharpness, and LAeq; rloud= 0.716, rsharp=0.755, and rLAeq=0.571,
respectively). The variations in the values of loudness and sharpness can explain at least 50% of the variation of the percentage of subjects who thought that an acoustic environment was ‘very unpleasant’ (51.2% and 56.9%, respectively). Figure 2 shows, by way of example, the variation of the percentage of subjects who considered the corresponding recording to be ‘very unpleasant’ as a function of the loudness. When to the ‘very unpleasant’ responses were added the responses which classified the environments with a lower degree of unpleasantness, thus forming Category 4 ‘high level of unpleasantness’, and Category 5 ‘unpleasant to some degree’, the correlations between the sound indices and the percentage of responses were always significant (Prob32(|r|≥0.349) ≤5%,
[image:6.595.67.531.303.516.2]7
0 5 10 15 20 25 30 35 40 45 50
0 20 40 60 80 100 120 140 160 180 200
Loudness (sone)
%
(
V
e
ry
u
n
p
le
a
s
a
n
[image:7.595.166.429.105.263.2]t)
Figure 2. The percentage of subjects who considered a recording to be ‘very unpleasant’ versus the loudness.
Although the strongest correlation coefficient was found for the relationship between the ‘very unpleasant’ response and sharpness, it is important to note that LAeq was the only index whose
correlation coefficients were highly significant with the three increasingly inclusive categories of unpleasantness (1 ‘very unpleasant’, 4 ‘high level of unpleasantness’, and 5 ‘unpleasant to some degree’). Thus, on the basis of the coefficients of determination (r2), the equivalent sound level was a better indicator of the perception that an acoustic environment is unpleasant to some degree than the loudness or the sharpness (rloud= 0.358, rsharp=0.405, rLAeq=0.451). As can be seen, LAeq explained 20%
of the variability detected in the subjective sensation of a given sound environment being ‘unpleasant to some degree’.
As can be seen in Table 2, none of the parameters studied were correlated (Prob32(|r|≥0.349) ≤5%)
with the perception of an acoustic environment as ‘neither pleasant nor unpleasant’ (rloud= -0.15, rsharp=
-0.19, rLAeq= -0.31).
With respect to the sensation of pleasantness, one observes from Table 2 that, with a single exception, there were no significant correlations, indicating that the parameters studied are better indicators of the unpleasantness of a sound environment than of the pleasantness. The exception was a significant correlation (rLAeq=-0.435) of the parameter LAeq, but not of the loudness or sharpness, with Category 9
('somewhat pleasant').
One also observes from Table 2 that, of the two psychoacoustic parameters analyzed (loudness and sharpness), sharpness explained a greater percentage of the variability than loudness for the aforementioned three classes of unpleasantness – Category 1 ‘very unpleasant’, Category 4 ‘high level of unpleasantness’, and Category 5 ‘unpleasant to some degree’.
3.2.2 Correlation analysis using numerical value
To study the possible linear relationship between each of the three indices and the subjects' overall perception of pleasantness/unpleasantness, we analyzed the mode, median, mean, and minimum and maximum values of the pleasantness scores (on the scale of 1–7) assigned to the responses for each of the 32 recordings. Table 3 gives the results for the linear regression analysis between these statistics and the three sound indices.
As can be seen, the statistic that best correlated with the acoustic indices was the minimum value of pleasantness, being highly significant (Prob32(|r|≥0.449) ≤1%) with both sharpness and LAeq, and
significant (Prob32(|r|≥0.349) ≤5%) with loudness. Interestingly, the mode was highly significantly
correlated (Prob32(|r|≥0.449) ≤1%) with the two psychoacoustic parameters, but not with the
8
Table 3. Relationship between the sound indices and the numerical values of the subjects' feelings. Bold underlined numbers indicate a high level of significance (Prob32(|r|≥0.449) ≤1%); bold-only
numbers indicate significance (Prob32(|r|≥0.349) ≤5%).
Relationships Loudness (sone) Sharpness (acum) LAeq (dBA)
Corr. Coef. (r)
Det. Coef. (r2)
Corr. Coef. (r)
Det. Coef. (r2)
Corr. Coef. (r)
Det. Coef. (r2) Minimum of
pleasantness -0.429 0.184 -0.452 0.204 -0.485 0.235
Pleasantness mode -0.458 0.210 -0.490 0.240 -0.301 0.091
Pleasantness mean -0.379 0.144 -0.428 0.184 -0.369 0.137
Pleasantness median -0.323 0.104 -0.383 0.147 -0.318 0.101
Maximum of
pleasantness -0.138 0.019 -0.176 0.031 -0.251 0.063
The mean was significantly correlated with all three indices (Prob32(|r|≥0.349) ≤5%). The median was
only significantly correlated with sharpness. The maximum value of pleasantness was not correlated with any of the indices.
Figure 3 shows the value of the mode of the sensation of pleasantness as a function of the sharpness – the correlation that had the highest coefficient of determination (r2).
It is important to note that the coefficients of determination (r2) obtained for the relationships with the numerical values of the sensation of pleasantness were in general lower than those obtained with the verbal scale.
0 1 2 3 4 5 6 7
0 1 2 3 4 5 6 7 8
Sharpness (acum)
M
o
d
e
f
o
r
th
e
s
e
n
s
a
ti
o
n
o
f
p
le
a
s
a
n
tn
e
s
[image:8.595.168.431.404.561.2]s
Figure 3. Value of the mode of the subjects' sensation of pleasantness versus thesharpness.
4
Conclusions
A greater percentage of the variation of the response of ‘very unpleasant’ to an acoustic environment was explained by the psychoacoustic parameters sharpness (57%) and loudness (51%) than by the LAeq
9
intense the sensation of unpleasantness of an acoustic environment, the less significant were the values of the sound indices in explaining that sensation. This effect was less marked in the case of the equivalent sound level. Thus, while for the two most negative sensation categories, i.e., ‘very unpleasant’ (Category 1) and ‘high level of unpleasantness’ (Category 4), sharpness was the index which best explained the variation in the subjects' responses, when all three negative responses were binned together, i.e., ‘unpleasant to some degree’ (Category 5), the greatest coefficient of determination corresponded to LAeq.
Using the verbal scale, we found highly significant correlations between the values of all three indices in certain acoustic environments and the percentage of subjects who considered those environments to be very unpleasant. Including lower levels of unpleasantness reduced, however, the significance of the correlations. No significant correlations were found between the three acoustic indices studied and the sensation of a sound environment being pleasant. Thus, according to the results of the present study, it is difficult to explain the pleasantness of acoustic environments on the basis of the sound indices that we have used. The only significant correlation was of the parameter LAeq with the response 'somewhat
pleasant'. Comparing the two psychoacoustic parameters studied and LAeq, we found that the former
allowed a better explanation of the high levels of unpleasantness, while the latter explained better the possibility of an acoustic environment being considered 'unpleasant to some degree' (Category 5). Of the two psychoacoustic parameters, sharpness always presented a greater coefficient of determination than loudness when there was a significant correlation, indicating that it better explained the variations in the responses.
Using the numerical statistics of the scores assigned to the sensation-of-pleasantness responses, we found correlations that had lower coefficients of determination than those obtained with the verbal scale. While the maximum value was not correlated with any of the indices, the minimum was significantly correlated with all three, the correlation being highly significant with LAeq and sharpness.
With respect to the central statistics –mean, median, and mode– all three acoustical indices studied were significantly correlated with the mean. The mode was highly significantly correlated with loudness and sharpness, but there was no significant correlation with the equivalent sound level. The only index that significantly correlated with all three central statistics was sharpness (highly significant with the mode, and significant with the mean and median). Thus, as with the verbal scale, this parameter again seems to be the best suited to explaining the variation in people’s pleasantness /unpleasantness response to an acoustic environment.
References
[1] Merrington, John. Town and Country in the Transition to Capitalism, New Left Review 1975; 93 1975, 71-92.
[2] Lefebvre, H. La révolution urbaine: Gallimard, Collection Idées, Paris, 1970.
[3] De Vries, Jan. European Urbanization 1500-1800. Harvard Univ. Press, Cambridge, 1984.
[4] United Nations (UN); Population Division. World urbanization prospects: The 2001 revision. UN, New York, 2002.
[5] Seyle H. A syndrome produced by diverse nocuous agents. Nature 1936;138:32.
[6] López Barrio I, Carles JL. La calidad sonora de Valencia. Espacios sonoros representativos, Fundación Bancaixa, Valencia, Spain; 1997. ISBN: 84-88715-80-3.
[7] Organization for Economic Cooperation and Development (OECD). Report Fighting Noise. OECD Publications, Paris, 1986.
10
[9] Free EE, Measurements of the street noise in New York city. Physical Review 1926; 27: 507.
[10]Broderson AB, Edwards RG, Hauser WP, Coakley WS. Community noise in twenty Kentucky cities. Noise Control Engineering 1981; 16: 52-63.
[11]Chakrabarty D, Santra SC, Mukherjee A, Roy B, Das P. Status of road traffic noise in Calcutta metropolis, India. J. Acoust. Soc. Am. 1997;101: 943-949.
[12]Sommerhoff J, Recuero M, Suárez E Community noise survey of the city of Valdivia, Chile. App. Acoust. 2004; 65: 643-656.
[13]Barrigón Morillas JM, Gómez Escobar V, Méndez Sierra JA, Vílchez-Gómez R, Vaquero Martínez JM, Trujillo Carmona J. A categorization method applied to the study of urban road traffic noise. J. Acoust. Soc. Am. 2005; 116, 2844-2852.
[14]Fields JM. An updated catalog of 521 social surveys of resident’ reactions to environmental noise (1943-2000), NASA Center for AeroSpace Information (CASI), Hanover, 2001.
[15]Weinstein BE. Individual differences in critical tendencies on noise annoyance. J. Sound and Vibration 1980; 68, 241-248.
[16]Griffiths ID, Raw GJ. Adaptation to changes in traffic noise exposure. J. Sound and Vibration 1989; 132, 331-336.
[17]Fields JM. Effect of personal and situational variables on noise annoyance: With special reference to implication for En Route Noise. NASA, Atlanta, 1992.
[18]Borsky PN. (1980) Review of community response to noise. In “Noise as a Public Health problem”. ASHA Reports 10, Rockville, 1980.
[19]Schafer RM. The tuning of the world. A.A.Knopf, New York,1977.
[20]Raimbault M, Lavandier C., Bérengier M. Ambient sound assessment of urban environments: field studies in two French cities. App. Acoustics 2003; 64, 1241-1256.
[21]Møller H. Fundamental of binaural technology. App. Acoust. 1992; 36:171-218.
[22]Ando Y. Architectural Acoustics – Blending Sound Sources, Sound Fields and Listeners. AIP/Springer-Verlag, New York, 1998.
[23]Hotehama T., Sato S., Ando Y. Dissimilarity judgments in relation to temporal and spatial factors for the sound field in an existing hall. J. Sound and Vibration 2002; 258, 429-441.
[24]Barrigón Morillas JM, Palma Amador B, Vílchez-Gómez R, Gómez Escobar V, Méndez Sierra JA, Vaquero JM. La calidad sonora en los ambientes urbanos y su relación con algunos parámetros acústicos. Revista Española de Acústica 2003; 34: CD publication (ISBN: 84-87985-08-4).
[25]Zitler A, Hellbrueck J. Psychophysical scaling of the pleasantness of environmental sounds. In: 7th International Congress on Sound and Vibration, Garmisch-Partenkirchen, Germany, 2000.