JAVIER PEÑA LÓPEZ
DIRECTOR: BERNAT BUSCÀ SAFONT-TRIA
A THESIS SUBMITTED TO THE FACULTY OF EDUCATION, HUMANITIES AND TRANSLATION IN PARTIAL FULFILLMENT OF THE REQUIREMENTS FOR THE DEGREE OF DOCTOR OF PHILOSOPHY.
PHD PROGRAM IN EDUCATIONAL INNOVATION AND INTERVENTION IN CON-TEXTS OF DIVERSITY.
VIC, BARCELONA.
ANAL
YSIS OF
THE SER
VICE AS A PERFORM
ANCE F
A
CT
OR IN HIGH-LE
VEL
VOLLEY
BALL AND BEA
CH
VOLLEY
BALL
JA
VIER PEÑA L
OPEZ
ANALYSIS OF THE SERVICE AS A PERFORMANCE FACTOR
IN HIGH-LEVEL VOLLEYBALL AND BEACH VOLLEYBALL
C M Y CM MY CY CMY K
“If you’re trying to achieve, there will be roadblocks. I’ve had them; every-body has had them. But obstacles don’t have to stop you. If you run into a wall, don’t turn around and give up. Figure out how to climb it, go through it, or work around it.” ~ Vince Lombardi
“Coaching is about finding a sys-tem that works for your players. There are some underlying principles which are applied in any coaching situation but it’s about picking the lock to get this group of players to play the best volleyball they’re capable of playing for a long period of time.” ~ Hugh McCutcheon
UNIVERSITAT DE VIC
ANALYSIS OF THE SERVICE AS A PERFORMANCE FACTOR IN
HIGH-LEVEL VOLLEYBALL AND BEACH VOLLEYBALL
BY
JAVIER PEÑA LÓPEZ
DIRECTOR: BERNAT BUSCÀ SAFONT-TRIA
A THESIS SUBMITTED TO THE FACULTY OF EDUCATION, HUMANITIES AND TRANSLATION IN PARTIAL FULFILLMENT OF THE REQUIREMENTS FOR THE
DEGREE OF
DOCTOR OF PHILOSOPHY
PHD PROGRAM IN EDUCATIONAL INNOVATION AND INTERVENTION IN CONTEXTS OF DIVERSITY
©JAVIER PEÑA LÓPEZ
2013 VIC, BARCELONA
PERMISSION IS HEREBY GRANTED TO THE UNIVERSITY OF VIC TO REPRODUCE SINGLE COPIES OF THIS THESIS AND TO LEND OR SELL SUCH COPIES FOR PRIVATE, SCHOLARLY OR SCIENTIFIC RESEARCH
PURPOS-ES ONLY. WHERE THE THPURPOS-ESIS IS CONVERTED TO, OR OTHERWISE MADE AVAILABLE IN DIGITAL FORM, THE UNIVERSITY OF VIC WILL ADVISE POTENTIAL USERS OF THE THESIS OF THESE TERMS.
THE AUTHOR RESERVES ALL OTHER PUBLICATION AND OTHER RIGHTS IN ASSOCIATION WITH THE COPY-RIGHT IN THE THESIS AND, EXCEPT AS HEREIN BEFORE PROVIDED, NEITHER THE THESIS NOR ANY
ABSTRACT
The ultimate goal of this Dissertation was to identify some critical aspects of the use of service in high-level volleyball and beach volleyball. To address this purpose and to achieve a more contextualized approach, four studies on different aspects of service performance in both sports were conducted. The first study, car-rying out an analysis between service mode, speed and effectiveness in high-level volleyball, highlighted the importance of the use of jump service abilities. Although no significant relationship was found between service velocity and a better direct outcome related to effectiveness, jump services were revealed as the perfect weapon to avoid first-tempo and quick outside attacks from the opponents.
Our second study was intended to verify the relationship between service speed and its effectiveness in a high-level beach volleyball tournament. In this new research, the sample included men and women’s teams and incorporated two inter-esting additional performance factors: rally outcome and the ranking of the teams. The results showed that the proportion of jump float services used by men and women in beach volleyball is similar, while the differences are greater in the use of jump topspin service and standing float service. Despite finding no relationship between service speed and effectiveness in either gender, a relationship was found when service was categorized into three groups of speed. Greater percentages of perfect receptions were found when facing low speed services, with the opposite occurring at higher speed services. However, no correlation between service speeds, reception outcome, final rally outcome and service effectiveness was found for ei-ther gender in our final results.
high-level volleyball tournament. Speed proved not to be the only factor affecting the quality of the reception, as we were unable to find any of the fastest services record-ed among the ones from the winning team, and no significant differences were found between finalists and non-finalists in terms of average service speeds.
ACKNOWLEDGMENTS
The process of achieving the academic degree of Doctor of Philosophy is long, and many people have contributed decisively to it. Over the next lines, I would like to pay tribute in the form of acknowledgment to all of them.
My first recognition is for our sport, volleyball. Without it, I would not have met so many interesting people, would not have developed my professional career, nor have experienced some personal success stories. Explicit thanks here for the players, coaches and organizations that kindly opened their doors for our research purposes.
I cannot but thank my director, Dr. Bernat Buscà, for his ongoing supervision and support throughout this process. This dissertation would not have come to a successful end without his decisive intervention. A special mention to Dr. Antoni Tort, for his understanding and guidance in the more than complex world of the doctoral programs, and Dr. Gerard Moras, for his vast influence, and for considering me part of his workgroup in my early research experiences. Also thanks to all the co-authors of the articles, colleagues, peers and former students without whom this work would not have been possible. I would like to underline the contributions of Mr. Sergio Rodríguez-Jiménez.
This dissertation would not have been possible without the funding received from the University of Vic. I would like to thank the dean, department directors and Sport Sciences degree coordinators of the Faculty of Education, Humanities and Translation for their determined intervention in the grant of a paid leave of absence, which has eventually brought me so much on a personal level.
Finally, I would like to thank my family for their continued support and love. An academic career is full of ups and downs. Without someone who understands them by your side, they are really difficult to overcome. Thanks Mum for teaching me the value of empathy with others. Thanks Dad for make me understand that working hard and putting in a great deal of effort is the only way to find a place in life. You are true role models! Iván, my “little bro”, thank you for showing me the different views on life and that barriers are there to be broken. Grandpa and Grandma, do you see? It was true… There is no elevator to success; you have to take the stairs.
TABLE OF CONTENTS
CHAPTER 1 1
INTRODUCTION 1
SERVICE IN VOLLEYBALL 3
SERVICE IN BEACH VOLLEYBALL 6 PERFORMANCE ANALYSIS IN SPORT 9 NOTATIONAL ANALYSIS IN SPORT 14
HAND NOTATION AND COMPUTERIZED NOTATION SYSTEMS. 16
USE OF COMPUTERIZED NOTATION SYSTEMS IN VOLLEYBALL DISCIPLINES. 18
OVERVIEW OF DISSERTATION 23 REFERENCES 27
CHAPTER 2 35
A COMPARATIVE STUDY BETWEEN SERVE MODE AND SPEED AND ITS EFFECTIVE-NESS IN A HIGH-LEVEL VOLLEYBALL TOURNAMENT 35 ABSTRACT 36 INTRODUCTION 36 METHODS 38
VOLLEYBALL TOURNAMENT 38
DATA RECORDING 38
TYPE OF SERVICES 40
VALUE CATEGORIES 40
STATISTICAL ANALYSIS 40
CONCLUSIONS 46 ACKNOWLEDGMENTS 46 REFERENCES 46
CHAPTER 3 51
THE INFLUENCE OF SERVE CHARACTERISTICS ON PERFORMANCE IN MEN’S AND WOMEN’S HIGH-STANDARD BEACH VOLLEYBALL 51 ABSTRACT 52 INTRODUCTION 53 METHODS 55
SAMPLE 62
DESIGN AND VARIABLES 56
PROCEDURES AND MATERIALS 57
STATISTICAL ANALYSIS 58
RESULTS 59 DISCUSSION 63 CONCLUSION 66 REFERENCES 67
CHAPTER 4 71
CHAPTER 5 76
WHICH SKILLS AND FACTORS BETTER PREDICT WINNING AND LOSING IN HIGH-LEVEL MEN’S VOLLEYBALL? 76 ABSTRACT 78 INTRODUCTION 79 METHODS 82
EXPERIMENTAL APPROACH TO THE PROBLEM 82
SUBJECTS 83 PROCEDURES 83
STATISTICAL ANALYSES 85
RESULTS 86 DISCUSSION 89 PRACTICAL APPLICATIONS 93 ACKNOWLEDGMENTS 93 REFERENCES 94
CHAPTER 6 98
LIST OF TABLES
Table 1-1: Different areas and groups of interest under research in sport performance analysis. 10 Table 2-1: Service types vs. value categories. 42 Table 2-2: Jump service distribution with a value ‘=’ (error) and ‘#’
(direct point) in velocity ranks. 43 Table 3-1: Service types according to value categories (effectiveness). 60 Table 3-2: Service speed according to value categories (effectiveness). 62 Table 3-3: Service speed and type of service according to ranking. 63 Table 3-4: Rally outcome according to service values categories
(effectiveness). 63 Table 5-1: Skills categorization according to the Data Volley 2007
system. 87
LIST OF FIGURES
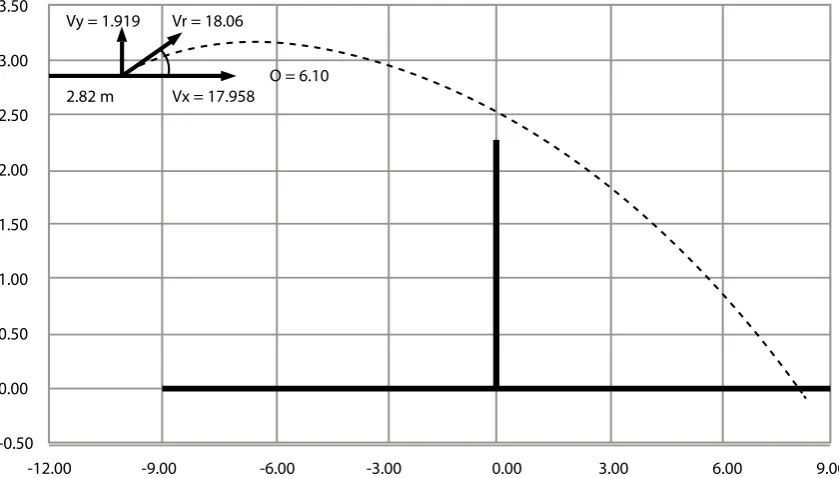
Figure 1: Projectile analysis of a jump service using equations by Northtrip, Logan and McKinney (1983) and values by Strohmeyer (1988). 5 Figure 2: Beach volleyball official game playing surface and game
struc-ture. 6
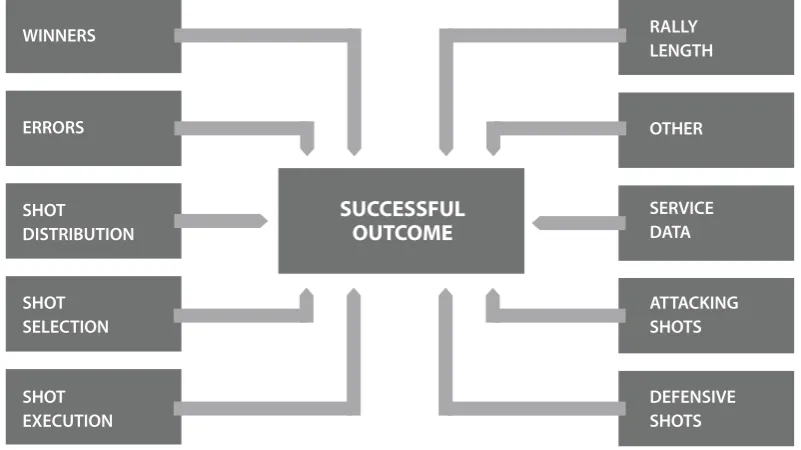
Figure 3: Diagram representing the coaching process. 10 Figure 4: Performance indicators contributing to success or improved
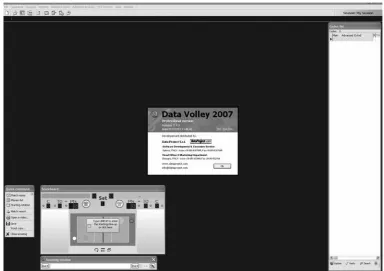
per-formance in net games such as volleyball. 14 Figure 5: Data Volley software interface. 20 Figure 6: Research focused on performance analysis in volleyball defined by
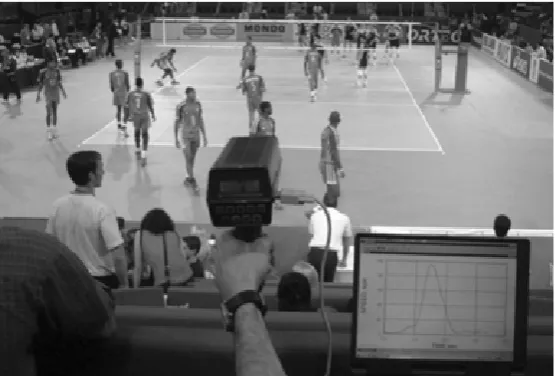
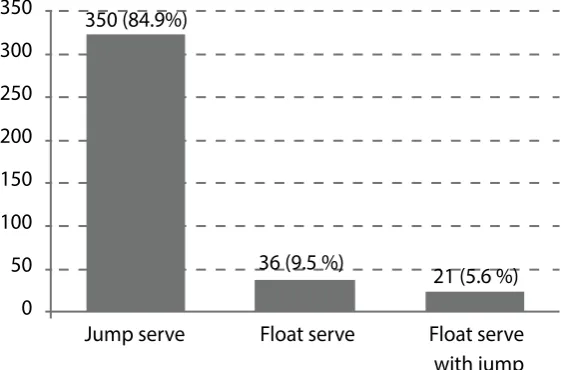
Mesquita, Palao, Marcelino, & Afonso (2013). 23 Figure 7: Positioning of radar. 45 Figure 8: Frequency and percentage of each kind of service. 47 Figure 9: Assessment of service ball speed. 1Radar gun, 2Radar gun location
area. 58
LIST OF ABBREVIATIONS
CHAPTER 1
INTRODUCTION
According to the official F.I.V.B. rules, the service is “the act of putting the ball into play, by the right-back player, placed in the service zone”. To execute the service adapting to the standards, the service should be performed within 8 sec-onds after the 1st referee authorizes it, hitting the ball with just one hand (or any
part of the arm) after being released from the hands, and not touching the court at the moment of the service or during the takeoff for a jump service technique.
That performance may seem simple to someone not really expert in our sport. In fact, service is one of the original volleyball skills that William G. Morgan introduced in the first written rules back in 1897. Nevertheless, is better not to make the mistake of considering the service a minor skill of the game. Even as one of the few techniques in volleyball in which there is no interaction with the partner or the opponent in its execution, most authors agree about the importance of volleyball service as one of the capital skills in the game. Not surprisingly, during the evolution of our sport we have seen many variations and executions for this technical skill, simply in search of excellence. Standing, jump, float, spin, hook, underhand and overhand services are fairly common today in different competition levels and contexts.
Our perspective was within the latest trends of performance analysis in sport and will use notational analysis and statistical procedures, taking into account tech-nical, tactical and kinematic approaches for its study.
SERVICE IN VOLLEYBALL
Volleyball service is a skill commonly described as the first element of the defense, essential in preventing a team from siding out (Wise, 2002). Since the in-troduction of the rally point system by the F.I.V.B. in 1998, the service has become an even more important skill in the game. Basically, a good service in combination with an efficient defensive strategy neutralizes the opponent’s opportunity of creating a point. On the other hand, a mistake while serving leads to an error and consequently to a point, not just to a side-out as it used to be with the traditional scoring system.
In high-level volleyball, the chance of obtaining a direct point using the ser-vice is low. Nevertheless, the benefits from serving are not only based on the possi-bility of scoring, but also on influencing the next attack play of the opponent (Qui-roga, García-Manso, Rodríguez-Ruiz, Sarmiento, De Saa, & Moreno, 2010). A team struggling to defend a good service efficiently will drastically reduce its possibilities of winning the match (Patsiaouras, Moustakidis, Charitonidis, & Kokaridas, 2011).
Ro-dríguez-Ruiz, Sarmiento, De Saa, & Moreno, 2010). This difference in the perfor-mance of the service is more than likely due to the physical differences between men and women and the requirements for carrying out an effective jump topspin service: fast arm speed, fast approach, high and consistent toss, overall ball control and greater height of the performer (U.S.A. Volleyball, 2009).
The jump topspin service is very appealing for use in competition for a vari-ety of reasons. The server can create greater forces, owing to an increased range of motion, and this enables the ball to travel at higher velocities than the other services. Strohmeyer (1988) in a classical study conducted regarding the jump servers of the men’s and women’s U.S.A. national teams found an average velocity of 19 m·s-1 for
the jump services, while the “conventional servers” served at an average velocity of 14 m·s-1. The advantage of faster services compared with less aggresive services is
that they give less reaction time to the flight path. Katsikadelli (1998) observed the flight times of the jump services of the two finalists of the 1994 World Champion-ship, Italy and Netherlands, and noticed they were significantly lower than those of the rest of the teams.
Some other relevant factors of the jump service performance are that the jump action allows service at lower trajectory angles of about six degrees above horizontal for the jump topspin service, compared to 13 degrees above horizontal for the standing float service (Strohmeyer, 1988) and that when executed correctly, jump service carries the server onto the court, ready to play.
Figure 1: Projectile analysis of a jump service using equations by Northtrip, Logan and McKinney (1983) and values by Strohmeyer (1988).
(Fellingham, Hinkle, & Hunter, 2013) by risking the service. Nevertheless, there is some evidence that the higher the level of the team is, the less the probability of unforced errors during the game (Palao, Santos, & Ureña, 2004) and that statement includes the service as well.
Recently, the F.I.V.B. has been evaluating some changes to the official volleyball rules referring to the characteristics of the hit to play the ball. One of the most controversial proposals is to put the use of overhead finger action during the reception actions, under close surveillance by the officials. The intention is to provoke poorer ball control during the first contact, and to decrease the attack levels to make the rallies longer. This new scenario would probably force a different development of the reception actions and would probably, change the profile of some of the players involved in reception systems. If the corresponding committee passes this new rule, we can anticipate an increase in the percentage of jump float services executed during the game. With a higher demand for the use of overhand techniques in reception, this service will be more dangerous in terms of mobility and accuracy from the players, forced to use the underhand pass technique more frequently. It will be interesting to study the changes that the introduction of this new rule may lead to the service strategies of high-level teams.
SERVICE IN BEACH VOLLEYBALL
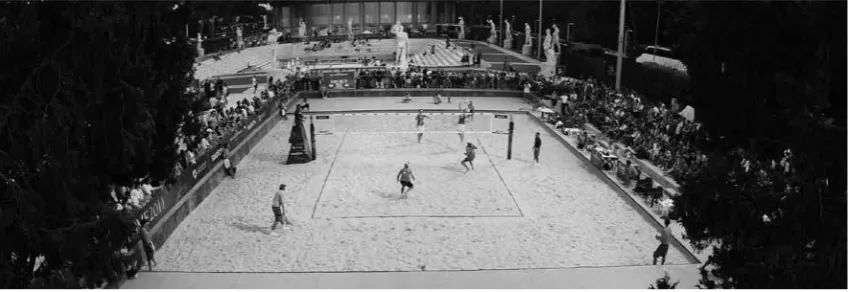
Figure 2: Beach volleyball official game playing surface and game structure.
The major skills characterizing beach volleyball are similar to the ones in volleyball, and like the indoor sport, it is divided into two phases: side-out and counterattack.
The use of the service is similar to volleyball, with an explicit intention to limit the offensive possibilities of the opposing team. However, the different court dimensions (8x8 m), the limited number of players, the particular characteristics of the playing surface and the changing climatic conditions make the service cir-cumstances differ clearly from those in volleyball. As a result, the percentage of jump services used decreases to 54.7% regarding volleyball in male players, while remaining at similar percentages to the indoor game (45.3%) for female players (López-Martínez & Palao, 2009).
from their role during the whole match. Considering that the average match dura-tion in beach volleyball is quite stable, ranging from 30 to 60 minutes, that a beach volleyball match has a significant number of rallies to play (ranging from 78 to 96) and that in a tournament several matches are played, this strategy appears to be, at least, interesting (Palao, Valades, & Ortega, 2012).
The behavior of players performing jump services in beach volleyball is similar to those executing this type of services in indoor volleyball. The number of errors for these executions is significantly higher than for the standing float services (12% vs. 4.2% for males and 18.4% vs. 6.1% for females in López-Martínez & Palao, 2009) meaning that players show a clear preference for power services as a strategy to impair the set, expecting a direct effect on lowering the attack efficacy of the opposing team (Giatsis & Zahariadis, 2008).
The more interesting service strategies to reduce the attack potential of the op-posing team in beach volleyball are, in general terms, similar to the ones used in in-door volleyball: serve to the seams and interference zones between receivers (López-Martínez & Palao, 2009), serve to the deep corners and serve short to have a greater opportunity to be passed back over the net, or into it (McGown, Fronske, & Moser, 2001). But there is a particular strategy in beach volleyball: serving to the players with a lower attack potential level. The main objective of this strategy is to force the worst attacker to perform a higher percentage of the attack actions. For this reason, in beach volleyball, the “over on two attack” technique (intended to partially reduce the effects of this serv-ing strategy) is more common than in indoor volleyball (Giatsis & Zahariadis, 2008).
some of the skills in defense like block and dig (Giatsis & Tzetzis, 2003; López-Martínez & Palao, 2009). It seems then, that making too many mistakes by risking the service can lead to losing a match easily and that analysing correctly the strengths and weaknesses of the players is a key to enhancing the service performances in beach volleyball, as well.
PERFORMANCE ANALYSIS IN SPORT
Performance analysis in sport is “the investigation of actual sports perfor-mance or perforperfor-mance in training” (O’Donoghue, 2010).
Performance analysis is an interdisciplinary subject in nature, its main goal is twofold: on one hand it seeks to advance scientific understanding and on the other, pursues assisting sports practice by providing the coaching processes with augment-ed information (McGarry, O’Donoghue, & Sampaio, 2013). Glazier (2010) considers performance analysis as an independent sub-discipline of sport science, emerging during the first decade of 2000, and provoking some controversy among researchers from traditional and more established sub-disciplines like sport physiology, sport psychology or biomechanics.
According to O’Donoghue (2010) the main reason for carrying out performance analysis in sport is to develop an understanding of the game that can help deci-sion-making processes. The complexity and dynamic nature of many sport disci-plines, lead us to carry out observation and measurement to improve our knowledge of performance, applying this new knowledge to enhance it.
If the essence of the coaching process is to produce changes in behavior and the coaching and teaching of a skill depends on analysis to make an improvement in athletic performance, informed and accurate measures are necessary for effective feedback, and hence, improvement of performance (Franks I. M., 2005). Feedback is defined as “information relating how a skill was performed and its effectiveness” (Hendry & Hodges in 2013) and the way it is presented can have important impli-cations on the learning processes, the attitude of the learner and the proficiency of the skills developed
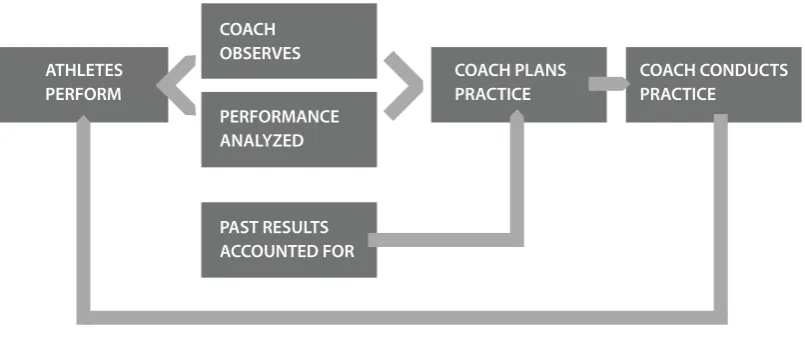
In most sports, the analysis of performance is based on a series of qualitative assessments and judgements made by the coach or the members of the staff, Franks, Goodman, & Miller (1983a) defined a simple flowchart of the coaching process that outlines it in all the phases:
[image:26.595.99.502.408.578.2]
Figure 3: Diagram representing the coaching process.
Those systems of monitoring performance can be used in two different mo-ments of the coaching process (Hughes, 2008):
1. In real time: performance analysis can be used during the activity, to provide immediate feedback to the athletes and perform simple anal-yses.
2. With time lapsed: performance analysis is used in post-activity anal-ysis, examining carefully and in detail all the relevant aspects of the performance.
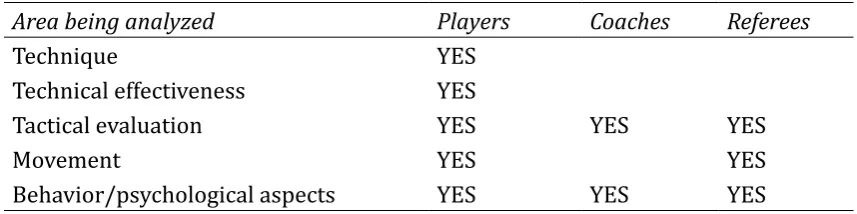
[image:27.595.83.512.469.576.2]The application of performance analysis is really extensive. O’Donoghue (2010) identified a revised set of research areas of performance analysis, indicating how they were applied to different groups of interest in sport activities:
Table 1-1: Different areas and groups of interest under re-search in sport performance analysis.
Area being analyzed Players Coaches Referees
Technique YES Technical effectiveness YES
Tactical evaluation YES YES YES Movement YES YES Behavior/psychological aspects YES YES YES
a long tradition and vast production in performance analysis research. O’Donoghue (2010) provides us with a list of research topics that have been used on a recurring basis in the field of performance analysis:
1. Coaches’ behavior 2. Performance indicators
3. Work-rate analysis and evaluation of risk injury 4. Reliability of methods
5. Analysis of technique 6. Technical effectiveness 7. Tactical patterns of play 8. Performance profiling
This number of possibilities, and the great differences of each discipline, have generated a great variation in the assessment methods that can be used in every sport. Despite this variation in the methods, the purpose of the analysis and the type of information desired, a quantitative analysis with the use of an objective and reliable procedure appears to provide the most useful record of performance (Eom & Schutz, 1992a).
The main methods used in objectifying the process in team sports are through the use of notational analysis. We have evidence of the use of notation-al annotation-alysis to assess performance of team sports like American and Austrnotation-alian football, basketball, cricket, field hockey, handball, netball, rugby, soccer, beach volleyball and volleyball.
conceptualization of performance analysis that brings together notational analysis and biomechanics. For the author, the common factor linking both disciplines is that both “can be used to describe the same phenomenon”. To our knowledge, some other combinations between performance analysis sub-disciplines and notational analysis appear to make sense.
Hughes M. (2004) explains the process of performing a complete notational analysis:
1. Defining performance indicators.
2. Determining which of these indicators are important. 3. Establishing the reliability of gathered data.
4. Ensuring that enough data have been collected to define the stability of performance profiles.
5. Comparing different sets of data. 6. Modelling performances.
The correct definition of performance indicators (also called performance parameters) and their selection based on relevance criteria, is one of the key aspects to use this performance analysis technique. A performance indicator is a “selection or combination of action variables that aims to define some or all aspects of a per-formance” (Hughes & Bartlett, 2005)and it should be related to successful perfor-mance or outcome. Notational analysis has focused traditionally on team and match play sports, studying the interactions between players and the movements and be-havior of individual team members.
Figure 4: Performance indicators contributing to success or improved performance in net games such as volleyball.
In the following paragraphs we will discuss more extensively about notation-al annotation-alysis as one of the most important trends in sports performance annotation-alysis.
NOTATIONAL ANALYSIS IN SPORT
Hughes & Franks (1997) define notational analysis in sport as “an objective way of recording performance so that key elements of that performance can be quantified in a valid and consistent manner”.
oc-curred during a game (Franks & Miller, 1991). A third study by Franks (1993) with experienced gymnastic coaches, found that experts were not significant-ly better than novice coaches in detecting differences in sequentialsignificant-ly presented handspring performances.
These and subsequent studies can be used to set an example of how the curacy of human information processing system is questionable, if an objective ac-counting of past events is required.
Some of the inaccuracies in coaches’ observation of sports performance can be explained by (O’Donoghue, 2010):
1. Memory overload: trying to retain too many items of information
2. Subjective bias: despite efforts at objectivity, coaches decisions will be always influenced by subjectivity.
3. Halo effect: performances will be rated higher or lower, if performer starts the activity well or badly.
4. Leniency error: a performance appraisal error which occurs when coaches over-rate a very poor performance and viceversa.
5. Highlighting: coaches will remember key elements of performance but not the essential sustaining elements (“bread and butter”).
6. Increased arousal level: dysregulation of consciousness, attention, and information processing as a consequence of high stress and anxiety.
7. Errors in attentional focus: directing the attention to non-relevant information.
HAND NOTATION AND COMPUTERIZED NOTATION SYSTEMS.
Both hand notation systems and computerized notation systems have been ap-plied to virtually all sporting situations, providing a substantial amount of quality data. In fact, rudimentary and unsophisticated forms of notation analysis have existed for some time. Initially soccer and squash were the disciplines with a superior quantity of research papers and work, but this has now changed significantly and a substantial number of publications can be found in almost every sport (Hughes & Franks, 1997).
Although some sports have little notational research published, this does not mean that systems do not exist or are not actually used in these disciplines.
The article considered as the earliest publication in notation of sport was “The inside game: the science of baseball” published by H.S. Fullerton at “The Amer-ican Magazine” (1912). The paper explored the combinations of baseball players batting, pitching and fielding and the probabilities of success. However, the first at-tempt to devise a specific notation system for sport analysis known by the experts was the research from Messersmith and Bucher “The Distance Traversed by Big Ten Basketball Players” (1939), who provided the reader with insights to the distances covered by basketball players during a college match.
Notation systems were commercialized for American football play-analysis around 1966 (Purdy, 1977) and the Washington Redskins were one of the first teams to use them in 1968 (Witzel, cited by Purdy, 1977). Paradoxically, American football is the only sport that has a ban on the use of computerized notation systems in the stadium as part of its rules.
spreadsheet database softwares, and the traditional sheets of paper are being re-placed by tablet computers.
Hand notation systems are very accurate in general terms, but they do have some disadvantages (Hughes & Franks, 2005):
1. The more sophisticated systems involve considerable learning time.
2. The amount of data that these systems produce can involve many man-hours of work in processing them into forms of output that are meaningful to the coach.
The use of computerized notation systems solves these disadvantages of us-ing hand notation systems and tackles satisfactorily the data processus-ing issues, in particular.
Used in real-time or post-event analysis in conjunction with video recordings, computerized notation systems enable immediate access to data. They also allow the sports scientist to present the data in graphical forms quickly understood by the coach and athlete. The sophistication and reduced cost of video systems have greatly enhanced the whole area of post-event feedback, and they can be used from playback with subjective analysis by a coach to detailed objective analysis by using notation systems.
The computerized notation systems have been used historically for four major purposes:
The information derived from this type of computerized notation systems can be used for several purposes, as suggested by Franks, Goodman, & Miller (1983b):
1. Immediate feedback.
2. Development of a database.
3. Indication of areas requiring improvement. 4. Evaluation.
5. As a mechanism for selective searching through a video recording of the game.
Therefore, notational analysis, and particularly the use of video, gives coaches a chance to record, observe, reflect and check performances accurately through the use of a tool that fascinates both themselves and athletes (Hughes M. , 2008).
USE OF COMPUTERIZED NOTATION SYSTEMS IN VOLLEYBALL DISCIPLINES.
Team sports have the potential to benefit immensely from the development of notational analysis and computerized notation, and volleyball disciplines are not an exception(Eom & Schutz, 1992a; Eom & Schutz, 1992b; Giatsis & Zahariadis, 2008; López-Martínez & Palao, 2009; Castro, Souza, & Mesquita, 2011; Marcelino, Mesqui-ta, & Sampaio, 2011). The sophistication of data manipulation procedures available would aid the coach in his efforts to enhance performance as to “increases in speed, accuracy, the efficiency of data recording and data reduction, providing a better un-derstanding of the game patterns and more precise assessments of the team and the players involved” (Eom & Schutz, 1992a).
nature of volleyball puts a lot of pressure on the human memory system, because only after a critical moment in the game does a previous event become significant (Hughes & Franks, 2005). As a result, processing all the events occurring throughout a match is really difficult without the use of some form of computer resource. To solve that prob-lem partially, most classical hand notation systems in volleyball selected certain skills as key factors of performance, ignoring the rest of them, and using simple numeri-cal snumeri-cales to assess the quality of skill execution. It was an effective, but certainly in-complete, way of assessing performance. Thus, until the introduction of performance analysis computerized systems, by logical limitations, it was difficult to improve the quantity and quality of information to be analyzed.
Some classical research in notational analysis in volleyball has been done in the past by using basic computerized systems (Eom H. J., 1988; Eom & Schutz, 1992a) and some computerized quantitative systems have been developed to assess performance analysis in volleyball (Handford & Smith, 1996). However, the tenden-cy in the use of these systems appears to have increased in recent scientific produc-tion, due to the emergence of some universalized advanced systems.
Today, the most widely used software for notational analysis in volleyball and beach volleyball is Data Volley from the Italian company Data Project. The program is used all over the world by many professional and national teams, statisticians and re-searchers to monitor volleyball games and to perform game-analysis (Marelic, Resetar, & Jankovic, 2004; Drikos, Kountouris, Laios, & Laios, 2009; Rodríguez-Ruiz, Quiroga, Miralles, Sarmiento, De Saá, & García-Manso, 2011). Virtually all the national teams par-ticipating in the top international competitions use Data Volley for performance analy-sis, becoming the gold-standard among the volleyball disciplines statistical softwares.
associa-tions like the F.I.V.B. or the C.E.V. Today, all the official statistics from the competi-tions coordinated by these organizacompeti-tions are created using Data Project software.
The software architecture is based on notational analysis principles and its use is not really complex once it is completely understood. As volleyball is divided in two phases (offense and defense) and each of these phases has some sequential actions, with skills occurring in a hierarchical order, each one of these skills is typed with a code by the operator. At the same time, every code is associated with a numer-ical score (using a scale from four to six numbers, depending on the evaluated skill) which ranks the skill execution.
[image:36.595.127.512.476.747.2]Data volley can be set up according to the operator requirements and abilities. People lacking experience will be able to analyze only a few basic technical skills, while experts will carry out a deep analysis in order to obtain a more in-depth and accurate understanding. Such deeper analyses require the use of a large number of codes, known as advanced or extended codes.
A perfect command of the software enables the possibility to perform the following advanced analyses:
1. Skill statistics: Detailed analysis of the skills of a player, or a team, of one or more rotations.
2. Zone analysis: Allows the evaluation of skills according to the zone where they were performed.
3. Service and attack directions: It is possible to study the attack direc-tions using starting and landing zones or cones.
4. Attack distribution: It is possible to check the efficiency and distri-bution of the different type of attacks according to the starting zone, rotation or previous type of reception.
5. Detail of last hit: The software enables the viewing of the effects of the players’ last hits divided by skill.
6. Play-by-play analysis: Trend analysis of the set or the match point by point with a graph to follow the score.
7. Total analysis: Deep analyses can be created using all the archive matches of the same team. This feature allows the creation of charts and graphs.
One additional software characteristic is the worksheet exportation, giving the user the possibility of using specific formulas and working with raw data in re-search statistical packages such as SPSS or SigmaPlot.
to a specific action or situation can be recalled easily, as well as edited with simple plots to outline the important aspects of the game. The professional version of the video software enables the use of multi-sequence viewing and montage customiza-tion. The montages can be exported to a wide variety of video formats that can be played on most media player software.
It is not difficult to find in the literature numerous research papers on volley-ball performance analysis, carried out using the aforementioned software package (Marelic, Resetar, & Jankovic, 2004; Zetou, Tsigilis, Moustakidis, & Komninakidou, 2006; Zetou, Moustakidis, Tsigilis, & Komninakidou, 2007; Drikos, Kountouris, Laios, & Laios, 2009; Rodríguez-Ruiz, Quiroga, Miralles, Sarmiento, De Saá, & García-Man-so, 2011) and some research based on beach volleyball (Yiannis & Panagiotis, 2005; Yiannis L. , 2008). All these studies were complemented with the use of statistical techniques to obtain the results, therefore computerized notational analysis was the basis for classifying and studying different performance factors.
Mesquita, Palao, Marcelino, & Afonso (2013) divide performance analy-sis research studies (using notational analyanaly-sis and statistical techniques) into two groups: descriptive and correlation-based research. Among the latter group emerges the most innovative research trend called predictive analysis. The most particular feature of predictive studies is the use of the more sophisticated statis-tical techniques such as discriminant, log-linear and logistics analysis to estab-lish non-linear relationships between performance factors. Their additional value is related to the predictive potential to regulate training and match performance while modelling player’s performance subject to the principles of more complex systems (Bar-Yam, 1997).
performance analysis sub-disciplines such as biomechanics or kinematics. It will be interesting to evaluate the impact that research with a multidisciplinary approach may have on the study field. This new approach may enable better understanding of the study object, or at least an interesting and new perspective that can contextual-ize our sport knowledge more satisfactorily.
Figure 6: Research focused on performance analysis in volleyball defined by Mesquita, Palao, Marcelino, & Afonso (2013).
OVERVIEW OF DISSERTATION
The ultimate goal of this Dissertation was to identify some critical aspects of the use of service in volleyball and beach volleyball according to the new perspec-tives in performance analysis and using notational analysis, inferential statistics and kinematics to achieve a more ecological approach to the field of study.
in practice, due to a lack of connection between research and applied training, all the sports scientific research loses its meaning.
Performance analysis has made huge progress and a large increase in sports scientific production since the 1990s. But current performance analysis methods have been questioned regarding a lack of harmony with the theoretical frameworks that provide the fundamental principles regulating performance achievement (Travassos, Davids, Araújo, & Esteves, 2013). To adapt better to those frameworks, Mesquita, Palao, Marcelino, & Afonso’s proposal (2013) is to identify non-linear in-teractions in notational analysis research, instead of establishing simple cause-and-effect relationships between performance factors. This leads to a more ecological approach, considering volleyball matches and competitions as a complex dynamical system. The use of more complex multi-variate analysis techniques prevents sport performance prediction from a lower ecological validity. Thus, studies under these new perspective escape from classical approaches in which linear relationship be-tween variables (and therefore, reductionist connections) were considered valid (Mesquita, Palao, Marcelino, & Afonso, 2013). A combined study of different per-formance factors also looks like a good option to better understanding of this new performance analysis paradigm.
Volleyball service has been traditionally considered one of the most import-ant skills in the sport, relating its production in the game to the achievement of an optimal competitive outcome. Incidentally, this importance has been evaluated con-sidering players and coaches’ perceptions or research based on statistical analysis uniquely. But what would happen if we combined the study of several performance factors in our analysis simultaneously? Would we get the same results?
increased ball speed. But although there are several studies that analyze the statis-tical impact on the game produced by the service action, and some others analyzing the biomechanical and kinematic characteristics of the performance of the service, to our knowledge there are no studies evaluating both issues at once.
This new perspective would be more valid, from a scientific point of view, as it would help to understand the behavior of service-receive systems and servers in a much more contextualized situation. The integrated use of kinematics and technical evaluation will allow us to confirm whether an excellent performance of the service actually has the impact that has been attributed to it in previous scientific experiences.
To assess the relationship between service speed and its direct effect on the op-ponent’s action is capital in providing coaches and practitioners with a more realistic approach to service strategies. This analysis can reveal if the generalized use of jump topspin services in high-level competitions, is rational from an empirical standpoint.
Our search will not only be based on the understanding of the service per-formance and its influence on the game in volleyball, but will also do so in beach volleyball. Although this is a discipline with many similarities to indoor volleyball, it also presents important differences. The particular playing surface, wind influ-ence, different court dimensions and especially, the reduced number of players are factors that lead us to attempt to find out more about the effect of the service in this discipline, discriminating the results from those obtained in volleyball re-search. Adding the rally outcome as a factor to better understand the effect of the service in the opponents’ actions can be crucial to our knowledge of the extent of the use of this technical skill.
differences in the competitive level between the best female players and the rest of the participants, lead us to think that further investigation on the service in this sport should include competitive ranking and gender as performance factors to be taken in consideration, in order to be more explanatory and evidence-based.
Additional information about the characteristics of service behavior throughout the ball’s trajectory to the opposite court would contribute to a complete understanding of the service performance. Typically, the study of the service in volleyball has been carried out putting greater emphasis on biome-chanical parameters, but to our knowledge, the kinematic study of the ball speed (ignoring the causes of motion) is a new approach and could have a greater im-pact on the real sport conditions. In a common volleyball situation, the technical and tactical behavior are anticipated or conditioned reactions to the trajectory of the ball. The system that generates the trajectory often becomes a secondary element of analysis. As a result, finding out some additional data related to the ball speed (such as the mechanical behavior of the different trajectories or the effect of the aerodynamic resistance on the ball) will provide more efficient mea-sures for assessing the effect of the service in play. To understand more closely the conditions in which the technical action of the reception takes place is an element of high interest and can improve deeply our understanding of the key factors in the success of this action.
Rigurous review with large volume of data, consistent samples and enough practical knowledge may allow us to evaluate the real impact of the use of service in high-level volleyball. Considering that most studies of this type do not use sta-tistical inference techniques, or they evaluate shorter competitions (with a low volume of registered services), a detailed study including advanced statistical in-ference techniques and employing large aggregates of data, would contribute to ou knowledge of the effect of this technical skill throughout a complete competi-tion. Techniques like binary or multinomial logistic regressions have been used recently in volleyball research for predictive analysis, but not many of these stud-ies have quantified and numerically solved the real impact on the result that these factors have in the game. Currently, some of these techniques make it possible and carrying out some research about it could be of great interest for top-level volley-ball coaches and players.
Knowing the particular significance that each of the elements of the game has will optimize the coaching and training processes, helping to minimize er-rors in the main skills and emphasizing the factors producing a greater effect on the outcome.
On many occasions, the interpretation of how the game has to be played lacks scientific evidence. Only with the proper use of analytics and performance analysis can we get clear and objective information to enable a better understanding of the game.
REFERENCES
Agelonidis, Y. (2004). The jump serve in volleyball: From oblivion to domi-nance. Journal of Human Movement Studies (47), 205-213.
Castro, J., Souza, A., & Mesquita, I. (2011). Attack efficacy in volleyball: elite male teams. Perceptual and Motor Skills (113), 395-408.
Drikos, S., Kountouris, P., Laios, A., & Laios, Y. (2009). Correlates of team per-formance in volleyball. International Journal of Perper-formance Analysis in Sport, 9 (2), 149-156.
Eom, H. J. (1988). A mathematical analysis of team performance in volleyball.
Canadian Journal of Sports Sciences (13), 55-56.
Eom, H. J., & Schutz, R. W. (1992a). Statistical analyses of volleyball team per-formance. Research Quarterly for Exercise and Sport, 63 (1), 11-18.
Eom, H. J., & Schutz, R. W. (1992b). Transition play in team performance of volleyball: a log-linear analysis. Research Quarterly for Exercise and Sport, 63 (3), 261-269.
Fellingham , G., Hinkle, L., & Hunter, I. (2013). Importance of attack speed in volleyball. Journal of Quantitative Analysis in Sport, 9 (1), 87-96.
Franks, I. M. (1993). The effects of experience on the detection and location of performance differences in a gymnastic technique. Research Quarterly for Exercise
and Sport, 64 (2), 227-231.
Franks, I. M. (2005). The need for feedback. En M. Hughes, & I. M. Franks (Eds.), Notational analysis of sports (pages 9-16). London: Routledge.
Franks, I. M., & Miller, G. (1986). Eyewitness testimony in sport. Journal of
Sport Behaviour (9), 39-45.
Franks, I. M., & Miller, G. (1991). Training coaches to observe and remember.
Journal of Sport Sciences, 9 (3), 285-297.
Franks, I. M., Goodman, D., & Miller, G. (March 1983a). Analysis of perfor-mance: qualitative or quantitative?. Sports.
Franks, I. M., Goodman, D., & Miller, G. (1983b). Human factors in sports sys-tems: An empirical investigation of events in team games. Proceedings of the Human
Factors Society - 27th Annual meeting (pages 383-386). Norfolk: Human Factors &
Fullerton, H. S. (1912). The inside game: the science of baseball. The American
Magazine (70), 2-13.
Giatsis, G., & Tzetzis, G. (2003). Comparison of performance for winning and losing beach volleyball teams on different court dimensions. International Journal of
Performance Analysis in Sport, 3 (1), 65-74.
Giatsis, G., & Zahariadis, P. (2008). Statistical analysis of men’s F.I.V.B. beach volley-ball team performance. International Journal of Performance Analysis in Sport, 8 (1), 31-43. Glazier, P. S. (2010). Game, set and match? Substantive issues and future di-rections in performance analysis. Sports Medicine, 40 (8), 625-634.
Handford, C., & Smith, N. C. (1996). Three touches and it’s over: addressing the problems of performance analysis in volleyball. In M. D. Hughes (Ed.), Notational
analysis of sport-I & II (pages 205-212). Cardiff: UWIC.
Hendry, D. T., & Hodges, N. J. (2013). Getting on the right-track. Athlete-cen-tred practice for expert performance in sport. En T. McGarry, P. O’Donoghue, & J. Sampaio, Routledge Handbook of Performance Analysis (pages 5-21). Abingdon, OX: Routledge.
Hughes, M. D., & Franks, I. M. (1997). Notational analysis of sport (Vol. 1). (M. D. Hughes, Ed.) Cardiff: UWIC.
Hughes, M. (2004). Notational analysis - a mathematical perspective.
Interna-tional Journal of Performance Analysis in Sport, 4 (2), 97-139.
Hughes, M. (2008). Notational analysis for coaches. In R. L. Jones, H. Mike, & K. Kingston (Eds.), An introduction to sports coaching. From science and theory to
practice (pages 101-113). Abingdon, OX: Routledge.
Hughes, M., & Bartlett, R. (2005). The use of performance indicators in per-formance analysis. In M. Hughes, & I. M. Franks (Eds.), Notational analysis of sport (pages 165-188). London: Routledge.
Katsikadelli, A. (1996). A comparative study of the attack serve in high-level volleyball tournaments. Journal of Human Movement Studies (30), 259-267.
Katsikadelli, A. (1998). Reception and the attack serve of the world’s leading volleyball teams. Journal of Human Movement Studies (34), 223-232.
Katsikadelli, A. (1998). The evolution of serve tactics of the world’s leading volleyball teams. Coaching and Sport Science Journal (3), 21-24.
López-Martínez, A. B., & Palao, J. M. (2009). Effect on serve execution on serve efficacy in men’s and women’s beach volleyball. International Journal of Applied
Sports Sciences, 21 (1), 1-16.
Marcelino, R., Mesquita, I., & Sampaio, J. (2011). Effects of quality of oppo-sition and match status on technical and tactical performances in elite volleyball.
Journal of Sport Sciences, 29 (7), 733-741.
Marelic, N., Resetar, T., & Jankovic, V. (2004). Discriminant analysis of the sets won and the sets lost by one team in A1 Italian volleyball league - A case study.
Kine-siology, 36 (1), 75-82.
McGarry, T., O’Donoghue, P., & Sampaio, J. (2013). Routledge handbook of
sports performance analysis. Abingdon, OX: Routledge.
McGown, C., Fronske, H., & Moser, L. (2001). Coaching volleyball. Building a
winning team. Needham Heights, MA, USA: Allyn & Bacon.
Mesquita, I., Palao, J. M., Marcelino, R., & Afonso, J. (2013). Indoor volleyball and beach volleyball. In Routledge Handbook of Sports Performance Analysis (pages 367-380). Abingdon, OX: Routledge.
Messersmith, L. L., & Bucher, C. C. (1939). The distance traversed by Big-Ten basketball players. Research Quarterly, 10 (1), 61-62.
Monteiro, R., Mesquita, I., & Marcelino, R. (2009). Relationship between the set outcome and the dig and attack efficacy in elite male volleyball game.
Interna-tional Journal of Performance Analysis in Sport, 9 (3), 294-305.
Palao, J. M., Santos, J. A., & Ureña, A. (2004). Effect of team level on skill per-formance in volleyball. International Journal of Perper-formance Analysis in Sport, 4 (2), 50-60.
Palao, J. M., Valades, D., & Ortega, E. (2012). Match duration and number of rallies in men’s and women’s 2000-2010 FIVB World Tour beach volleyball. Journal
of Human Kinetics (34), 99-104.
Papageorgiou, A., & Spitzley, W. (2003). Handbook for competitive volleyball. Oxford: Meyer & Meyer Sport.
Patsiaouras, A., Moustakidis, A., Charitonidis, K., & Kokaridas, D. (2011). Tech-nical skills leading in winning or losing volleyball matches during Beijing Olympic Games. Journal of Physical Education and Sport, 11 (2), 39-42.
Purdy, J. G. (1977). Computers and sports: From football play analysis to the Olympic Games. En S. P. Ladany, & R. E. Machol (Eds.), Optimal strategies in Sports (pages 196-205). Amsterdam: North Holland.
Quiroga, M., García-Manso, J. M., Rodríguez-Ruiz, D., Sarmiento, S., De Saa, Y., & Moreno, M. P. (2010). Relation between in-game role and service characteristics in elite women’s volleyball. Journal of Strength and Conditioning Research, 29 (9), 2316-2321.
Rodríguez-Ruiz, D., Quiroga, M., Miralles, J. A., Sarmiento, S., De Saá, Y., & García-Manso, J. M. (2011). Study of the technical and tactical variables determining set win or loss in top-level European men’s volleyball. International Journal of
Per-formance Analysis in Sport, 7 (1).
Shondell, D., & Reynaud, C. (Eds.). (2002). The volleyball coaching bible. Cham-paign, IL, USA: Human Kinetics.
Strohmeyer, H. S. (1988). An analysis of selected cinematographic and
descrip-tive variables in the jump and conventional overhand serves of the United States Olym-pic athletes. Wyoming, USA: University of Wyoming.
The London Organising Committee of the Olympic Games. (s.f.). Men’s and
women’s volleyball competition statistics. Retrieved March 15 2013, from London
Travassos, B., Davids, K., Araújo, D., & Esteves, P. T. (2013). Performance anal-ysis in team sports: advances from an ecological dynamics approach. International
Journal of Performance Analysis in Sport, 13 (1), 83-95.
U.S.A. Volleyball (Ed.). (2009). Volleyball systems & strategies. Champaign, IL, USA: Human Kinetics.
Wise, M. (2002). Serving. En D. Shondell, & C. Reynaud (Eds.), The volleyball
coaching bible (pages 163-175). Champaign, IL, USA: Human Kinetics.
Yiannis, L. (2008). Comparison of the basic characteristics of men’s and wom-en’s beach volley from the Athens 2004 Olympics. International Journal of
Perfor-mance Analysis in Sport, 8 (3), 130-137.
Yiannis, L., & Panagiotis, K. (2005). Evolution in men’s volleyball skills and tactics as evidenced in the Athens 2004 Olympic Games. International Journal of
Per-formance Analysis in Sport (5), 1-8.
Zetou, E., Moustakidis, A., Tsigilis, A., & Komninakidou, A. (2007). Does effec-tiveness of skill in complex I predict win in men’s olympic volleyball games?
Interna-tional Journal of Performance Analysis in Sport, 3 (4).
Zetou, E., Tsigilis, N., Moustakidis, A., & Komninakidou, A. (2006). Playing characteristics of men’s olympic volleyball teams in complex II. International Journal
CHAPTER 2
A COMPARATIVE STUDY BETWEEN SERVE MODE AND SPEED AND ITS EFFECTIVE-NESS IN A HIGH-LEVEL VOLLEYBALL TOURNAMENT
AUTHORS: Gerard Moras1, Bernat Buscà2, Javier Peña3, Sergio Rodríguez1, Lisímaco
Vallejo1, Julio Tous-Fajardo1, Iñigo Mújika4.
1National Institute of Physical Education of Catalonia. Barcelona, Spain.
2Ramon Llull University. Barcelona, Spain.
3University of Vic. Barcelona, Spain.
4Athletic Club Bilbao. Bilbao, Spain.
PUBLISHED: Journal of Sports Medicine and Physical Fitness (2008). Volume 48, number 1, pages 31-36.
PMID: 18212707
ABSTRACT
Aim. This study carries out a comparative analysis between service mode and speed and its effectiveness at the 2004 Men’s Olympic Qualification Tournament.
Methods. A total of 377 services were analyzed, 124 of which belonged to Cuba vs. Holland, 63 to Spain vs. Cameroon, 100 to Spain vs. Cuba, and 91 to Holland vs. Cameroon. Speed services were recorded using a tripod mounted radar gun.
Results. The analysis has shown the predominance of jump service (JUMP, 84.9%) compared with float service with jump (FLOAT JUMP, 9.5%) and float ser-vice (FLOAT, 5.6%). Only 25.3% of the total jump serser-vices analyzed was successfully stricken back making the first tempo attack possible. The respective percentages for FLOAT JUMP and FLOAT were 42.9% and 55.6%. Ball speed in JUMP (23.03 ± 3.94 m·s-1) was markedly higher compared with FLOAT JUMP and FLOAT (12.05 ± 3.44
m·s-1 and 11.47 ± 4.22 m·s-1). While negative outcomes (66.7%) in FLOAT stand out,
a better balance between negative and positive outcomes were found in both JUMP (50%) and FLOAT JUMP (42.9%). However, no relationship was found between ser-vice speed and its effectiveness outcome (R2=0 in the overall sample and R2=0.005,
when pooling the 5 service effectiveness categories into negative and positive out-comes. In fact, JUMP is mainly performed in the span of velocities between 23.06 and 28.06 m·s-1 in both error and direct point categories.
Conclusion. We found no significant relationship between service velocity and a better outcome related to effectiveness. In addition, JUMP and FLOAT JUMP present a better balance between negative and positive outcomes compared with FLOAT.
INTRODUCTION
could be differentiated: float service, float service with jump and jump service. During the 90’s and up to the present day, jump service has become increasingly relevant in high-level volleyball. From 1992 to 2002 the execution of jump service in high-lev-el volleyball tournaments rose from 20.8% to 99.2% (Aghigh-lev-elonidis, 2004). Katsikadhigh-lev-elli (1996) observed that in the 1992 European Championship the overall percentage of the attack services executed with jump was 75%. Two years later, in the 1994 World Championship this percentage increased to 85.3%. The same author later undertook a tactical analysis on reception and service using data from the 1994 World Champion-ship final and the 1995 European ChampionChampion-ship final (1998) and was observed that attack service with a jump represented 84.2% and 90.3% of all services, respectively.
Although jump service has a higher failure percentage than other service styles (Katsikadelli, 1997) all high-level teams seem to accept the high risk of error related to this style. One out of 5 jump services goes to the net or out of play, while the ratio for the other modest services is about 1 out of 12 (Agelonidis, 2004). Therefore, the success of the jump service cannot be exclusively considered in light of the number of won aces or even the number of services at which the opponents cannot respond with an attack. Thus, the key point is not the direct benefit likely to be obtained, but what can be avoided through it (Agelonidis, 2004). It has been statistically proven in high-level volleyball that attack is a better predictor of team success than defense (Eom & Schutz, 1992). On the other hand, there seems to be no improving tendency of the blocking strategies (Kat-sikadelli, 1997). Hence, it seems that the team on the service has no other choice than trying to complicate as much as possible the opponent’s reception (Mose, 1982).
Another studied aspect has been the mean flight time of the ball. When compar-ing service tactics of the competcompar-ing teams at the 1992 European Championship and 1994 World Championship, big differences were observed in mean flight time between jump and no jump services. Jump services took less mean flight time. Consequently, it was stated that mean flight time can be used as a measure for classification and assessment (Katsikadelli, 1996). In this respect, Selinger (1992) stated that the important factor that gives the jump service the edge over all other kinds of services is the minimization of the opponent’s reaction time in reception. According to Strohmeyer (1996) the jump service gives a team an advantage because the higher velocities of the ball give defense less time to react to the ball’s flight path.
Both authors underline the increasing use of jump service in present-day high-level volleyball. Related to this, Katsikadelli (1998) observed that the flight times of the jump services of the two finalists in the 1994 World Championship (Italy and Holland), were significantly lower (P<0.05) than the ones of all the other teams.
METHODS
VOLLEYBALL TOURNAMENT
We chose for this purpose the 2004 Men’s Olympic Qualification Tournament, held in Madrid (Spain) on 28th-30th May, at the Rocódromo de la Casa de Campo,
be-tween the national teams of Cuba, Spain, Holland and Cameroon. The total number of services analyzed were 377, 124 of which belonged to Cuba vs. Holland, 63 to Spain vs. Cameroon, 100 to Spain vs. Cuba, and 91 to Holland vs. Cameroon.
DATA RECORDING
Service velocities were recorded using a tripod mounted radar gun (Stalk-er Pro, Radar Sales Incorporated, Minneapolis, U.S.A.), with an accuracy ±0.1 MPH,
[image:55.595.233.511.549.737.2]speed range 1-300 MPH, 1-480 KPH, and Target Acquisition Time: 0.01 Sec. The radar gun was connected to the portable computer. The Stalker ATS software program re-cords the speed data, assigns time information, and then calculates distance and accel-eration values for each data sample. The radar gun was positioned behind the court, 6 m behind the rear line and at 3 m of height to achieve an accurate recording (fig. 7)
With the frantic pace of the match it was only possible to record and save one out of two alternative services. At the same time lost services in net were not taken into consideration in this article because only those services which allowed interac-tion with the defense where considered.
TYPES OF SERVICES
The services were coded as: FLOAT= Float service, FLOAT JUMP= Float ser-vice with jump, JUMP=Jump serser-vice.
Specifically, in JUMP the player starts from some distance behind the line and throws the ball up and forward and at the same time runs forward, jumps at the end line, meets the ball in the air and executes a spike. In FLOAT the player hits the ball standing on the floor from some distance behind the line or at the end line. He throws the ball up and drives his hand into the ball. In FLOAT JUMP, player starts from some distance behind the line and throws the ball up and forward and at the same time runs forward. Jumps at the end line, meets the ball in the air and drives his hand hard into the ball and abruptly stops it. The ball should not spin. This cre-ates a float effect by keeping the ball from spinning.
VALUE CATEGORIES
STATISTICAL ANALYSIS
Statistical data processing was performed using the statistical pack SPSS vs. 13.0. Statistical analysis was performed using an analysis of variance (ANOVA) and regression. The programmed significance level was P≤0.05. Outcome is presented by the mean and standard deviation.
RESULTS
[image:57.595.230.511.397.582.2]Figure 8 shows the quantitative distribution of each mode of service. The pro-portion of JUMP was 84.9%, FLOAT 9.5%, and FLOAT JUMP 5.6%. Table 2-1 shows the overall distribution of services related to service effectiveness.
Table 2-1: Service types vs. value categories.
Mean velocities were significantly higher for JUMP (23.03±3.94 m·s-1)
com-pared with FLOAT (12.05±3.44 m·s-1), and FLOAT JUMP (11.47±4.22 m·s-1).
No significant relationship was found between service velocity and a better outcome related to effectiveness (R2=0 in the overall sample and R2=0.005, when
pooling the 5 service effectiveness categories into two groups: negative outcome (= and −) and positive outcome (/ , +, #)).
Concerning distribution of JUMP services with ‘=’ and ‘#’ in rank velocity val-ues, the highest service percentage is found, in both cases, in the span of velocities between 23.06 and 28.06 m·s-1 (Table 2-2).
Value categories Kind of serve 1
Error (=) 2 Perfect reception (-) 3 Neuter (/) 4 Does not allow
first-tempo attack (+) 5 Direct Point (#) Total A Float serve Total serves % of kind of serve % of effectiveness % of the total
4 11.1% 4.8% 1.1% 20 55.6% 18.2% 5.3% 2 5.6% 11.1% 5% 9 25% 6.6% 2.4% 1 2.8% 3.4% 3% 36 100% 9.5% 9.5% B Float serve with jump Total serves % of kind of serve % of effectiveness % of the total
0 0.0% 0.0% 0.0% 9 42.9% 8.2% 2.4% 0 0.0% 0.0% 0.0% 12 57.1% 8.8% 3.2% 0 0.0% 0.0% 0.0% 21 100% 5.6% 5.6% C Jump serve Total serves % of kind of serve % of effectiveness % of the total
79 24.7% 95.2% 21.0% 81 25.3% 73.6% 21.5% 16 5% 88.9% 4.2% 116 36.3% 84.7% 30.8% 28 8.8% 96.6% 7.4% 320 100% 84.9% 84.9% Total Total serves % of kind of serve % of effectiveness % of the total
83 22% 100% 22% 110 29.2% 100% 29.2% 18 4.8% 100% 4.8% 137 36.3% 100% 36.3% 29 7.7% 100% 7.7% 377 100% 100% 100%
Table 2-2: Jump service distribution with a value ‘=’ (error) and ‘#’ (direct point) in velocity ranks.
DISCUSSION
The volleyball service is a complex skill that may vary due to individual needs, capabilities, and match situation. Effectiveness of this action appears to be a determinant factor in the outcome of a given game. Thus, at a high-level, the player may choose to produce a high ball velocity to restrain the attacking capabilities of the opponents. However, no research has evaluated the poten-tial relationship between service speed and effectiveness. The major finding of this study is that no significant relationship was found between service velocity and a better outcome related to effectiveness. In addition, from the three service styles JUMP and FLOAT JUMP has resulted as the best options compared with FLOAT. As expected, we have found a greater predominance of jump service in high-level volleyball. These results are in agreement with those found in oth-er studies during the last decade (Katsikadelli, 1996; Katsikadelli, 1997; Kat-sikadelli, 1998; Agelonidis, 2004). To the best of our knowledge, this is the first study to analyze service mode and speed in a real elite-level competition.
Maximum velocity (m·s-1) n (=) % total
Value ‘=’
8.06 – 13.06 0 0%
13.06 – 18.06 1 1.3%
18.06 – 23.06 16 20.3%
23.06 – 28.06 54 68.4%
28.06 + 8 10.1%
Total 79 100%
Value ‘#’
8.06 – 13.06 0 0%
13.06 – 18.06 3 10.7%
18.06 – 23.06 5 17.9%
23.06 – 28.06 17 60.7%
28.06 + 3 10.7%
From the results in table 2-1 it may be argued that jump service benefits should not be analyzed only from the point of view of winning points because only 8.8% of JUMP obtained an ace, compared with a 24.7% of direct errors. Therefore, performing a jump service can be considered as a high risk of error action. Specifi-cally, 1 out of 4 jump services was an error, while as for the other kinds of services the failure ratio was about 1 out of 14.
On the other hand, jump service seems to be the perfect weapon to avoid first time chances of attack from the opponents. Only 25.3% of the total JUMP services were received in perfect conditions, i.e. allowing first time attack, while for the oth-er types of soth-ervices, the proportion was 42.9% (FLOAT JUMP) and 55.6% (FLOAT) which is similar to values found by Agelonidis (2004). These results could be ex-plained by either the high ball speed attained in JUMP that may give the receivers <0.5 s to react (Katsikadelli, 1996) or to the often use of a heavy topspin which also makes it more difficult for the opponents to control the ball.
We must also underline the high percentage of FLOAT JUMP which did not allow for a first time attack (57.1%) which, a priori, does not correspond with the theoretical difficulty of reception, knowing that its mean velocity is practically the same as in FLOAT. Clearly, the faking factor inherent in FLOAT JUMP explains these results and justifies its use due to its high positive outcome and small number of errors. However, we must also take into account that the number of this type of ser-vices analyzed in this study is small.
Higher velocity services do not mean, a priori, better effectiveness. In fact, from the missed 79 jump services, 68.4% corresponded to high velocities between 23.06 and 28.06 m·s-1. Thus, it appears that the higher the velocity of the ball the higher the risk
closer to those reported during the spiking action in high-level players (approximately 27-28 m·s-1) (Coleman, 1993; Forthomme, Croisier, Ciccarone, Crielaard, & Cloes, 2005).
This was unsurprising, given the similarities between the two actions. Therefore, if service velocity alone is not in itself a determinant of effectiveness, delivering the ball to problematic or high complex court zones for the receptors could be the clue. In this sense Gambardella (1982) pointed out that an offensive service must contain three important features: velocity, movement, and placement. The results obtained in our study allows us to justify the wide use of JUMP compared to FLOAT if we pool the five effectiveness categories in two effectiveness groups: positive outcome (/, + and #) and negative outcome (− and =). In doing so, JUMP shows a balance between negative and positive outcomes, but in FLOAT the proportion is 66.7% and 33.4% respectively. Specifically, this higher percentage of positive outcome found in JUMP makes it the best option despite the high percentage of possible errors. As for FLOAT JUMP, its outcome comes near the JUMP. In this case, though, effectiveness registers of ‘=’ and ‘#’, and in the category ‘/’ were not obtained. Specifically, it was found a 42.9% for ‘–’ effectiveness category and a 57.1% in ‘+’ effectiveness category.
A potential limitation of the study is the inability to register all the services in the analyzed matches due to the frantic pace of the matches. However, the obtained results are similar to those found in earlier studies and seem to be representative of elite-level competition.
Although failed in net services ‘=’ effectiveness value were not registered, we consider that bias in the obtained results is of a minor importance because of the small frequency of this kind of services. However, percentages obtained in the differ-ent categories are again similar to those obtained by other authors.