C
C
|
E
E
|
D
D
|
L
L
|
A
A
|
S
S
Centro de Estudios
Distributivos, Laborales y Sociales
Maestría en Economía Universidad Nacional de La Plata
Argentina's Distributional Failure: The role of
Integration and Public Policies
Leonardo Gasparini
Argentina’s Distributional Failure
The role of Integration and Public Policies
#Leonardo Gasparini
CEDLAS, Universidad Nacional de La Plata *
Abstract
This paper documents the income distribution changes experienced by Argentina during the last decades. Inequality substantially increased, and despite economic growth during some periods, poverty also went significantly up. Two types of episodes have shaped Argentina’s income distribution: deep macroeconomic crisis and periods of openness and integration. The sizeable raise in inequality in the 90s seems to be associated to reallocations against unskilled-labor intensive sectors, and especially to skilled-biased technological change within most sectors, both factors stimulated by the process of economic integration. The depth and speed of the reforms and the absence of public policies to ease the transition contributed to the particular severity of the income distribution changes in Argentina.
JEL Classification: C15, D31, I21, J23, J31
Keywords: inequality, distribution, globalization, integration, wages, education, Argentina
#
Paper prepared for the Labor Markets and Globalization Conference, Inter-American Development Bank Brasilia, October 20, 2003.
*
Centro de Estudios Distributivos, Laborales y Sociales (CEDLAS)-Universidad Nacional de La Plata
(UNLP). E-mail: leonardo@depeco.econo.unlp.edu.ar. The author wants to thank Mariana Marchionni,
1.
Introduction
Argentina was traditionally one of the most equal economies in Latin America. The available evidence shows low and stable inequality in the country in the three decades following the World War II, with poverty indexes not far from the ones in the developed countries (Altimir, 1986; Gasparini, 1999; WIDER, 2000). The story for the following three decades is completely different. From mid 70s to the present Argentina witnessed distributional changes that dramatically increased inequality and poverty, which now reach
values close to the Latin American averages (Lee, 2000; Gasparini et al., 2001; Altimir et
al., 2002). The Gini coefficient for the distribution of household per capita income
increased from 34.5 in 1974 to 53.8 in 2002, while the poverty headcount ratio increased from around 5% to more than 50% in the same period. There are no countries in Latin America and the Caribbean that experienced such dramatic changes in the income distribution.
Inequality has not increased steadily during this period. It is possible to identify two types of episodes that shaped the income distribution: macroeconomic crisis (88-89 and 01-02), and periods of increased integration (late 70s and most of the 90s). The distributional impacts of the macroeconomic crises were stronger, although of a shorter duration. Periods of economic openness are associated to changes in the economic structure against unskilled-labor intensive sectors, and to skilled-biased technological change. Both phenomena have reduced the relative demand for unskilled labor, decreasing employment and wages for this group, which has translated into higher inequality and poverty.
This paper scrutinizes income distribution changes in Argentina, stressing the links between the process of integration to the world economy and the growth of inequality and poverty. The study presents alternative explanations of the distributional patterns observed in Argentina and assesses their relative importance in the light of the economic theory and the available empirical evidence. The paper argues that although integration may certainly increase inequality in the short and medium run for countries like Argentina, the government can smooth the transition. Failing to do that, as in the Argentine case, may place the whole process of integration and liberalization into doubt and risk.
2. Distributional changes in Argentina
Distributional changes can be traced with the help of the Encuesta Permanente de Hogares (EPH), the main household survey in Argentina. The EPH is conducted each May and October by the Instituto Nacional de Estadística y Censos (INDEC). It now covers 31 urban areas which are home of 75% of the Argentine urban population, which in turn represents
85% of Argentina’s total population.1 The number of observations of each survey is around
80,000. The EPH gathers information on individual sociodemographic characteristics, employment status, hours of work, wages, incomes, type of job, education, and migration status. The EPH is available for the Greater Buenos Aires (GBA) since 1974. The rest of the urban areas have been added during the last two decades.
Income inequality has significantly increased since the 70s (see Figure 2.1). The Gini coefficient for the distribution of equivalized household income in Greater Buenos Aires
climbed from 0.324 in 1974 to 0.518 in 2003.2 Inequality greatly increased in the second
half of the 70s, remained stable in the first half of the 80s and substantially increased during the macoeconomic crisis of the late 80s. After stabilization, inequality went down, although did not reach the pre-crisis levels. The 90s were again times of increasing inequality: the Gini climbed 6 points from 1992 to 1998. The recent macroeconomic crisis of 2001-2002 pushed the Gini another 4 points up.
The rest of this section is aimed at showing (i) that the pattern of Figure 2.1 is robust to various methodological considerations, (ii) that the increase in inequality suffered by Argentina is very large compared to changes experienced in other Latin American countries, and (iii) that it was large enough to have had dramatic consequences on poverty and welfare. We finally show estimates of polarization and mobility, two distributional dimensions closely related to inequality.
2.1. Robustness to measures, variables and geographical areas
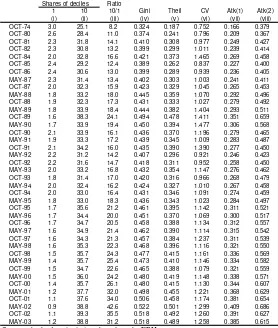
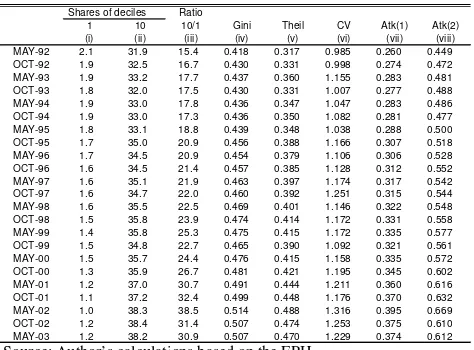
Table 2.1 shows various inequality indices for the distribution of equivalized household income in the GBA. All measures suggest the increasing pattern shown in Figure 2.1. The reported inequality growth is even larger for indices attaching greater weights to the bottom
tail of the distribution (e.g. Atkinson with inequality-aversion parameter equal to 2). The
poor have significantly lost in relative terms: the share of the poorest decile fell from 3% in
1
Although the EPH does not meet one of the Deininger and Squire (1996) criteria since it is an urban survey, it represents a very large share of Argentina’s population. Additionally, the missing population does not seem to affect many results. For instance, using a recent survey conducted by the World Bank that include rural areas, we find only a negligible difference in all inequality measures when we include or ignore rural areas.
2
1974 to 1.2% in 2003, while the income ratio between the two extreme deciles rose from 8 to more than 30 in three decades.
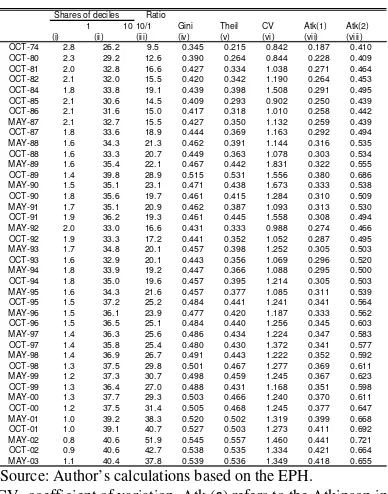
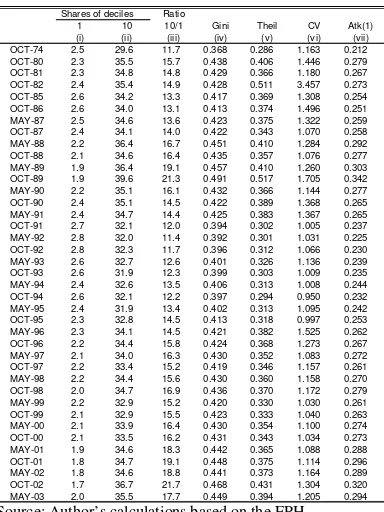
The inequality patterns are similar when considering other measures of household income
(e.g. household per capita income in Table 2.2), or individual labor income variables (e.g.
earnings in Table 2.3 and hourly wages in Table 2.4). The increase in wage inequality was not as large as the increase in household income inequality, but anyway substantial: while the Gini for the equivalized household income distribution climbed 19 points between 1974 and 2002, the increase for the hourly earnings distribution was 10 Gini points.
In part of the following analysis we select six particular years: 1974, 1980, 1986, 1992, 1998 and 2002. These years allow defining five sub-periods of the same length (with the exception of the last one) and represent years of macroeconomic stability, relative to the
Argentine standards.3 Of course, all years have some peculiarities that make them
non-strictly comparable, but it should be noticed that the distribution appears to be rather stable
around those selected years.4 Table 2.5 shows changes in inequality measures in the five
sub-periods. For most measures the greater increase was between 1992 and 1998, followed by 1998-2002 or 1974-1980, depending on the index. Note that in the 80s household inequality increased, while earnings and wage dispersion went down.
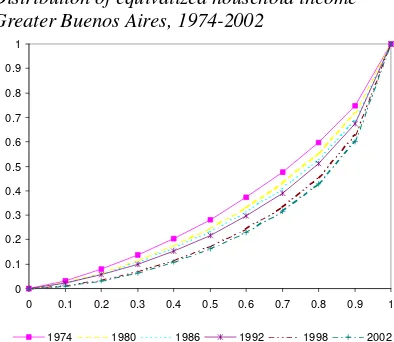
Lorenz dominance analysis confirms the increasing pattern in inequality. From all the possible combinations of the six selected years by pairs, in all but 1980-1986 there is Lorenz dominance of the first year over the second for the distribution of equivalized household income. Figure 2.2 shows that the Lorenz curves for the six selected years do not
cross.5 The graph is illustrative of the greater distributional shift during the 90s. The
estimated density functions of Figure 2.3 are also clear in showing strong distributional movements. The densities have become progressively flatter with a thicker left tail, implying higher inequality and poverty.
So far all statistics refer to the GBA, since the EPH was initially conducted only in that area, and slowly extended to other urban areas. Table 2.6 shows statistics for the aggregate of 28 urban areas covered by the EPH, but restricting the analysis to 1992-2003. The increasing pattern shown for GBA in Figure 2.1 is also noticeable for all urban Argentina. Notice that the increase in inequality in the 90s was somewhat higher in GBA: while the Gini for the distribution of equivalized household income grew 10 points in that city
between 1992 and 2002, the increase was 8 points for the aggregate of all urban areas.6
In Table 2.7 we show the Gini coefficient for the distribution of several household income variables both in GBA and Argentina for selected years. Columns (i) to (v) consider different adult equivalent scales, column (vi) restricts income to labor sources, column (vii) considers total household income without adjusting for family size, while columns (viii) to
3
In October 2002 the macroeconomic crisis of 2001-2002 seemed to have ended.
4
With data taken from Altimir (1986), Gasparini (1999) reports Ginis for the 50s and 60s similar to that of 1974.
5
Lorenz curves for 1980-1986 cross at the bottom tail, but that cannot be seen in the graph.
6
(xi) restrict the analysis to people in the same age bracket to control for life-cycle factors. Results do not significantly differ from the ones depicted in Figure 2.1.
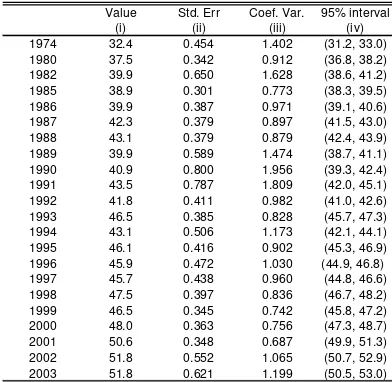
All previous inequality measures are computed from the EPH, which is a sample of the
population. Measures are then subject to the sample variability problem. In Table 2.8 we show standard errors for the Gini coefficients of the equivalized household income
distribution in GBA.7 Although changes between (especially subsequent) years are not
always statistically significant, the inequality pattern is quite robust to the sample variability problem.
2.2. Argentina in Latin America
Argentina has traditionally been one of the most equal countries in Latin America, along with Costa Rica and Uruguay (Londoño and Székely, 2000). The presence of a large middle-class was a distinctive feature of Argentina’s economy. Figure 2.4 shows the Gini coefficient for the distribution of equivalized income for most Latin American economies. In the early 90s and despite 15 years of increasing inequality, Argentina remained as one of the low-inequality countries in the region.
The Argentina’s distributional story in the last decade was substantially different from that of the rest of the region. Although inequality increased in many countries, especially in
South America, changes have been small compared to the ones experienced by Argentina.8
The second panel of Figure 2.4 suggests that Argentina no longer belongs to the low-inequality group within LAC. It is interesting the comparison with Uruguay: once almost identical, the distributions of these two neighbor countries are now clearly different, after three decades of relative distributional stability in Uruguay and turbulence in Argentina.
2.3. Poverty
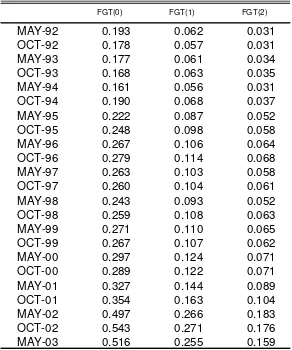
The distributional changes reported so far had profound consequences in terms of poverty. Figure 2.5 shows the poverty headcount ratio for the GBA area. While poverty was close to developed-countries records in 1980, it reached developing-countries figures by 2002. Poverty slowly increased during the first half of the 80s, and skyrocketed during the hyperinflation crisis. After a sharp fall in the early 90s, the poverty headcount ratio increased from 18% to 26% between 1992 and 1998, despite strong economic growth. The recent crisis generated an unprecedented increase in poverty that reached more than 50%. Although it is likely that most of this increase will be undone as the economy overcome the
crisis,9 the headcount ratio would still be at very high levels compared to historical records,
and considering Argentina’s economic potential, and even current levels of GDP. Notice from Table 2.9 that the increase in poverty is even deeper when considering not only the number of individuals below the poverty line (FGT(0) or headcount ratio), but also their
7
Standard errors and confidence interval are computed by bootstrapping techniques. Standard errors for other indices are available from the author upon request.
8
The raise in the Gini in Argentina was almost double the one in Venezuela, which ranks second according to inequality increases (Gasparini, 2003).
9
income relative to the poverty line (FGT(1) and (FGT(2)). The increase in poverty is not a phenomenon restricted to the Greater Buenos Aires area. Gasparini (2002) reports similar increasing poverty patterns for most urban areas since 1992.
2.4. Aggregate welfare
Despite the raise in inequality, aggregate welfare may increase if, for instance, income goes up for all quantiles of the distribution. By showing growth-incidence curves Figure 2.6
suggests that in none of the analyzed periods that was the case.10 Actually, real income fell
for the bottom percentiles of the equivalized household income distribution in all the 5 periods considered. All the growth-incidence curves have a positive “slope”, indicating non-poor growth. Table 2.10 shows the average growth-rates by quintile and reinforces the idea of unbalanced growth. The poor have performed worse than the rich both in expansions and in recessions.
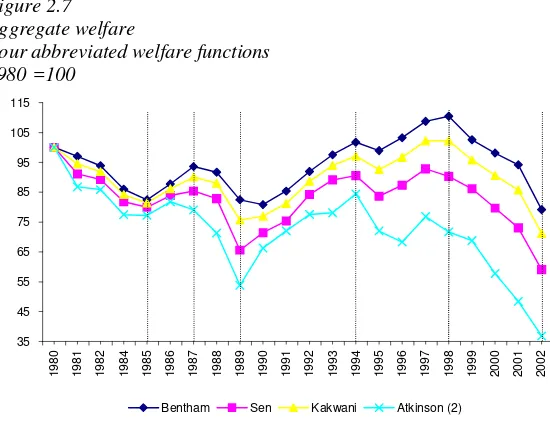
Figure 2.7 shows the value of aggregate welfare for different functions, setting 1980=100. All functions report a substantial welfare fall during the “lost decade” of the 80s, due to the decrease in mean income and the unequalizing distributional changes of the late 80s. Welfare unambiguously increased in the first half of the 90s (at least for the value judgments implicit in the functions considered in the Figure), fueled by strong growth, and despite the raise in inequality. The period 1994-1998 is interesting, since mean income moderately increased and the distribution became substantially more unequal. These movements generate divergent patterns in the assessment of welfare according to different
value judgments. While for an inequality-indifferent value judgment (labeled as Bentham in
the Figure) welfare increased in that period, for those value judgments attaching more
weight to the bottom tail of the distribution (e.g. Atkinson (2)), welfare substantially
decreased. The recent recession and crisis period 1999-2002 does not generate any discrepancy: as income fell and the distribution became more unequal aggregate welfare dramatically decreased for any function considered.
It is interesting to stress the relevance that the attitudes toward inequality have in the views of the economy. Figure 2.7 shows that while the assessment of the performance of the Argentina’s economy during the 90s was clearly positive for someone indifferent to inequality considerations, the evaluation for other value judgments was neutral, and for some other clearly negative.
2.5. Polarization and mobility
Polarization and mobility are two other dimensions of equity that have recently received attention in the literature. Polarization refers to homogeneous clusters that antagonize each other. Table 2.11 shows the Wolfson (1994) and Esteban, Gradín and Ray (1999) indices of bipolarization for GBA 1974-2002, and Argentina 1992-2002. Polarization and inequality can go in different directions. This was not the case in Argentina, where the distribution became more unequal and more polarized at the same time.
10
Inequality may be seen as not so disturbing when mobility is high or at least increasing. A
mobility study ideally requires panel data, which is absent in the Argentine case.11 Table
2.12 reports results for educational mobility - an imperfect substitute of a living-standards mobility study. Following Andersen (2001) we show an educational mobility index, defined as 1 minus the proportion of the variance of the schooling gap that is explained by family background (parental education and income), where the schooling gap measures years of missing education. According to table 2.12 there are no signs of increasing educational mobility in the country in the last three decades.
3. Exploring the direct determinants of distributional changes
Income measured in the EPH, as in most household surveys, comes mostly from labor sources. Returns to capital, benefits and rents were surely modified by all the economic changes that Argentina has gone through. However, their distributional impact is not well captured in the statistics, since these income sources are seriously under-reported. In this
section we explore the direct determinants of changes in the distribution of household labor
income in GBA.12 We start by looking at the results of simple wage equations.
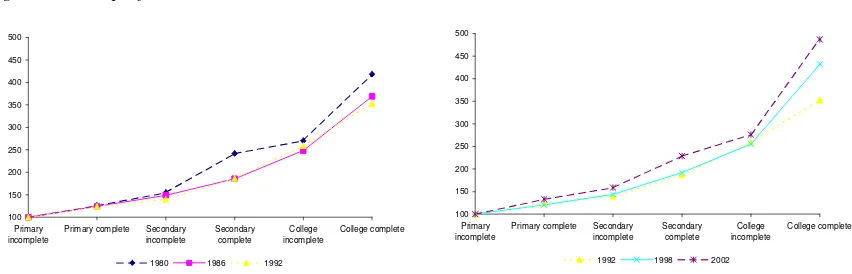
Figure 3.1 shows the wage-education profiles that results from estimating Mincer equations controlling for sample selection. Each line indicates for different educational levels the expected hourly wage for a male household head, aged 40, married, with two children, and not attending school. Returns to education are always positive. Returns decreased for secondary and college graduates between 1980 and 1986, and remained remarkable constant, when comparing 1986 and 1992. In contrast, the second panel of the Figure shows a substantial convexification of the wage-education profile in the 90s, which implies a widening wage gap, particularly between college-educated people and the rest.
The Mincer equations reveal another relevant phenomenon: the dispersion of the residual term remained rather constant in the 80s, while it became substantially increasing in the last decade. Figure 3.2 documents this fact by showing the standard deviation of the error term for regressions of hourly wages for household heads, spouses and other persons in the household. The increasing dispersion in the unobservables has been interpreted in the literature as an increase in the returns to some unobserved productive “assets” in the labor market, like ability, school quality, or connections, and it is consistent with the raise in the returns to formal education, the other relevant asset for achieving labor market success.
Hours of work have also changed in an unbalanced fashion across educational groups. While unskilled workers now work fewer hours than before, skilled workers have increased their time in the labor market. Figure 3.3 documents these divergent patterns by showing
11
The EPH is a rotating panel where a household remains in the sample just one year and a half.
12
predicted hours from a Tobit model. Changes were small during the 80s; instead they became very significant and clearly unequalizing in the following decade.
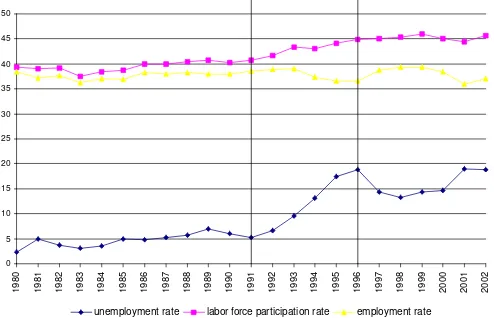
Inequality has increased in the 90s along with an unprecedented growth in unemployment. The unemployment rate was around 2.5% between 1974 and 1980, climbed to around 5% in one decade, and then in a few years jumped to around 15%. Actually, unemployment increased to almost 20% during the Tequila crisis and the 2001/02 crisis. Figure 3.4 shows that the increase in the “equilibrium” unemployment rate from 5% to 15% is basically due to a large increase in labor market participation. Women and youths have moved massively to the labor market but faced an economy with a rigid employment rate. The problem became even worse in recession times when employment temporarily fell. When unemployment is basically the consequence of increasing labor market participation, instead of falling employment, its effect on inequality or poverty is less obvious. If for instance a youth enter the labor force but is unable to find a job, the unemployment rate goes up, but the income distribution remains unchanged (in both labor situations the youth’s earnings are zero).
A microsimulation analysis can shed light over the distributional impact of the factors discussed so far. We model wages and hours of work as parametric functions of observable characteristics, and interpret the residuals of the regressions as the effect of unobservable
factors. For instance, the individual i´s hourly wage in t can be written as wit = Xitβ +t εit
where X is a vector of observable characteristics (typically age, sex and education), β is a
vector of parameters, and ε is an error term. The basic idea of the microsimulations is to
find the counterfactual distribution of w that would be generated in a given period t1 if some
of the right-hand-side elements of the previous equation took the observed values in t2 and
the rest remained at their values in t1. The difference between the real distribution in time t1
and the counterfactual one characterizes the distributional impact of the factors modified in the simulation.
In Table 3.1 we present the results of applying this methodology to characterize changes in the distribution among workers of hourly wages and earnings, and the distribution among
individuals of equivalized household labor income between 1980 and 2002.13 We
investigate the effect of changes in the returns to education, gender and experience in terms of hourly wages (columns (ii) to (v)) by changing the corresponding coefficients (educational dummies, male dummy, and age and age squared) in the wage equation. We trace the effect of these changes not only on the distribution of wages, but also on the distribution of earnings and equivalized household labor income. In column (v) we simulate
wages in time t1 by assuming the distribution of unobservables estimated in time t2. We also
investigate the impact of changes in the parameters of the educational dummies in a (Tobit) hours-of-work equation, separating out the effect on hours of work (column (vi)) and employment (column (vii)). Finally, to compute column (viii) we simulate the educational
structure observed in t2 on the population in t1, keeping the parameters and unobservables
fixed at their values in t1. Table 3.1 shows the average results of these exercises changing
alternatively the base year. Results should be read as follows. The Gini coefficient of the
13
The methodology to implement these decompositions closely follows Gasparini et al. (2003). We could not
earnings distribution changed 7.3 points between 1992 and 1998. If only the educational dummies in the hourly wage equation had changed between those years, the Gini would have increased on average 2.9 points, which implies a sizeable unequalizing effect of the increase in the returns to education on the earnings distribution.
Table 3.1 suggests some interesting results. The change in the returns to education was equalizing in the 80s, and contributed to a fall in wage and earnings inequality. This effect was reversed in the 90s: the increase in the returns to education played a very significant role in rising inequality in the last decade. The returns to unobservable factors in terms of wages, and the returns to education in terms of hours of work played in the same direction: slightly equalizing in the 80s and substantially unequalizing in the 90s. It seems that changes in the gender wage gap and the returns to experience did not play a significant role in shaping the income distribution. Although Argentina experienced a large increase in unemployment, the employment rate has not significantly changed over most of the period, which accounts for the negligible effect reported in column (vii). Finally, changes in the educational structure of the population were mainly unequalizing, as the size of the college
group expanded.14
The analysis of this section suggests that unskilled workers -both in terms of formal education and in terms of unobservable factors- have lost in terms of hourly wages and hours of work during the period 1992-2002, and that these changes have had a very significant role in shaping the distribution of hourly wages, earnings, and household income. In the next section we link these phenomena with the economic changes that have occurred in Argentina, in particular the process of economic integration to the global economy.
4. Integration and inequality
In this section we describe the process of integration of Argentina to the global economy, review the theoretical links between this process and the rise in inequality, and provide evidence on these links based on own estimates and results from the recent literature.
4.1. The process of integration
For many decades Argentina was a rather closed economy both regarding the goods and capital markets. With the exception of a short period of liberalization in the late 70s, the economy traditionally had low levels of trade and financial integration and low rates of absorption of production and organizational technologies. After a timid movement toward more openness in the late 80s, the new administration that took power after the hyperinflation of 1989 implemented in only a few years a broad range of market-based reforms that dramatically changed the integration of Argentina to the international markets. In just a few years, Argentina, formerly a typical closed economy, became a member of the global economy.
14
On the one hand, tariffs were substantially reduced and most barriers to international trade
were eliminated. Additionally, the implementation of Mercosur, a regionaltrade agreement
with Brazil, Uruguay and Paraguay, significantly increased trade with these neighbor countries. The share of goods imports in the GDP dramatically increased from 4% in the 80s to more than 10% in the 90s. Also, its structure changed: the share of capital goods in total imports increased around 10 percentage points in the early 90s.
Regarding capital markets, although most legal constraints on capital movements had already been removed in the 70s, the macroeconomic and institutional instability of the 80s isolated Argentina from the international credit circuit. The perception by foreign investors of greater economic and institutional stability stimulated capital inflows since 1991. Keys to this change were the Convertibility Plan that pegged the peso to the dollar and prevented the government from financing with monetary emission, and a range of market-based reforms including a massive process of privatizations and deregulations. The favorable international financial conditions also contributed to the massive inflow of foreign capitals, which added to the substantial increase of the gross fixed investment in the 90s compared to previous decades. Foreign direct investment as a share of GDP increased from an
average of 0.4% in the period 1970-1990 to 1.6% in the period 1991-1997 (Martinez et al.,
1998). The impact of foreign investment is clear in the structure of fixed investment: the share of foreign durable equipment for production in the fixed gross investment increased from 10% to 30% in the early 90s. Around 47% of total direct foreign investment in 1992-1996 went to the service sectors, attracted by the privatization process (Kulfas and Hecker, 1998). The rest went mainly to extractive activities and the manufacturing sector.
The import-substituting industrialization policies in place for decades in Argentina were not successful in terms of technological progress. The industrialization process was characterized by large productive inefficiencies, scarce innovations and slow incorporation of new technologies. In contrast, the reforms of the 90s promoted a substantial change in productivity and technological advance. FIEL (2002) documents the increase in TFP during the 90s using both a growth-regression and a micro-accounting approach. The significant increase in productivity in the 90s contrasts with the frustrating experience of the 80s.
It is difficult to find measures of technological progress, in particular covering long periods
of time.15 However, given that technology is frequently incorporated into new capital
goods,16 especially those from developed countries, the noticeable increase in private
investment as a proportion of GDP (44% between the 80s and the 90s), the fall in the average age of the capital stock (from 8.8 years in 1989 to 5.9 years in 1996), and the increase in the imports of capital goods (30% of total investment in 1999 from a level of 8% in 1983-1990), suggest a strong process of new technology incorporation.
This process was encouraged by several factors. First, both deregulation of many domestic markets and the removal of barriers to international trade forced private firms to seek the
15
The Encuesta Tecnológica that includes many questions on technology and productivity was introduced in 1996, and implemented only twice, 1996 and 2001. Data however is not available for the 2001 survey yet.
16
productivity gains necessary to stay in business.17 Second, the openness of the Argentine economy just in a moment of increasing globalization and diffusion of new communication technologies induced the access to state-of-the-art production technologies. Third, the price of capital goods dramatically fell at the beginning of the 90s following favorable tariff treatment for capital imports and the real exchange rate appreciation. As suggested, imported capital goods are an important vehicle for technology transfer. Finally, as it was
mentioned above, foreign direct investment greatly increased in the 90s.18 Besides
promoting improvements in the management and international marketing of domestic firms, it tends to favor the access to foreign technologies: by keeping the control over the use and benefits by the owner, direct foreign investment eliminates the usual resistance to technological transfer towards economies with a weak protection of property rights. Likewise, through the contact with providers and clients, the firms receiving foreign investment - for example, the local subsidiaries of multinational firms- generate knowledge
spillovers over other domestic firms.19
The core of the whole process of reforms -stabilization plan, trade and financial liberalization, privatizations, and deregulations- were carried out in no more than five years, with basically no gradual schedule to allow the private sector adjustment to the new circumstances. On the contrary, many public subsidies to the productive sector were reduced or eliminated, and some measures of flexibility in the labor market were introduced. The early 90s were years with a lot of action in terms of changes in the organizational and productive structure of the firms. In contrast to other economies that gradually incorporated new technologies (either because they were already open, like most developed countries, or because the openness process was gradual, like several LAC countries), it is likely that Argentina experienced a true technological shock, as firms used to certain technologies for decades suddenly changed to state-of-the-art techniques.
Data on the pace, speed and depth of the reforms is not easy to find. There have been some
efforts in computing indices of the reforms (Lora (1997) and Morley et al. (1999)). In these
studies Argentina is identified as a high-speed reformer in the early 90s. Figure 4.1 shows
data from Morley et al. (1999) on indices for reforms on three areas closely related to
integration and technology incorporation: international finance, trade and privatizations. In all these areas changes in Argentina seem to have occurred more rapidly than in the rest of the countries. This is evident from the figure, even when (i) the index for trade reform does not include quantitative restrictions, which were very relevant in Argentina and were mostly removed in the early 90s, and it does not properly capture the formation of the Mercosur, and (ii) the index for privatizations depends (negatively) on the value-added in state-owned enterprises: had the index been defined in terms of volume of sales the assessment of the depth of the Argentine privatizations would have been greater (see Lora, 1997).
17
Consistent with that, there exists evidence on a stronger increase in productivity in the private sector relative to the public sector, and in tradable goods relative to nontradable goods (FIEL (2002), and Gay (1998)).
18
See Katz (1999) among others.
19
4.2. Integration and distribution: theoretical links
The effects of increasing economic openness on the within-country distribution of well-being has long been a concern for economists and policy-makers. In the last decades this topic has occupied a central position in the economic debate, first as a consequence of rising earnings inequality in the United States and England during the 80s and 90s, and more recently as part of the debate on the possible drawbacks of globalization.
Increased openness can affect the income distribution through multiple channels: sector reallocations and changes in the use of factors within industries are the two most discussed in the literature. When a country carries out a trade liberalization reform, domestic prices change, which generates a reallocation of resources across sectors, which in turn affect factor prices (the famous Stolper-Samuelson theorem in play). If, as some researchers find, Argentina were a country abundant in natural resources and skilled labor, relative to the
world average and to its main trade partners in the Mercosur,20 trade liberalization would
imply a shift towards production and employment in sectors that use those factors more intensively. That in turn would trigger a raise in the return to natural resources and a
widening of the wage gap between skilled and unskilled workers.21
Greater integration to the world markets for an economy like Argentina can affect inequality through a second channel. As argued above, increased openness implies the fall in the price of capital goods and the introduction of new technologies. Given that capital is more complementary of skilled labor than of unskilled labor, and that new technologies are mostly skilled labor intensive, we expect that integration brings about an increase in the demand for skilled labor in all productive sectors, and hence an increase in the skill
premium.22
The effects of integration on poverty depend on its effect on growth and inequality. While
there is a large literature on the positive effects of openness on growth (Bourguignon et al.
(2002), Michaley et al. (1991), Sachs and Warner (1995)), we have just discussed the
potential unequalizing effect of integration on the income distribution. However, and although there are opposing views, there is a relatively wide consensus in that more integration to the world economy on average implies higher income or faster growth, and
that growth, more than anything, is behind the successful stories of poverty reduction.23
The empirical study of the links between globalization and distribution faces two formidable problems in the case of Argentina. On the one hand there are severe data limitations to implement many research strategies that have been applied to other (mostly developed) countries. Secondly, all sorts of economic reforms were carried out in just a few years, so it becomes difficult to single out the effect of each of the reforms on the income
20
See Cristini (1999) and Porto (2000).
21
See Wood (1994) and Leamer (1995) for this argument applied to the case of the US.
22
See Acemoglu (2002) and Krusell et al. (2000) for models of these arguments.
23
distribution. In the rest of this section we contribute to the understanding of distributional changes with some evidence, and report evidence from the recent literature.
4.3. Between and within factor reallocations
The sectoral structure of the economy has substantially changed in Argentina in the last three decades. Table 4.1 shows the share of each sector of activity in total hours of work in the Greater Buenos Aires area. The most notable change in the labor structure since 1974 has been the fall in employment in the manufacturing industry, and the increase in public sector and in professional and business services employment (see Figure 4.1). While 38% of work hours were in the manufacturing industry in 1974, that value dropped to just 19% in 1998, and 15% in 2002. On the other hand, while in 1974 21% of hours were in the more skilled-intensive sectors of professional and business services and the government, that share rose to 39% in 1998, and 46% in 2002. These changes have occurred over the whole period under analysis, although the drop in low-tech manufacturing industry and the increase in professional services were deeper during the two periods of liberalization (74-80 and 92-98). The share of employment in public administration, education and health increased particularly during 86-92 and 98-02.
These patterns do not substantially varied as we divide the population of workers by skills. Workers with less than high school have lost jobs (or hours of work) in the manufacturing sector over the last three decades. While some have joined the pool of the unemployed, others have found new jobs in other sectors, especially in the public sector, and in the wholesale and retail sectors. Semi-skilled workers (those with a high school degree) have also lost jobs in the manufacturing industry, while found employment in commerce, utilities and the public sector. The industry downgrading also affected skilled labor, although less than it impacted unskilled labor. College graduates have moved in particular to the professional and business services sector during 74-80 and 92-98, and to the public sector during 86-92.
The educational structure of the labor market has been substantially changing in Argentina at least during the last three decades, according to the results of table 4.2. While the share of workers with less than high school in aggregate labor was 67% in 1974, that share dramatically fell to 32.7% in 2002. On the other hand, the share of college graduates rose from 10.3% to 32.4% in the same period. These changes are mainly due to an education upgrading of the population, but also due to the increasing difficulties for the unskilled to find employment.
mostly belong to the upper educational group, but have less skills, at least in terms of years of education, and earn lower wages than the average in that group. Hence the impact on earning inequality is likely to be smaller when the public sector expands than when the professional and business sector grows.
Recall from last section that the relative wage for skilled labor slightly decreased in the 80s. Table 4.3 reports a more intensive use of this factor in most sectors. In contrast, the wage premium for skilled workers significantly increased in the 90s. However, nearly all sectors rose the employment share of this factor. This movement is consistent with an increase in the relative productivity of skilled labor brought about either by the increased use of complementary factors in the production process (capital) or by skilled-biased technological change. A third possibility has been mentioned in the literature: some skilled workers may occupy unskilled positions and earn wages corresponding to the productivity
in those jobs (e.g. architects driving a taxi). If that occurs, the factor change in some sectors
may be overestimated.
As an exploratory analysis we decompose the changes in the share of each of the three types of labor into (i) changes due to transformations in the sectoral structure of employment (presumably a consequence of changes in the production structure driven by trade liberalization), and (ii) changes due to variations in the intensity of use of different types of labor within each sector (presumably the consequence of the drop in the price of
capital goods and/or biased technological change).24 This decomposition, whose results are
shown in Table 4.4 and Figure 4.3, provides a sign of the relevance of each of the two channels discussed in the previous section.
The between effect in the first panel indicates that sectoral changes have favored college graduates over the last three decades. On the contrary, workers with less than high school faced declining demand due to the contraction in those sectors that use unskilled labor more intensively. Notice that these effects were stronger between 1986 and 1992, a period where employment in the public sector increased, while it substantially fell in the manufacturing industry and in unskilled service sectors.
The within effects in the second panel of Table 4.4 have the same signs of the between effects. Firms have changed the way they produce, demanding more skilled labor and less unskilled labor. This phenomenon has been taking place at least since the 70s. The period with the largest positive impact on college graduates employment was 92-98, which is consistent with the story of new capital incorporation and skilled-biased technological change after the reforms. However, this effect is also significant during the 80s, a decade of stagnation in investment and technological progress. It is interesting to notice that figures in the second panel are generally higher than those in the first panel, suggesting that within effects have been stronger than between effects.
The last panel in Table 4.4 shows the overall effect in employment of between and within sectoral changes. Relative employment of the unskilled has dramatically fallen both due to a falling share of unskilled-labor–intensive industries and especially because of less use of
24
that factor in all sectors. On the contrary, employment of skilled workers has increased through both channels. The 90s do not look so different from the 80s from this decomposition. Two distinctive factors of the 90s are the stronger positive within effect on college graduates, and an overall poorer performance of the semi-skilled, relative to the 80s.
A plausible, but certainly not unique, interpretation of these results is the following. The 80s combine absence of technological change, and an expansion of the public sector. That expansion did not translate into a higher wage premium, probably because (i) it did not shift the demand for skilled labor too much given the peculiarities of the public sector labor demand commented above, (ii) labor institutions were clearly more active in the 80s than in other periods, and (iii) there was a jump in skilled labor supply in the second half of the 80s, due to the increasing attendance to universities brought about by democracy in 1983. Given the fall in the wage premium most sectors increased the relative use of skilled labor, which accounts for a positive within effect for college graduates in Table 4.4.
The story for the two liberalization periods (74-80 and the 90s) was different: changes toward skilled-intensive private sectors and skilled-biased technological change expanded the demand for skilled labor, and hence the wage premium went up. Weak labor institutions favored this increase. Despite the growth in the wage premium, firms used more skilled labor, given the productivity upgrading. The within effect was larger and more economy-widespread in the 90s than in the late 70s, which is consistent with a stronger process of new capital and technology incorporation.
4.4. Trade, investment and technology
Motivated by the strong economic and distributional changes experienced by Argentina in the 90s several authors have tried to connect the economic reforms to the increase in inequality and poverty. Due to data constraints the existing literature has almost exclusively concentrated on the effect of trade liberalization on income inequality. The general conclusion is that more openness implied a wider wage gap, but that this effect can explain only a small fraction of the total increase in the wage premium.
Trade may modify the real income distribution by changing not only factor prices, but also prices of goods and services. Porto (2002) finds an equalizing distributional effect of liberalization from the consumption side by inspecting changes in relative prices and the bundles consumed by households from the Encuesta de Gastos e Ingresos de los Hogares 1996/7. He finds that the poor consume relatively more tradable goods than the rich do, and concludes that they were the main beneficiaries of the fall in tariffs when considering only this channel.
To take a deeper look at the distributional effects of trade liberalization and technological change on relative wages, we extend the study of Galiani and Sanguinetti (2003) by adding a variable that interacts the worker’s education with a measure of capital investment in her sector. Details of this analysis are in a companion paper (Acosta and Gasparini, 2003). In particular, we estimate the following regression
i g k g i g i g m g i g i g t E gt t i g i
i E T E m E k controls
w =
∑ ∑
β +∑
β +∑
β + +ε= = = = 3 1 3 1 3 2 99 92 ln
where wiis individual’s i hourly wage; Eigis the educational dummy for level g; and Tit is a
time dummy (= 1 if the individual i is observed in year t). The variable mi is the logarithm
of imports penetration over value-added in the sector to which the individual i belongs,
while ki denotes the log of capital accumulation over sectoral value-added. We include in
the regressions the usual set of controls (age, age squared, gender, tenure) and fixed effects by year, sector and city. Individual data on wages, education and control variables are taken from the EPH for all urban areas in Argentina from 1992 to 1999. Import penetration data by sector is taken from the External Trade Data-Intal (IDB) while sectoral value-added data was obtained from the Secretary of Economic Policy. A panel dataset on investment in machinery and equipment by industry released by the Department of Industry is our main source of information for capital accumulation.
As they interact with the educational dummy variables, the model allows a differential effect by skill for both imports penetration and capital accumulation. Given that new technology is incorporated into new capital, and physical capital is more complementary
with skilled labor than with unskilled labor, we expect that the βk be increasing in the
The greater relevance of the capital/technology channel over the trade channel is also found in studies for other countries. In a survey of the literature for the US Katz and Autor (1999) conclude that trade explains around 20 percent of the increase in inequality, while
skilled-biased technological change explains the remaining 80 percent. Behrman et al. (2003) use
household survey microdata on wage differentials by schooling levels for 18 Latin American countries for the period 1977-1998 combined with policy indices, and find that on average liberalizing policies have had a strong positive effect on wage differentials, although that effect tends to fade fairly rapidly. They conclude that “technological progress rather than trade has been the mechanism through which the disequalizing effects have been operating”. Sánchez-Páramo and Schady (2003) reach a similar conclusion using repeated cross-sections of household surveys. They stress an important point: although the direct effect of trade on wage inequality may be small, trade is an important mechanism for technology transmission. They show that “changes in the volume and R&D intensity of imports are significantly related to changes in the demand for more skilled workers in Latin America”.
Summing up, although none of the pieces of evidence shown in this section is per se
sufficiently conclusive or convincing, nearly all of them point to the same conclusions. The integration of Argentina to the global economy accelerated in the beginning of the 90s seems to have had a significant unequalizing impact on the wage gap between skilled and unskilled workers. The direct impact of sectoral reallocations after trade liberalization seems to have been minor. The (scarce) evidence on the distributional impact of the increase in capital investment and skilled-biased technological change suggests effects of a larger magnitude.
4.5. Other factors
As it was stated before, many changes have occurred during the 90s beyond those mentioned so far that might have affected the income distribution. The strength of some labor institutions have varied over time in Argentina. Two of the periods of greater distributional changes coincide with weak labor institutions: the military regime banned unions during the second half of the 70s, while as a consequence of an alliance with the government unions remained quiet during the 90s. Also in both periods the minimum wage became non-binding. Unfortunately, there is not quantitative evidence on the effect of these institutional factors on inequality.
Since capital income is more concentrated in rich households this fact implies that both the
level and the increase in recorded income inequality are underestimated.25
Demographic factors have not been absent in shaping Argentina’s household income distribution. During the last two decades fertility decisions have varied significantly and not uniformly along the income distribution. The average number of children under 12 per household in the GBA in the bottom quintile of the parental income distribution was 1.33 in 1974 and 1.95 in 1998. The corresponding figures for the top quintile were 1.24 and 0.97. This divergent pattern in fertility decisions across income strata was stronger in the 80s. Using microsimulations Marchionni and Gasparini (2003) conclude that the increase of the family size in low-income households significantly contributed to the observed growth in poverty and inequality in that decade. The impact on the distribution in the 90s was smaller.
4.6. Argentina vis-a-vis the rest of LAC
As it was argued in section 2 the distributional performance of Argentina has been significantly worse than in the rest of the region. Although this paper is not focused on comparative issues, it is possible to sketch some possible explanations for these different patterns. One plausible reason is the faster pace at which Argentina has integrated to the global economy. A sudden technological and organizational shock has a deeper impact than a slow process of technology incorporation with more time to do training and reallocation. The same applies for the economic transformations that follow a sudden and deep trade liberalization process. There is evidence that Argentina was a high-speed reformer in the early 90s, although the evidence on the effect of this speed on wage differentials is still
scarce and mixed.26
A second reason refers to the fact that the pre-reform economic structure was significantly different in Argentina from most of the rest of LAC. Being a more industrialized economy, technological changes and sector reallocations driven by liberalization probably had a stronger impact in the structure of wages and employment than in other less developed/more agrarian economies. Additionally, compared to most countries in LAC Argentina has a significantly larger share of skilled labor (see Figure 4.5), which may have contributed to a faster and more widespread incorporation of skilled-biased technological
innovations.27 Also, this different factor endowment likely implied greater price changes
and reallocations against unskilled labor-intensive sectors after trade openness with
countries relative abundant in unskilled labor (e.g. China and Brazil).
The demographic factors were also particularly unequalizing in Argentina, compared to the rest of LAC. Figure 4.6 shows the ratio in the number of children under 12 per household between the bottom and top quintiles of the parental income distribution. That ratio increased in Argentina more than in any other country in the region.
25
The increase in mean income in the 90s is also probably underestimated for this reason. Actually there is a serious discrepancy on income changes between the EPH and National Accounts.
26
Behrman et al. (2003) find that most of the countries with the greatest widening of the higher-primary wage
gap are high-speed reformers in terms of capital account liberalization. Instead, they do not find a significant relationship between speed of the trade policy reforms and the wage gap.
27
5. Public policy and redistribution
Governments can alleviate or reinforce the “market” distributional changes with fiscal and other public policies. Unfortunately, there are no studies of the redistributive impact of public policies in Argentina on a yearly basis. Table 5.1 shows the results of a rough exercise intended to assess the distributional impact of fiscal policies since 1980.
Benefit-incidence results in Flood et al. (1994) and DGSC (2002) are used to assign social public
spending in each program by deciles of the income distribution. Taxes are assigned based on Gasparini (1998) and DGSC (2002). Reported changes in the distributional impact of expenditures (the tax system) over time basically capture changes in the shares of different public programs (taxes), since there are no available annual benefit-incidence and tax incidence studies.
Social public expenditures (SPE) have been pro-poor (negative concentration index) over all the period considered. Figure 5.1 shows an increase in targeting in the first half of the 80s, (basically due to a jump in the share of basic education and health in the budget since 1983), a sharp fall in the late 80s, and an increase over the 90s to recover the levels of the early 80s. Progressivity of SPE has been growing over time, especially due to increasing income inequality. Taxes are more concentrated in the upper income strata (positive concentration index). Tax concentration rose in the 90s but not at the same speed as income concentration, making the tax system increasingly regressive (increasingly negative progressivity index).
It can be shown (Lambert, 1993) that Ga-Gb=b(Ke+Kt), where Ga is the Gini after fiscal
policy and Gb is the Gini before, b is public expenditures as a share of disposable income,
and Ke and Kt are the Kakwani’s progressivity indices of expenditures and taxes,
respectively. Figure 5.2 shows the distributional impact of fiscal policy in terms of the Gini
coefficient Ga-Gb, the share of SPE in disposable income and the progressivity of the fiscal
policy (Ke+Kt). The distributional impact has varied in the 80s as a result of large changes
in the budget size and reallocations across programs. In the 90s the impact remained stable as a consequence of a budget slightly decreasing in size (as a share of income) and slightly increasing in progressivity. Figure 5.3 shows that although fiscal policy reduces the level of inequality it did not have a significant impact in affecting its pattern over the last decades.
Figure 5.4 shows that public expenditure in targeted programs slowly increased in the 80s, dramatically fell in the crisis of the late 80s, and increased in the 90s. However, in terms of the poor population, spending in welfare programs dropped in the 80s and remained roughly constant at these lower levels in the 90s.
changes in GDP for the period 1980-1997 is 1.86.28 This high positive correlation reveals budget cuts in recession times, when targeted programs are most needed. Braun and Di Gresia (2003) argue that the reasons of such procyclicality lie in the political constraints on savings during expansions, the limited creditworthiness during recessions, and a low share of automatic stabilizers in the budget.
The pro-market reforms helped to achieve unprecedented economic growth rates during most of the 90s in Argentina. However, these extra resources were not efficiently used to deal with the distributional problems that were unfolding during that decade. During the 90s Argentina did not save in order to being able to do countercyclical social policy in crisis times, did not build a larger safety net to alleviate the short-run consequences of increasing poverty, and did not implement effective labor policies to deal with the problems of displaced unskilled workers. It is likely that distributional outcomes would have been less negative had the government used the resources from high economic growth in sound labor and social policies.
6. Concluding comments: reading the evidence
In this concluding section we present our reading of the existing evidence. The view is rather conjectural and shaped by personal beliefs, since the literature has many holes and ambiguities. More research is definitely needed to have a clear view of the distributional changes in Argentina.
Inequality and poverty have dramatically increased in Argentina since the 70s. Rather than reading this fact as a “trend”, we believe it is useful to single out the four episodes of
distribution deterioration.29 Two of them coincide with acute macroeconomic crisis (88-89
and 01-02). In these periods poor people are more prone to lose their jobs, reduce hours of work and have larger wage cuts. Although inequality and poverty sharply increase during
crisis, as the economy recovers they tend to fall again.30 In this sense, they probably
generate distributional changes that do not last long.31 The other two episodes of inequality
rise (late 70s and 92-98) coincide with periods of “shocks” in the integration of Argentina to the world markets, and of weak labor institutions. These episodes probably have implied distributional changes of a larger duration. Data for the late 70s episode is scarce, so most of the available evidence, including this paper, refers to the closer episode of the 90s.
Increasing integration to the global economy was very likely a significant determinant of the inequality jump in the nineties. Two are the main channels that link integration to inequality. The first one operates through sector reallocations. Being Argentina a country relatively abundant in natural resources and skilled labor, trade liberalization implied a shift
28
In contrast to Braun and Di Gresia (2003), estimates in World Bank (2000) imply that social spending is more procyclical than total spending.
29
Atkinson (1997) stresses the approach of distributional episodes rather than trends.
30
This was the case in the late 80s crisis, in other crisis in the world (e.g. see Neri (2000) for Brazil), and it
seems to be the case in the current recovery of the Argentina’s economy.
31
towards production and employment in sectors that use those factors more intensively, and in turn an increase in the relative return to natural resources and a widening of the wage gap between the skilled and the unskilled workers. The available evidence shows however that this story explains only a small part of the observed change in the income distribution. Globalization can affect inequality through a second channel. The fall in the price of capital and the introduction of new skilled labor intensive technologies, both likely consequences of the greater integration of Argentina to the world markets, implied an increase in the intensity of use of skilled labor in all the productive sectors, and hence an increase in the skill premium. This effect seems to be a more significant source of increasing income disparities.
It is likely that the impact of globalization on the income distribution was greater in Argentina than in other countries in Latin America in part due to the faster pace at which the country has integrated to the global economy, and as a consequence of a more industrialized economic structure, and a significantly larger share of skilled labor. The reduction in the strength of the labor institutions may have also contributed to this greater impact.
Fiscal and social policies did not have a very active role in alleviating the effects of increasing poverty and inequality. Actually, inequality trends are basically unchanged when government transfers (cash and in-kind) are included in the computation of household income. Argentina did not take advantage of the GDP growth in the 90s to build a social safety net that could have alleviated the market-driven distributional changes, to train or relocate displaced unskilled workers, or to save in order to be able to increase social spending during recessions.
There is a heated debate in Argentina on the merits and demerits of globalization, and the convenience of undoing the process of integration. Many views against globalization point at their distributional adverse consequences. The literature indeed suggests that there have been links between liberalization and the distributional changes in Argentina. However, some qualification should be taken into account before taking that evidence for opposing globalization on distributional grounds. First, it is likely that the speed and depth of the economic changes in Argentina, and the absence of effective redistributive policies, are important in accounting for the jump in inequality and poverty. Other Latin American countries that have taken the road to more integration at a slower pace did not experienced large inequality increases, and in most of them poverty fell.
Second, there is evidence that integration is a powerful instrument for economic growth and
hence for aggregate welfare increase (despite its effects on inequality).32 Opposing to
integration and new technology incorporation seems to be an unreasonable policy option, since economic growth is related to the capability of inserting the country in the global
economy and of increasing the productivity through the absorption of new technologies.If
Argentina decides to abandon the integration process, it is likely that a slowdown in GDP growth would follow. Although a slowdown might not affect inequality, it can have sizeable consequences in terms of poverty. Assuming an annual growth rate of 3% and no
32
changes in unemployment, inequality and income support programs, a microsimulation exercise from the EPH 2002 yields the result that the poverty headcount ratio could reach 30% in 10 years, from a current level of around 50%. If instead the growth rate were 5% poverty would fall to 23%, while it could be 15% if the growth rate were 8%. The differences could be larger if growth brings about a reduction in unemployment and more resources for income support programs.
Most of the literature, including this paper, suggests that if following these arguments governments decide embracing globalization, they should be very aware of the possible unequalizing consequences of an integration process. In particular, governments should take measures to regulate the pace of the integration to the world markets, to provide the poor and unskilled with adequate safety nets, and to promote education and training to ease the transition. Many authors stress the relevance of transitional compensatory measures and gradual liberalization, although “there is no general prescription for what these policies
should be” (Fischer, 2003).33 Failing to do that may increase the strength of the
anti-globalization arguments and place the whole process of integration into risk.34
33
See for instance Scheve and Slaughter (2001) and Behrman et al. (2003) for similar conclusions.
34
Milanovic (2002) states that “current trends are likely to produce a backlash unless globalization is tamed”.
Bourguignon et al. (2002) also point out that failing to address some of the costs of globalization would risk
References
Acemoglu, D. (2002). Technical change, inequality, and the labor market. Journal of
Economic Literature XL (1), 7-72.
Acosta, P. and Gasparini, L. (2003). Capital investment, trade liberalization and rising wage inequality: the case of Argentina. Unpublished manuscript, Universidad Nacional de La Plata.
Altimir, O. (1986). Estimaciones de la distribución del ingreso en la Argentina, 1953-1980.
Desarrollo Económico 25 (100), enero-marzo.
Altimir, O., Beccaria, L. and Gonzalez Rozada, M. (2002). La distribución del ingreso en
Argentina, 1974-2000. Revista de la Cepal 78.
Andersen, L. (2001). Social mobility in Latin America: links with adolescent schooling.
IADB Research Network Working Paper #R-433.
Atkinson, A. (1970). On the measurement of inequality. Journal of Economic Theory 2.
Atkinson, A. (1997). Bringing income distribution in from the cold. The Economic
Journal 107 March, 297-321.
Behrman, J., Birdsall, N. and Székely, M. (2003). Economic policy and wage differentials in Latin America. Center for Global Development, Working Paper 29.
Berry, A. (2002). Methodological and data challenges to identifying the impacts of globalization and liberalization on inequality. Unpublished manuscript.
Blomstrom M. and Kokko, A. (1996). The impact of foreign investment on host countries:
a review of the empirical evidence. World Bank Policy Papers, No. 1745,
Washington D.C.
Bound, J. and G. Johnson (1992). Changes in the structure of wages in the 1980’s: an
evaluation of alternative explanations. American Economic Review 82 (3).
Bourguignon et al. (2002). Making sense of globalization: a guide to the economic issues.
Centre for Economic Policy Research Policy Paper 8.
Cicowiez, M. (2002). Comercio y desigualdad salarial en Argentina: un enfoque de equilibrio general computado. Documento de trabajo 40, Departamento de Economía, Universidad Nacional de La Plata.
Cristini, M. (1999). Apertura económica, política comercial y la distribución del ingreso:
¿qué aporta el caso argentino al debate? In La distribución del ingreso en la
Argentina, FIEL, Buenos Aires.
Deaton, A. and Zaidi, S. (2002). Guidelines for constructing consumption aggregates for welfare analysis. LSMS Working Paper 135.
Deininger, K. and Squire, L. (1996). Measuring income inequality: a new data set. The
World Bank Economic Review 10, 565-91.
DGSC (2002). El impacto distributivo de la política social en la Argentina. Dirección de Gastos Sociales Consolidados.
DNCN (2003). Cuenta de generación del ingreso. Dirección Nacional de Cuentas Nacionales.
Esteban, J., Gradin, C. and Ray, D. (1999). Extension of a measure of polarization, with an application to the income distribution of five OECD countries. Instituto de Estudios Economicos de Galicia Pedro Barrie de la Maza, Working Papers Series, 24. (1999).
FIEL (2002). Productividad, competitividad y empresas. FIEL, Buenos Aires.
Fischer, S. (2003). Globalization and its challenges. The American Economic Review 93 (2), 1-30.
Flood, C., Harriague, M., Gasparini, L. and Vélez, B. (1994). El gasto público social y su
impacto redistributivo. Secretaría de Programación Económica. Ministerio de
Economía. Buenos Aires.
Galiani, S. and Sanguinetti, P. (2003). The impact of trade liberalization on wage
inequality: evidence from Argentina. Journal of Development Economics,
forthcoming.
Garcia Swartz, D. (1998). General-Equilibrium Perspectives on Relative Wage Changes in
an Emerging-Market Economy: Argentina between 1974 y 1995, Ph.D Dissertation,
University of Chicago.
Gasparini, L. (1998). Incidencia distributiva del sistema impositivo argentino. In La
Gasparini, L. (1999). Desigualdad en la distribución del ingreso y bienestar. Estimaciones
para la Argentina. In La distribución del ingreso en la Argentina, FIEL, Buenos
Aires.
Gasparini, L. (2002). La pobreza en la Argentina. Un análisis regional. Documento de trabajo, FIEL.
Gasparini, L., Marchionni, M. and Sosa Escudero, W. (2001). La distribución del ingreso
en la Argentina. Premio Fulvio Salvador Pagani 2001, Editorial Triunfar.
Gasparini, L., Marchionni, M. and Sosa Escudero, W. (2003). Characterization of inequality changes through microeconometric decompositions. The case of Greater
Buenos Aires. In Bourguignon, Lustig and Ferreira (eds.). The Microeconomics of
Income Distribution Dynamics, forthcoming.
Gasparini, L. (2003). Different lives: Inequality in Latin America and the Caribbean. The
World Bank LAC Flagship Report. Chapter 2.
Gay A. (1998). La competitividad internacional de la Economía argentina (1990-1996).
Económica, Año 44, No. 4, Tomo II.
International Financial Corporation (1997). Foreign Direct Investment, Lessons of
Experience, No.5, Washington D.C..
Katz, J. (1999). Reformas estructurales y comportamiento tecnológico: Reflexiones en torno a las fuentes y naturaleza del cambio tecnológico en América Latina en los
años noventa. Banco Interamericano de Desarrollo, Serie Reformas Económicas,
No.13, febrero.
Katz, L. and Autor, D. (1999). Changes in the wage structure and earnings inequality. In
Ashtenfelter and Card (eds.). Handbook of Labor Economics 3A, 1463-1555.
Krusell, P., Ohanian, L. Ríos-Rull, J. and Violant, G. (2000). Capital-skill complementarity
and inequality: a macroeconomic analysis. Econometrica 68 (5), September.
Kulfas M. and E. Hecker (1998). La inversión extranjera en la Argentina de los años ’90:
Tendencias y perspectivas. Estudios de la Economía Real, No. 10, octubre.
Lambert, P. (1993). The distribution and redistribution of income. Manchester University
Press.
Leamer, E. (1995). Trade, wages and revolving-door ideas. NBER Working Paper 4716.