Statistical Method of Context Evaluation
for Biological Sequence Similarity
Alina Bogan-Marta11, Ioannis Pitas1, and Kleoniki Lyroudia2 1 Aristotle University of Thessaloniki, Department of Informatics,
Artificial Intelligence and Information Analysis Laboratory, Box 451, 54124 Thessaloniki, Greece, pitas@aiia.csd.auth.gr
2 Aristotle University of Thessaloniki, Department of Endodontology, Dental School, Greece, lyroudia@aiia.csd.auth.gr
Abstract. Within this paper we are proposing and testing a new strategy for detection and measurement of similarity between sequences of proteins. Our approach has its roots in computational linguistics and the related techniques for quantifying and comparing content in strings of characters. The pairwise comparison of proteins relies on the content regularities expected to uniquely characterize each sequence. These regularities are captured by n-gram based modelling techniques and exploited by cross-entropy related measures. In this new attempt to incorporate theoretical ideas from computational linguistics into the field of bioinformatics, we experimented using two implementations having always as ultimate goal the development of practical, computationally efficient algorithms for expressing protein similarity. The experimental analysis reported herein provides evidence for the usefulness of the proposed approach and motivates the further development of linguistics-related tools as a means of analysing biological sequences.
1 Introduction
The practice of comparing gene or protein sequences with each other, in the hope of elucidating similarity conveying functional and evolutionary significance, is a subject of primary research interest in bioinformatics. The application of this type of analysis to complete genomes greatly expands its utility and implications. The rewards range from the purely technical, such as the identification of contaminated sequence phases, to the most fundamental ones, such as finding how many different domains define the tree of life. Proteins are large, complex molecules composed of
1
amino acids and their comparison and clustering according to similarity, require dedicated algorithms.
The most frequently used methods for measuring protein similarities are based on tedious algorithmic procedures for sequence alignment. Smith-Waterman algorithm [1] remains the standard reference method for pairwise sequence similarity due to the accuracy of the obtained results. Other heuristic algorithms, like BLAST1
, FASTA2 or CLUSTAL3
provide higher computational efficiency at the expense of accuracy. Algorithms characterized by the computation of profiles for whole protein families are based on hidden Markov models [2], [3]. All the above mentioned methods are built over sequence alignment but a variety of new alternative methods has already become available for expressing similarity between biological sequences for use in different applications. In Sjolander’s work [4] are used Dirichlet mixtures while the authors of [5] apply discriminative methods using the approach of support vector machines (SVMs). Latent semantic analysis (LSA) is another method used in the work of Ganapathiraju [6] and the universal similarity metric (USM) for structural similarity between pairs of proteins is proposed by Krasnogor and Pelta [7].
Despite the maturity of the developed methodologies working towards this direction, the derivation of protein similarity measures is still an active research area. The interest is actually renewed, due to the continuous growth in size of the widely available proteomic databases that call for alternative cost-efficient algorithmic procedures. They should reliably quantify protein similarity without resorting to any kind of alignment. Apart from efficiency, a second specification of equal importance for the establishment of similarity measures is the avoidance of parameters that need to be set by the user (a characteristic inherent in the majority of the above mentioned methodologies). It is often the case with the classical similarity approaches that the user faces a lot of difficulties in the choice of a suitable search algorithm, scoring matrix or function as well as set of optional parameters whose optimum values correspond to the most reliable similarity.
A new approach for measuring the similarity between two protein sequences is introduced in this paper. It is inspired by the successful use of the entropy concept for information retrieval in the field of statistical language modeling (Manning and Schütze [8], Jurafsky and Martin [9]). Although the n-gram concept has been used in earlier works, e.g. [10], [11], the presented work is following a first attempt to adopt this dual step for comparing biological sequences [12]. Therefore, some experiments were necessary in order to discover the most effective way in which these ideas could be applied in the specific domain. For a complete validation of the suggested similarity measure, we built an annotated database by selecting proteins from Astral SCOP genetic domain sequences (http://astral.berkeley.edu). Using standard procedures, well-known in the field of exploratory data analysis and information retrieval, we evaluated the performance of our measure and contrasted with the performance of a relevant similarity score obtained by applying the popular CLUSTAL W method to the same database. CLUSTAL W method performs multiple sequence alignment and generates pairwise similarity scores using the identification of conserved sequence regions. We show that our method provides an effective way for capturing the common characteristics of the compared sequences,
1
http://www.ncbi.nlm.nih.gov/BLAST/ 2
http://www.ebi.ac.uk/fasta33/ 3
while avoiding the annoying task of choosing parameters, additional functions or evaluation methods. The high performance of the new method and the ready-to-plug-in character, taken together with its computational efficiency, make our approach a promising alternative to the well-known, sophisticated protein similarity measurements.
2 Methods
2.1 Theoretical background
There are various kinds of language models that can be used to capture different aspects of regularities in natural language [13]. Markov chains are generally considered among the more fundamental concepts for building language models. In this approach, the dependency of the conditional probability of observing a word wk
at a position k in a given text is assumed to depend only upon its immediate n
predecessor words wk-n … wk-1. The resulting stochastic models, usually referred as
n-grams, constitute an heuristic approach for building language grammars and their linguistic justification has often been questioned in the past. However, in practice they have turned out to be extremely powerful theoretical tools. Nowadays n-gram language modeling stands out as superior to any formal linguistic approach [13] and has gained high popularity due to its simplicity.
Close related with the design of models for textual data are the algorithmic procedures used to validate them. Apart from the justification of a single model, they can facilitate the selection of the specific one (among competing alternatives) most faithfully representing the available data. Entropy is a key concept for this kind of procedures. In general, its estimation is considered to provide a quantification of the information in a text and has strong connections to probabilistic language modeling [14]. As described in [8] and [15], the entropy of a random variable X that ranges over a domain א, and has a probability density function, P(X) is defined as:
Recently, in Van Uytsel and Compernolle’s work [16], the general idea of entropy has been adopted in the specific case that a written sequence W= {w1,w2,…,wk-1,wk, wk+1,…} is treated as a language model L based composition, having the following estimating formula:
( )
1( )
log(
)
(2)ˆ 1 2 * − +
∑
− = n i n i L W n iL Count w p w w
N X
H
where the variable X has the form of an n-gram
X
=
w
in⇔
{wi,wi+1,…,wi+n-1} and)
(
w
inCount
is the number of occurrences ofw
in. The summation runs over all the possible n-length combinations of consecutive wi (i.e.W*={{w1,w2,…,wn},{w2,w3,….,wn+1},….}) and N is the total number of n-grams in
the investigated sequence. The second term,
(
−1)
+n ini w
w
p in (2), is the conditional
elements. Following the principles of maximum likelihood estimation (MLE), it can be estimated by using the corresponding relative frequencies:
(
)
( )
( )
. (3)ˆ 1 1
− + −
+ = n
i n i n i n i w Count w Count w w p
The cross-entropy between the actual probability distribution P(X) (over a random variable X) and the probability distribution Q(X) estimated from a model is defined
as:
( )
log( )
. (4)) ,
(X Q P X Q X
H
X
∑
∈ℵ − =Two important remarks should be mentioned here. First, the cross entropy of a stochastic process, measured by using a model, is an upper bound on the entropy of the process (i.e. H(X)≤H(X,Q)) [8], [15]). Second, between two given models, the more accurate is the one with the lower cross-entropy [9].
The above entropic estimation together with the general form of (1) and (2), suggesting a direct way to pass from entropy to cross-entropy formulation, are the basis for building our protein similarity measure, described in the sequel.
2.2 The n-gram Based Protein Similarity Measure
Protein sequences from all different organisms can be treated as texts written in a universal language in which the alphabet consists of 20 distinct symbols, the amino-acids. The mapping of a protein sequence to its structure, functional dynamics and biological role then becomes analog to the mapping of words to their semantic meaning in natural languages. Recently, it was suggested that this analogy can be exploited by applying statistical language modeling and text classification techniques for the advancement of biological sequences understanding (topic on Biological Language Conference, 2003). Scientists within this hybrid research area believe that the identification of Grammar/Syntax rules could reveal entities/relations of high importance for biological and medical sciences.
In the presented approach, we adopted a Markov-chain grammar to build for our protein dataset 2-gram, 3-gram and 4-gram models. To clarify things we chose a hypothetical protein sequence WASQVSENR. In the 2-gram modeling the available tokens/words were {WA AS SQ QV VS SE EN NR}, while in the 3-gram representation they were {WAS ASQ SQV QVS VSE SEN ENR}. Based on the frequencies of these tokens/words (estimated by counting) and by forming the appropriate ratios of frequencies, the entropy of an n-gram model can be readily estimated using (2). This measure is indicative about how well a specific protein sequence is modeled by the corresponding n-grammodel. While this measure could be applied to two distinct proteins (and help us to decide about which protein is better represented by the given model), the outcomes cannot be used for a direct comparison of them. Thus, the common information content between two proteins X
and Y is expressed via the formula:
(
,)
=−∑
( )log Y(
i+n| in−1)
(5).n i w all
X w P w w
The first term
P
X( )
w
in in (5) corresponds to the reference protein sequence X (i.e. it results from counting the words of that specific protein). The second term corresponds to the sequence Y based on which the model has to be estimated (i.e. it results from counting the tokens of that protein). Variablew
in ranges over all the words (that are represented by n-grams) of the reference protein sequence.2.3 Database Searches with the New Similarity Measure
Having introduced the new similarity measure, we proceed here with the description of its use for performing searches within protein databases. The essential point of our approach is that the unknown query-protein (e.g. a newly discovered protein) as well as each protein in a given database (containing annotated proteins with known functionality, structure etc.) are represented via n-gram encoding and the above introduced similarity is utilized to compare their representations.
We considered two different ways in which the n-gram based similarity is engaged in efficient database searches. The most direct implementation is called hereafter as direct method. A second algorithm, the alternating method, was devised in order to cope with the fact that the proteins to be compared could be of very different length. It is easy to observe the need of having two methods if sequences of very different length are compared. The procedure of experimenting with both methods and contrasting their performances gave the opportunity to check the sensitivity of the proposed measure regarding the length of the sequences.
Direct method. Let Sq be the sequence of a query-protein and {S}={S1, S2, … SN} the given protein database. The first step is the computation of ‘perfect’ score (PS) or ‘reference’ score for the query-protein. This is done by computing E(Sq,Sq) using the query-protein both as reference and model sequence (we call here “model” the sequence compared with the query) in equation (5). In the second step, each protein Si, i=1…N, from the database serves as the model sequence in the computation of a similarity score E(Sq,Si), with the query-protein serving as reference sequence. In this way, N similarities are computed E(Sq,Si), i=1,..,N. Finally, these similarities are compared against the perfect score PS by computing the absolute differences D(Sq,Si)=|E(Sq,Si)–PS|. The ‘discrepancies’ in term of information content between the query-protein and the database-proteins are expressed. By ranking these N measurements, we can easily identify the most similar proteins to the query-protein as those which have been assigned the lowest distance D(Sq,Si).
3
Experiments
3.1 Proteins database
The strategy proposed for measuring protein similarity was presented and validated using a set of 1460 proteins extracted from Astral SCOP 1.67 sequence resource database. From the available/original corpus of data, only those families containing at least 10 protein sequences were included in our new database (this restriction will be appreciated later, since it was dictated by the Precision measure adopted for evaluation). In this way, 31 different families unequally populated were finally included. We mention that the annotation of our database follows the original annotation, relaying on the biological meaning of similarity concept (and therefore can be considered as providing the ‘ground-truth’ for the protein classification and the attempted similarity measurements). As a consequence, we expected that all the proteins belonging to the same family would appear as a tight cluster of textual patterns and having a proper similarity measure we could differentiate the existent families.
Our database (of 1460 proteins) was organized in 3 different sets, since the experimental results obtained with the new methods had to be compared with the results obtained with CLUSTALW method that could accept as input, protein sets with up to 500 sequences. The complete protein database (organized in 3 data sets) is available up on request and/or it will be publicly available at the Biopattern website of our laboratory (see acknowledgment section).
3.2 Experimental Results
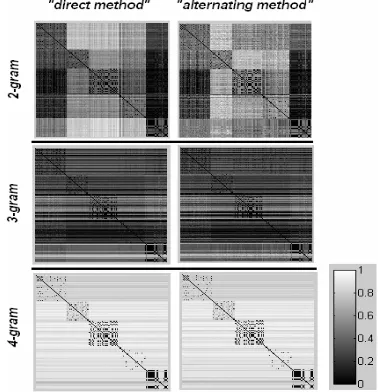
In order to illustrate the two methods of the proposed strategy, first we followed some classical steps of Exploratory Data Analysis. The matrix containing all possible dissimilarity measures D(Si,Sj), i,j=1,2,…N for the sets 1-3 is depicted in Figures 1-3 respectively. The images are presenting in grey scale the two considered methods corresponding to three different n-gram models. In the adopted visualization scheme all the shown matrices (after proper normalization) share a common scale in which the 1/white corresponds to the maximum distance in each matrix. It is worth mentioning here that the ‘ideal’ spatial outlay is a white matrix with some black, square segments around the diagonal line. From these three figures, it is clearly evident that the 4-gram based modeling in by both versions of our algorithm has a very good performance when searching within the given database.
We repeated the procedure for all the proteins in the individual sets and finally were averaged the estimated parts in order to provide a total Precision-score for each set separately. To help the reader to appreciate the performance of our algorithms, we
[image:7.612.137.488.74.272.2]Fig. 2. Visualization of the matrices containing all the possible pairwise dissimilarities for the 497 proteins of Set2, for 2,3,4-gram models.
Fig. 1. Visualization of the matrices containing all the possible pairwise dissimilarities for the 497 proteins of Set1, for 2,3,4-gram models.
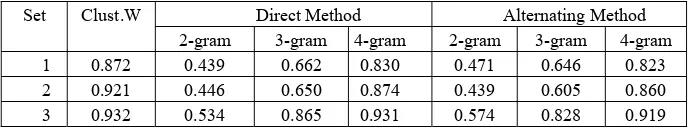
[image:7.612.203.392.337.533.2]repeated the same experimental procedure using the similarity scores obtained by applying the CLUSTAL W method to the 3 different protein sets. The available CLUSTAL W tool requires a set of input parameters, and we decided to use the default values: Protein Gap Open Penalty = 10.0, Protein Gap Extension Penalty = 0.2, Protein matrix = Gonnet, provided at the European Molecular Biology Laboratory and European Bioinformatics Institute (EMBL-EBI) web site (http://www.ebi.ac.uk/). In Table 1 are included the precision scores provided by CLUSTAL W and both of our approaches for different n-gram models. It is worth mentioning that our algorithmic strategy almost reaches (in the case of 4-gram modeling for the third set) the high performance of CLUSTAL W method. For the sake of completeness, we repeated the Precision measurements with our method for the overall set of 1460 proteins. The computed values were not significant different from the values corresponding to the three different sets, providing some evidence about the robustness of our method, indicating that its performance scales well with the size of the database.
Table 1. The precision scores obtained from similarity results given by CLUSTAW tool are in column ‘CLUST.W’, followed by those obtained using our similarity methods for 2,3,4-gram models for the three data sets.
Direct Method Alternating Method Set Clust.W
2-gram 3-gram 4-gram 2-gram 3-gram 4-gram 1 0.872 0.439 0.662 0.830 0.471 0.646 0.823 2 0.921 0.446 0.650 0.874 0.439 0.605 0.860 3 0.932 0.534 0.865 0.931 0.574 0.828 0.919
4
Conclusions
The method we experimented and presented in this paper constitutes a step forward in investigating the engagement of language modelling for characterizing, handling and understanding biological data in the format of sequences. Specifically, we studied the efficiency and effectiveness for searching in protein database of the new measurement method. The experimental results indicate the reliability of our algorithmic strategy for expressing similarity between proteins. Given the conceptual simplicity of the introduced approach, it appears as an appealing alternative to previous well-established techniques.
From the experimens, the direct method seems to perform slightly better. If the second method would perform better, we should expect to have significant length differences between sequences classified as similar and belonging to the same family. In the exceptional case when all the compared sequences would have the same length, the direct method is equivalent with the alternating method and performs very well.
uniform and very low. This sets an upper limit for our model order in the specific database (perhaps slightly higher order model could work in different protein databases).
If we pay more attention to the visual representation of our results (the emerging spots along the main diagonal in the 2D-displays correspond to well-formed groups of proteins, especially in the case of 4-gram modelling), we can consider that the structure revealed by using the new similarity measures bears a biological meaning. More explicitly, we assume that each defined group is indicative for the existence of a family/superfamily of proteins. Despite the fact that this aspect requires a deeper exploration, which is beyond the scope of this paper, it provides a hint that the new measures can be exploited within a proper clustering framework for mining extra information from given biological databases.
The comparison of our similarity scores with those provided by the CLUSTAL W method showed that in terms or performance in retrieval our method approaches the CLUSTAL W one. Considering the algorithmic simplicity and computational efficiency of the new approach, we are justified to suggest it as first choice when search in large databases are required. In terms of time complexity, in absence of a detailed analysis, we are motivated to consider this method as efficient especially when search procedure is running over large sequence databases with long strings of sequences. This motivates us to pursue further on how to achieve even higher performance. At this point, we have to remark that this is only a statistical in nature technique and it could be improved by incorporating biological knowledge such as working with functional groups of amino acids.
ACKNOWLEDGMENT
This work was supported by the EU project Biopattern: Computational Intelligence for biopattern analysis in Support of eHealthcare, Network of Excellence Project No. 508803.
References
1. T. Smith, and M. Watermann, Identification of common molecular subsequences,
J. Mol. Biol. vol.147, pp.195-197 (1981).
2.A. Krogh, M. Brown, I. Mian, K. Sjolander, and D. Haussler, Hidden Markov models in computational biology: Application to protein modeling, J. Mol. Biol., vol.235, pp.1501-1531 (1994).
3.P. Baldi, Y. Chauvin, T. Hunkapiller, and M.A. McClure, Hidden Markov models of biological primary sequence information, in Proc. Natl. Acad. Sci. USA, vol.91(3), pp.1059-1036 (1994).
5.H. Saigo, J-P. Vert, N. Ueda, and T. Akutsu, Protein homology detection using string alignment kernels, J. Bioinformatics, vol.20 no.11, pp.1682-1689 (2004).
6.M.K. Ganapathiraju, J. Klein-Seetharaman, N. Balakrishnan and R. Reddy, Characterization of protein secondary structure-application of latent semantic analysis using different vocabulary, IEEE Signal Processing Magazine, vol. 21, no.3, pp. 78-87 (2004).
7. N. Krasnogor, and D. A. Pelta, Measuring the similarity of protein structures by means of the universal similarity metric, Bioinformatics Advance Access, vol. 20, pp. 1015-1021 (2004).
8.C.D. Manning, and H. Schütze, 2000, Foundations of statistical natural language processing, Massachusetts Institute of Technology Press, Cambridge, Massachusetts London, England,pp.554 – 556;557 – 588.
9.D. Jurafsky, and J. Martin, 2000, Speech and Language Processing, Prentice Hall, pp. 223-231.
10. M. Ganapathiraju, V. Manoharan, and J. Klein-Seetharaman, Statistical sequence analysis using n-grams, J. Appl. Bioinformatics, vol.3 (2), pp.193-200 (2004).
11. S. Erhan, T.Marzolf, and L. Cohen, Amino-acid neighborhood relationships in proteins: breakdown of amino-acid sequences into overlapping doublets, triplets and quadruplets, Int. J. Biomed Comput, vol. 11(1), pp.67-75 (1980).
12. A.Bogan-Marta, N.Laskaris, M.A.Gavrielides, I.Pitas, and K. Lyroudia, A novel efficient protein similaritymeasure based on n-gram modeling, on electronical proceedings of CIMED2005, pp. 122-127.
13. S. Wang, D. Schuurmans, F. Pengun, and Y. Zhao, Semantic N-gram Language Modeling With The Latent Maximum Entropy Principle. In IEEE International Conference on Acoustics, Speech, and Signal Processing (ICASSP-03) available at : http://citeseer.nj.nec.com/575237.html
14. D. Van Compernolle, Spoken Language Science and Technology, 2003, http://www.esat.kuleuven.ac.be/~compi/pub/spoken_language/TOC.htm
15. P.F. Brown, A. S. Della Pietra, V.J. Della Pietra, L.R. Mercer Robert, and C.L. Jennifer, An estimation of an upper bound for the entropy of English, in Association for Computational Linguistics, Yorktown Heights, NY 10598, P.O. Box 704, 1992.
16. D.H. Van Uytsel, and D.Van Compernolle, Entropy-based context selection in variable-length n-gram language models, IEEE Benelux Signal Proc. Symp., pp. 227-230 (1998).