Age-Standardized Mortality Rates Related to Cirrhosis in
Brazil from 2000 to 2012: A Nationwide Analysis
Hugo Perazzo,* Antonio G. Pacheco,** Raquel De Boni,* Paula M. Luz,* Juliana Fittipaldi,* Sandra W. Cardoso,* Beatriz Grinsztejn,* Valdiléa G. Veloso* * Evandro Chagas National Institute of Infectious Disease (INI) - Fundação Oswaldo Cruz (FIOCRUZ), Laboratory of clinical research on STD/AIDS, Rio de Janeiro, Brazil. ** Programa de Computação Científica (PROCC) - Fundação Oswaldo Cruz (FIOCRUZ), Rio de Janeiro, Brazil
March-April, Vol. 16 No. 2, 2017: 269-278
INTRODUCTION
Identification of major public health issues is the first step in implementing programs to prevent, perform early diagnosis and treat high burden diseases. Chronic liver dis-eases have emerged as major causes of global health burden and have led to an increasing economic impact on health care systems.1 Direct and indirect costs for liver disease
management have substantially increased nowadays, espe-cially in the era of interferon-free treatment for hepatitis C.2
Liver-related mortality rates have been increasing worldwide. Several studies have described the burden of liver disease in the United States3,4 and Europe.5 This
trend was followed in Latin America, where approxima-tively 2 million cases of chronic liver disease are expected in the next 40 years.6 Liver cirrhosis has been described as
the most frequent liver-related cause of death worldwide.7
The top leading causes of cirrhosis are viral hepatitis, alco-hol abuse and non-alcoalco-holic fatty liver disease. Patients with cirrhosis have 3-fold higher risk of overall mortality than matched controls.8 However, few studies have
evalu-ated the burden of liver disease in low- or middle-income countries, such as Brazil. The aim of this study was to esti-mate mortality rates associated with cirrhosis in Brazil from 2000 to 2012.
MATERIAL AND METHODS
This is an analytic ecological study performed at the Evandro Chagas National Institute of Infectious Disease (INI/FIOCRUZ). The National Registry of Death data-base (SIM - Sistema de Informação sobre Mortalidade) from the Brazilian Unified Health System Information Technology Department (DATASUS) was analyzed to
es-The Official Journal of the Mexican Association of Hepatology, the Latin-American Association for Study of the Liver and
the Canadian Association for the Study of the Liver
Manuscript received: Manuscript received:Manuscript received:
Manuscript received:Manuscript received: May 19, 2015. Manuscript accepted:Manuscript accepted:Manuscript accepted:Manuscript accepted:Manuscript accepted: July 13, 2016.
DOI:10.5604/16652681.1231586.
A B S T R A C T A B S T R A C T A B S T R A C T A B S T R A C T A B S T R A C T
Background. Background.Background. Background.
Background. Cirrhosis remains the most frequent liver-related cause of death worldwide and we aimed to evaluate its burden in Brazil from 2000 to 2012. Material and methods.Material and methods.Material and methods.Material and methods. The Brazilian National Death Registry was analyzed from 2000 to 2012. DeathMaterial and methods. by cirrhosis was defined by the presence of I85, K73 and/or K74 ICD-10 codes in contributing or underlying causes of death on the death certificate (DC). Crude mortality rates were calculated as the ratio of the absolute number of deaths and the estimated popula-tion. Mortality rates were age-adjusted by the direct standardization method using the WHO standard populapopula-tion. Results.Results.Results.Results.Results. A total of 265,180 deaths where cirrhosis was mentioned on the DC [77% male, aged 56 years] occurred from 2000 to 2012. Cirrhosis codes were present in 46% of liver-related deaths and 2% of all deaths in this period. Despite an increase in the absolute number of deaths (n = 18,245 to 22,340), the age-standardized mortality rates (95%CI) decreased from 13.32 (13.16-13.48) to 11.71 (11.59-11.83) per 100,000 inhabitants from 2000 to 2012 (p < 0.001). This trend was not uniform across the country, with decreases in death rates in the South [14.46 (14.07-14.87) to 10.89 (10.59-11.19)] and Southeast [15.85 (15.6-16.09) to 12.52 (12.34-12.70)] and increases in the North [8.84 (8.24-9.43) to 11.53 (11.08-11.99)] and Northeast [9.41 (9.13-9.69) to 10.93 (10.68-11.17)] (p < 0.001 for all). Con-Con-Con-Con- Con-clusion.
clusion.clusion. clusion.
clusion. Cirrhosis remains a major public health issue, despite the reduction in mortality rates in the last decade.
Key words. Key words.Key words. Key words.
timate the age-adjusted mortality rates associated with cir-rhosis from 2000 to 2012.
The study protocol was conducted in accordance with the Helsinki Declaration and it was approved by the local Ethics Committee. SIM is an open-source and web availa-ble database (www.datasus.gov.br) published in a public domain and provided by the Brazilian Ministry of Health. This database contains anonymous data for all deaths in Brazil since 1979. Primary, secondary and contributing causes of death, based on the death certificate (DC) have been electronically registered in SIM since 1999. The un-derlying cause of death is determined as the “disease of in-jury which initiates the train of events leading directly to death”. If more than one cause or condition were listed on the DC, the underlying cause was determined by the se-quence of conditions using standard algorithms.9 Causes
of death have been classified according to the 10th revision of the International Classification of Diseases (ICD-10) since 1996. The Brazilian Institute of Geography and Sta-tistics (IBGE) has provided estimation of population in Brazil and its macro-regions for the past four decades. So-cio-demographic statistics of the resident population were based on the 10-year interval census (1980, 1991, 2000 and 2010) and the annual inter-census projections performed by IBGE. Statistics of estimated Brazilian population are web available (www.ibge.gov.br) and can be stratified by age, gender and geographic localization.
Liver-related deaths were defined by the following ICD-10 codes: viral hepatitis [B15-B19]; hepatocellular or cholangiocarcinoma [C22.0, C22.1]; alcoholic liver disease [K70]; cirrhosis [I85, K73 and K74] and other liver diseas-es [K71, K72, K75, K76]. The prdiseas-esence of I85, K73 or K74 ICD-10 codes in any field of the DC defined cirrhosis. Deaths classified as R00-R99 [Symptoms, signs and abnor-mal clinical and laboratory findings, not classified else-where] were considered as ill-defined or of unknown cause of death as these codes do not give any information concerning the possible conditions that led to death.10 The
number of deaths and the crude mortality rate due to ill-defined or unknown cause of death were used to estimate the quality of death registration.11 Macro-regions of Brazil
were defined by IBGE as legally valid subnational units known as North, Northeast, Center-West, Southeast and South regions.
Brazilian mortality rates related to cirrhosis were ana-lyzed from 2000 to 2012 (the latest year available at the time of the present analysis). Deaths due to cirrhosis were reported as absolute numbers and as crude mortality rates (expressed per 100,000 inhabitants). In addition, the crude mortality rates were adjusted for age using a standard pop-ulation to define the age-standardized mortality rates (ex-pressed per 100,000 inhabitants). Crude mortality rate was calculated as the ratio of the total number of deaths in a
pe-riod to the estimated resident population in the same peri-od. The age-standardized mortality rate was calculated us-ing the direct standardization method which is the weighted average of the age-specific rates from the stand-ard population.12,13 The World Standard population
(2000-2025) reported by the World Health Organization (WHO) was used as the standard population to apply the direct standardization method in the study.14,15 Data management
and mortality rate calculations (with 95% confidence in-terval) were performed using the software STATA (2012; StataCorp LP, College Station, TX, USA).
Annual trends in the mortality rates were assessed using Poisson regression models with deaths due to cirrhosis as the dependent variable, year as the continuous independ-ent variable and log (population) as an offset to adjust for the population at risk by year. Models' residuals were in-spected graphically. These plots showed random disper-sion of residuals as a function of time so the linear assumption was deemed valid. To explore the impact of ill-defined deaths on the observed trends, ill-defined deaths were proportionally redistributed according to the defined causes (i.e. cirrhosis and other causes) by age. Af-ter redistribution, trends were tested using the same methodology described above.
RESULTS
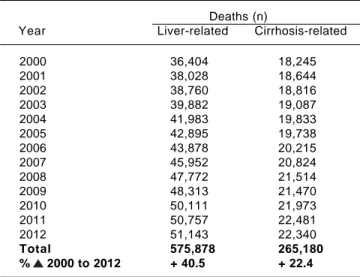
A total of 13,672,446 deaths occurred in Brazil from 2000 to 2012. Cardiovascular disease, non-liver cancer and external causes were the top ranking causes of death. A to-tal of 575,878 (4.2%) deaths had ICD-10 codes of liver dis-eases mentioned on their DC. Cirrhosis was the primary or the underlying cause for 265,180 deaths. Thus, cirrhosis was mentioned in any field of the DC in 46% of liver-re-lated deaths and 2% of all deaths in this period. Deaths that have mention of liver diseases as well as those with mention of cirrhosis on their DC increased in absolute numbers from 2000 to 2012 (Table 1).
The majority of individuals who had mention of cir-rhosis on the DC were male (77%), aged > 40 years-old (90%) and self-declared ethnicity as Caucasian (54%). The median (IQR) age at time of death due to cirrhosis was 56 (47-67) years and most cases occurred in the Southeast re-gion (52%), the most populated area corresponding to 42% of the Brazilian population. A total of 18% (n = 47,695) and 9% (n = 23,692) of cirrhosis-related deaths had men-tion of alcoholic liver disease [K70] and viral hepatitis [B15-B19] on their death certificates, respectively. Table 2 summarizes the demographic characteristics of individu-als who have mention of cirrhosis in their DC in Brazil from 2000 to 2012.
to 2012 [in men from 21.63 to 18.95 and in women from 5.75 to 5.32]. Males presented 4-fold higher age-standard-ized cirrhosis mortality rate compared to females (Table 5). In stratification by age groups, the crude cirrhosis mor-tality rate starts to become expressive (> 10 deaths per 100,000 inhabitants) in persons older than 40 years of age. In 2012 the crude cirrhosis mortality rate remained very high in individuals aged 50-59 years in all of Brazil's macro-regions [North = 25.16; Northeast = 26.57; South-east = 33.96; South = 30.69 and Center-West = 28.83 deaths per 100,000 inhabitants] (Table 6).
Table 1. Absolute number of deaths from liver diseases and cir-rhosis from 2000 to 2012 in Brazil.
Deaths (n)
Year Liver-related Cirrhosis-related
2000 36,404 18,245
2001 38,028 18,644
2002 38,760 18,816
2003 39,882 19,087
2004 41,983 19,833
2005 42,895 19,738
2006 43,878 20,215
2007 45,952 20,824
2008 47,772 21,514
2009 48,313 21,470
2010 50,111 21,973
2011 50,757 22,481
2012 51,143 22,340
Total 575,878 265,180 % 2000 to 2012 + 40.5 + 22.4
Definition of cause of death was based on the 10th revision of the Interna-tional Classification of Diseases (ICD-10) Liver-related death [ICD-10]: [B15-B19]; [C22.0, C22.1]; [K70]; [I85, K73 and K74] and [K71, K72, K75, K76]. Cirrhosis-related death [ICD-10]: [I85, K73 and K74].
Table 2. Demographic characteristics of people who had men-tion of cirrhosis in their death certificate (ICD-10: I85/K73/K74) from 2000 to 2012 in Brazil.
Cirrhosis-related deaths (n = 265,180)
Gender; n (%)
Male 203,271 (76.65)
Female 61,860 (23.33)
NA 49 (0.02)
Age groups; n (%)
< 20 years 1,543 (0.58)
20-29 years 4,607 (1.74)
30-39 years 23,056 (8.69)
40-49 years 56,237 (21.21)
50-59 years 69,754 (26.30)
60-69 years 55,614 (20.97)
70-79 years 36,687 (13.83)
≥ 80 years 16,523 (6.23)
NA 1,159 (0.44)
Ethnicity; n (%)
Caucasian 142,154 (53.61)
miscegination ("pardo") 80,125 (30.22)
African-Black 19,495 (7.35)
Asiatic 1,398 (0.53)
Indigenous 500 (0.19)
NA 21,508 (8.11)
Education in years of study; n (%)
< 1 year 27,541 (10.39)
1 to 3 years 53,604 (20.21)
4 to 7 years 49,931 (18.83)
8 to 11 years 24,378 (9.19)
≥ 12 years 11,688 (4.41)
NA 98,371 (36.97)
Geographic macro-regions; n (%)
North 12,678 (4.78)
Northeast 57,265 (21.59)
Southeast 138,259 (52.14)
South 41,754 (15.75)
Center-West 15,224 (5.74)
Alcoholic liver disease and viral hepatitis were defined as ICD-10 K70 and B15-B19, respectively. IQR: inter-quartil range. NA: not available; "pardo". miscegination between caucasian and african-black. Population distribution in Brazil: North = 8%; Northeast = 28%; Southeast = 42%; South = 15% and Center-West = 7%.
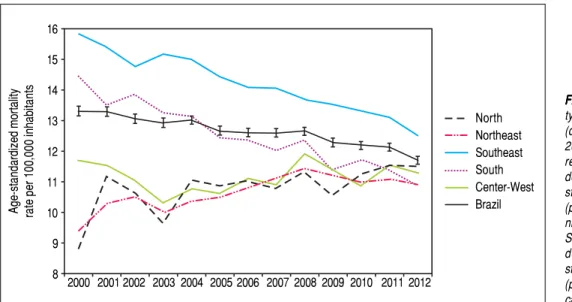
per 100,000 inhabitants in Brazil. The Southeast region [12.52 (12.34-12.70)] had the highest and the South region [10.89 (10.59-11.19)] the lowest age-standardized cirrhosis mortality rate in this year. From 2000 to 2012 the age-stand-ardized cirrhosis mortality rate decreased by 12% [from 13.32 (13.16-13.48) to 11.71 (11.59-11.83)] among individu-als living in Brazil; the decreasing trend was statistically significant (p < 0.001). However, this trend was not uni-form across the country. Age-standardized cirrhosis mor-tality rates decreased by 25% and 21% from 2000 to 2012 in the South [14.46 (14.07-14.87) to 10.89 (10.59-11.19)] and Southeast [15.85 (15.6-16.09) to 12.52 (12.34-12.70)] re-gions, respectively; again, for both rere-gions, the decreasing trend was statistically significant (p < 0.001). In contrast, mortality rates remained relatively stable (a reduction of 3.6%) in the Center-West region [11.72 (11.10-12.34) to 11.30 (10.83-11.77)] with a non-significant trend (p = 0.41). Additionally, mortality rates increased by 30% and 16% in the North [8.84 (8.24-9.43) to 11.53 (11.08-11.99)] and Northeast [9.41 (9.13-9.69) to 10.93 (10.68-11.17)] re-gions, respectively, (Table 3) with both regions showing statistically significant increasing trends (p < 0.001). The trends described above were also observed after ill-de-fined deaths were redistributed with the only change ob-served in the Center-West region for which a borderline significant increasing trend (p = 0.06) was obtained (Table 4). Figure 1 plots the evolution of the age-standardized cir-rhosis mortality rates in Brazil and its macro-regions throughout the 13 years of analysis.
Table 4. Age-standardized cirrhosis mortality rate [95% confidence interval] in Brazil and its macro-regions from 2000 to 2012 after proportional distribution of ill-defined deaths according to the defined causes (i.e. cirrhosis and other causes).
North Northeast Southeast South Center-West Brazil
2000 8.84 9.41 15.85 14.46 11.72 13.32
[8.24-9.43] [9.13-9.69] [15.6-16.09] [14.07-14.87] [11.10-12.34] [13.16-13.48]
2001 11.20 10.24 15.41 13.52 11.64 13.28
[8.10-9.50] [9.96-10.53] [15.18-15.65] [13.14-13.90] [11.04-12.25] [13.13-13.44]
2002 10.80 10.41 14.86 13.84 11.28 13.08
[10.0-11.50] [10.12-10.69] [14.63-15.08] [13.46-14.21] [10.70-11.87] [12.93-13.23]
2003 9.70 9.99 15.28 13.19 10.60 12.97
[9.00-10.40] [9.72-10.27] [15.05-15.50] [12.82-13.56] [10.04-11.17] [12.82-13.12]
2004 11.10 10.42 15.15 13.08 10.98 13.10
[10.30-11.80] [10.15-10.69] [14.93-15.37] [12.72-13.44] [10.42-11.54] [12.96-13.25]
2005 11.20 11.23 14.66 12.47 10.95 13.00
10.50-11.90] [10.96-11.50] [14.44-14.87] [12.12-12.82] [10.40-11.49] [12.86-13.14]
2006 11.60 12.29 14.29 12.39 11.47 13.15
[10.90-12.30] 12.02-12.56] [14.08-14.50] [12.04-12.73] [10.93-12.00] [13.01-13.29]
2007 11.60 12.71 14.27 12.06 11.29 13.18
[10.90-12.30] [12.44-12.98] [14.06-14.47] [11.72-12.39] [10.77-11.82] [13.04-13.36]
2008 12.00 13.00 13.91 12.42 12.32 13.23
[11.30-12.70] [12.73-13.27] [13.71-14.11] [12.08-12.75] [11.80-12.85] [13.09-13.36]
2009 11.10 12.69 13.79 11.38 11.80 12.84
[10.40-11.80] [12.43-12.95] [13.59-13.98] [11.06-11.70] [11.29-12.31] [12.71-12.98]
2010 11.90 12.39 13.55 11.77 11.22 12.73
[11.20-12.50] [12.13-12.65] [13.36-13.74] [11.46-12.09] [10.72-11.71] [12.60-12.86]
2011 12.10 12.41 13.40 11.46 11.83 12.67
[11.50-12.80] [12.16-12.66] [13.22-13.59] [11.15-11.77] [11.34-12.32] [12.54-12.80]
2012 12.10 12.22 12.86 10.96 11.69 12.26
[11.40-12.80] [11.97-12.46] [12.68-13.04] [10.66-11.26] [11.21-12.16] [12.14-12.38]
% 2000 + 36.9% + 29.9% -18.9% -24.2% +0.26% -7.96% to 2012
p value < 0.001 < 0.001 < 0.001 < 0.001 0.06 < 0.001
Age-standardized mortality rate [95% confidence interval) adjusted by the WHO population using the direct method.
Table 3. Age-standardized cirrhosis mortality rate [95% confidence interval] according to macro-regions in Brazil from 2000 to 2012.
North Northeast Southeast South Center-West Brazil
2000 8.84 9.41 15.85 14.46 11.72 13.32
[8.24-9.43] [9.13-9.69] [15.6-16.09] [14.07-14.87] [11.10-12.34] [13.16-13.48]
2001 11.19 10.30 15.40 13.50 11.56 13.30
[10.56-11.82] [10.02-10.59] [15.17-15.63] [13.12-13.89] [10.95-12.16] [13.15-13.45]
2002 10.68 10.52 14.77 13.86 11.07 13.07
[10.08-11.27] [10.24-10.81] [14.54-15.0] [13.48-14.24] [10.49-11.66] [12.92-13.22]
2003 9.68 10.04 15.17 13.27 10.33 12.94
[9.12-10.25] [9.77-10.31] [14.95-15.40] [12.90-13.64] [9.77-10.89] [12.79-13.09]
2004 11.09 10.37 15.00 13.14 10.79 13.03
[10.51-11.67] [10.10-10.64] [14.78-15.22] [12.79-13.51] [10.23-11.34] [12.88-13.17]
2005 10.90 10.52 14.42 12.46 10.64 12.68
[10.33-11.45] [10.25-10.79] [14.21-14.64] [12.12-12.81] [10.09-11.18] [12.53-12.82]
2006 11.03 10.80 14.09 12.38 11.13 12.62
[10.48-11.58] [10.54-11.07] [13.88-14.30] [12.04-12.73] [10.60-11.66] [12.48-12.76]
2007 10.80 11.10 14.06 12.04 10.92 12.60
[10.27-11.33] [10.84-11.37] [13.86-14.27] [11.70-12.38] [10.40-11.44] [12.47-12.74]
2008 11.37 11.45 13.68 12.36 11.93 12.66
[10.85-11.89] [11.18-11.71] [13.48-13.88] [12.03-12.70] [11.41-12.45] [12.52-12.79]
2009 10.57 11.20 13.53 11.35 11.41 12.29
[10.06-11.08] [10.95-11.46] [13.34-13.73] [11.04-11.68] [10.91-11.92] [12.16-12.43]
2010 11.26 10.98 13.30 11.73 10.89 12.20
[10.76-11.77] [10.73-11.24] [13.11-13.50] [11.41-12.05] [10.40-11.39] [12.07-12.33]
2011 11.50 11.09 13.11 11.38 11.58 12.13
[11.03-11.98] [10.85-11.35] [12.93-13.30] [11.07-11.69] [11.09-12.06] [12.01-12.26]
2012 11.53 10.93 12.52 10.89 11.30 11.71
[11.08-11.99] [10.68-11.17] [12.34-12.70] [10.59-11.19] [10.83-11.77] [11.59-11.83]
% 2000 +30.4% +16.2% -21.0% -24.7% +3.6% -12.1% to 2012
p value < 0.001 < 0.001 < 0.001 < 0.001 0.41 < 0.001
Table 5. Description of crude and age-standardized cirrhosis mortality rate by gender from 2000 to 2012 according to macro-regions in Brazil.
Mortality Rate 2000 2001 2002 2003 2004 2005 2006 2007 2008 2009 2010 2011 2012
North
crude M 7.26 9.64 9.22 8.07 9.46 9.46 9.74 9.52 10.10 9.74 10.57 10.39 10.82
F 2.72 2.97 2.70 2.72 3.09 3.04 2.98 3.26 3.58 3.11 3.48 4.00 3.61
age- M 12.61 16.85 16.25 14.21 16.37 16.36 16.65 16.15 16.59 16.08 16.72 16.55 17.23
standarized F 4.81 5.24 4.87 4.99 5.62 5.29 5.25 5.38 6.08 5.03 5.72 6.44 5.84
Northeast
crude M 10.33 11.54 12.06 11.29 12.00 12.45 12.90 13.45 14.00 14.20 13.88 14.57 14.50
F 3.34 3.55 3.60 3.72 3.72 3.64 3.93 4.15 4.46 4.12 4.44 4.31 4.46
age- M 15.03 16.62 17.07 15.98 16.77 17.37 17.67 18.14 18.52 18.60 17.78 18.34 17.97
standarized F 4.37 4.63 4.65 4.74 4.69 4.52 4.78 4.96 5.25 4.77 5.04 4.79 4.86
Southeast
crude M 21.36 21.09 20.48 21.26 21.50 20.76 20.31 20.88 20.38 20.50 20.62 20.55 20.15
F 5.95 5.72 5.61 5.96 5.93 6.04 6.23 6.18 6.42 6.54 6.49 6.72 6.42
age- M 26.10 25.65 24.61 25.09 24.91 23.67 22.93 23.12 22.19 21.91 21.64 21.10 20.35
standarized F 6.71 6.36 6.15 6.44 6.25 6.27 6.34 6.13 6.25 6.21 6.03 6.10 5.67
South
crude M 19.52 17.99 19.32 18.69 18.98 18.02 18.14 18.24 18.97 17.73 18.71 18.49 17.86
F 5.16 5.39 5.11 5.13 5.03 5.13 5.37 5.17 5.53 5.26 5.59 5.55 5.67
age- M 23.97 21.82 23.04 21.90 21.94 20.48 20.11 19.81 20.21 18.52 19.04 18.51 17.50
standarized F 5.90 6.05 5.63 5.56 5.33 5.33 5.46 5.13 5.36 4.97 5.15 5.01 4.98
Center-West
crude M 13.22 12.97 12.30 11.72 12.44 12.49 13.49 13.20 14.84 14.88 14.26 15.80 15.36
F 3.08 3.33 3.64 3.34 3.62 3.50 3.71 3.85 4.31 3.84 4.19 4.03 4.41
age- M 18.85 18.47 16.95 16.08 16.77 16.72 17.72 17.12 18.74 18.40 17.18 18.92 18.00
standarized F 4.59 4.74 5.28 4.70 4.99 4.76 4.83 4.99 5.44 4.78 4.94 4.68 5.02
Brazil
crude M 16.31 16.48 16.47 16.35 16.85 16.52 16.56 16.92 17.13 17.02 17.15 17.37 17.09
F 4.66 4.69 4.62 4.78 4.80 4.83 5.03 5.07 5.37 4.25 5.38 5.46 5.39
age- M 21.63 21.69 21.40 21.01 21.32 20.67 20.44 20.53 20.39 19.96 19.68 19.58 18.95
standarized F 5.75 5.72 5.56 5.68 5.60 5.54 5.66 5.58 5.79 4.47 5.56 5.51 5.32
Crude mortality rate was calculated as number of death/estimated population and expressed per 100,000 inhabitants. Age-standardized mortality rate adjusted for WHO population.
Figure 1. Figure 1. Figure 1. Figure 1.
Figure 1. Age-standardized mortali-ty rates associated with cirrhosis (deaths per 100,000 inhabitants) from 2000 to 2012 in Brazil and its macro-regions. Brazil: statistically significant decreasing trend (p < 0.001). North: statistically significant increasing trend (p < 0.001). Northeast: statistically sig-nificant increasing trend (p < 0.001). Southeast: statistically significant decreasing trend (p < 0.001), South: statistically significant decreasing trend (p < 0.001). Center-West: non-signifi-cant trend (p = 0.41).
2000 2001 2002 2003 2004 2005 2006 2007 2008 2009 2010 2011 2012
North Northeast Southeast South Center-West Brazil Age-standardized mortality rate per 100,000 inhabitants
A total of 1,327,364 deaths were classified as ill-defined causes of death from 2000 to 2012 in Brazil. The crude mortality rate of ill-defined or unknown causes of death remained very high in 2012 in Brazil: 38.63 deaths per 100,000 inhabitants, with the North region having the highest (46.42) and Center-West the lowest (16.92) rates. However, absolute number of deaths and the mortality rate by ill-defined causes decreased from 135,749 to 74,935 (-45%) and from 79.95 to 38.63 (-52%) per 100,000 inhabit-ants from 2000 to 2012 in Brazil, respectively. In addition, the absolute number of deaths and crude mortality rate of ill-defined or unknown causes of death also reduced in all of Brazil's macro-regions in the same period. The higher
percentage of reduction in these parameters was observed in the North and Northeast regions reflecting a possible improvement in data quality in the last decade (Table 7).
DISCUSSION
The present study highlights the burden of mortality due to cirrhosis in Brazil from 2000 to 2012. The analysis of a nationwide death registry database showed a decrease in age-standardized mortality rate associated with cirrhosis from 2000 to 2012 in Brazil. Despite this favorable evolu-tion, cirrhosis still causes approximately 20,000 deaths per year and remains a major public health issue in Brazil.
Table 6. Mortality rate due to cirrhosis in age groups according to macro-regions from 2000 to 2012 in Brazil.
Age 2000 2001 2002 2003 2004 2005 2006 2007 2008 2009 2010 2011 2012
(years)
North < 20 0.41 0.50 0.31 0.24 0.30 0.28 0.23 0.41 0.29 0.22 0.17 0.14 0.20
20-29 1.77 1.95 1.46 1.23 1.19 1.34 1.00 1.11 1.33 1.38 1.33 1.25 0.57
30-39 5.11 5.12 5.18 4.55 4.56 4.47 4.52 4.61 4.11 3.68 3.68 3.16 2.70
40-49 10.82 15.03 14.36 11.84 13.80 13.38 12.99 12.43 15.12 11.34 13.06 12.77 11.21
50-59 21.76 26.73 23.91 21.50 27.29 25.64 25.29 23.24 23.36 23.93 27.64 25.69 25.16
60-69 28.02 40.92 31.99 29.82 38.28 36.56 40.51 36.97 37.50 40.33 40.83 40.61 43.82
70-79 39.68 49.55 59.18 56.35 50.97 54.24 56.75 63.64 62.00 55.68 52.17 66.25 70.46
≥ 80 50.16 52.91 67.29 65.10 79.00 80.28 75.42 70.39 91.94 75.22 90.55 94.47 98.62
Northeast < 20 0.18 0.16 0.13 0.18 0.16 0.16 0.18 0.16 0.14 0.12 0.10 0.14 0.12
20-29 1.14 1.21 1.44 1.02 1.00 1.01 1.04 1.21 1.10 0.93 1.02 1.03 0.93
30-39 6.11 6.57 7.52 5.98 6.06 5.55 5.81 6.12 6.52 5.87 5.34 5.42 5.28
40-49 15.97 17.41 17.16 15.76 16.63 15.00 15.87 16.28 16.86 15.88 16.20 15.91 15.71
50-59 23.87 26.97 26.58 25.36 25.86 26.57 27.67 27.65 28.69 26.22 27.70 28.27 26.57
60-69 28.76 31.50 33.14 33.17 34.08 34.69 34.59 34.81 36.76 40.56 36.61 37.08 37.77
70-79 35.99 38.98 39.79 39.24 41.09 47.86 46.27 49.99 50.42 50.28 47.43 48.16 48.32
≥ 80 40.83 42.94 41.88 48.91 51.58 56.11 61.20 63.32 62.38 63.26 65.35 65.86 66.66
Southeast < 20 0.23 0.21 0.19 0.23 0.21 0.14 0.15 0.13 0.15 0.16 0.13 0.13 0.11
20-29 1.80 1.55 1.30 1.30 1.34 1.10 0.90 0.84 1.00 0.82 0.73 0.65 0.70
30-39 10.24 9.42 8.65 8.63 8.44 7.57 7.25 6.30 5.97 5.44 5.26 5.01 4.43
40-49 28.05 25.72 24.41 24.25 24.37 23.09 20.51 21.33 19.91 19.24 18.14 17.70 16.17
50-59 41.63 41.46 39.15 40.62 40.11 39.33 38.11 39.17 37.41 38.32 37.28 36.07 33.96
60-69 50.60 50.35 48.56 52.55 51.41 50.17 51.51 50.20 49.04 49.44 50.64 51.64 48.81
70-79 56.72 55.21 57.53 59.08 57.59 56.27 57.76 57.98 59.74 58.65 57.53 55.94 58.03
≥ 80 52.55 59.74 56.85 52.94 54.40 53.61 56.84 56.96 56.72 54.40 56.21 57.85 57.93
South < 20 0.25 0.28 0.11 0.17 0.14 0.09 0.17 0.19 0.18 0.12 0.14 0.19 0.09
20-29 1.33 1.15 1.15 0.78 0.92 0.75 0.70 0.84 0.67 0.69 0.71 0.73 0.60
30-39 8.04 7.60 7.67 6.81 6.67 6.17 5.10 5.54 5.87 4.33 3.89 3.93 3.85
40-49 22.07 20.05 20.30 20.07 18.58 16.75 17.30 16.96 17.37 15.15 16.76 14.80 14.91
50-59 40.75 35.84 38.23 35.42 34.89 33.45 33.98 33.86 33.44 32.66 33.72 31.71 30.69
60-69 48.19 48.34 49.28 49.21 50.70 47.24 48.65 43.80 46.53 42.80 43.48 44.50 41.23
70-79 57.55 52.51 54.56 51.98 54.89 54.22 52.40 49.64 50.91 47.30 50.80 51.22 48.97
≥ 80 51.56 54.11 54.22 53.30 47.82 52.20 45.99 48.94 53.24 51.98 48.24 47.52 45.09
Center- < 20 0.21 0.35 0.10 0.22 0.12 0.12 0.24 0.12 0.16 0.22 0.14 0.08 0.16
West 20-29 1.62 1.24 1.13 0.74 0.84 0.91 0.86 0.88 0.95 0.83 0.60 0.63 0.82
30-39 6.78 6.51 6.68 5.60 5.97 5.65 5.99 5.36 5.86 5.55 5.94 5.30 4.37
40-49 19.85 18.37 17.42 16.66 17.64 15.58 17.04 15.32 17.33 16.72 17.34 17.48 17.39
50-59 26.95 27.42 28.09 24.30 26.29 26.94 28.56 27.99 31.36 29.31 27.47 28.73 28.83
60-69 37.71 38.78 36.51 38.44 36.41 34.98 33.04 35.97 39.33 37.86 38.22 43.44 38.64
70-79 49.21 49.25 51.34 42.58 45.28 49.03 51.55 55.63 55.36 52.66 44.74 52.30 51.83
≥ 80 55.15 52.67 33.99 41.41 50.07 52.77 59.65 49.34 56.83 56.91 47.75 49.44 58.90
Cirrhosis remains the most frequent liver-related cause of death worldwide.7 Cirrhosis mortality rates seem to be
higher in individuals with lower levels of education and in areas with lower socioeconomic status.16 Globally,
mor-tality rates associated with cirrhosis decreased from 20.0 (95%CI 13.5-29.4) to 15.8 (10.2-23.6) deaths per 100,000 persons per year from 1980 to 2010, probably driven by a 60% mortality reduction in East Asian countries. Despite the decrease in mortality rates, absolute number of deaths due to cirrhosis had a significant increase in the same peri-od.17 The Global Burden of Disease study, an overview of
national trends in cause-specific mortality in 187 coun-tries, reported a 16% worldwide decrease in age-standard-ized cirrhosis mortality rates from 1990 to 2010 (from 18.6 (95%CI 15.8-20.7) to 15.6 (13.2-17.6) deaths per 100,000 in-habitants).17
In Europe, cirrhosis mortality has been following a strong “East-to-West” gradient.18 An expressive decline in
cirrhosis mortality was observed in Mediterranean coun-tries such as France, Italy, Spain and Portugal.5 Despite
the decrease in mortality rates, cirrhosis continues to be related to 170,000 deaths in 2013 leading the European health authorities to launch programs that aim to signifi-cantly reduce liver mortality and decrease the burden of liver diseases with evidence-based policy measures. In Portugal, hospitalization due to alcoholic cirrhosis in-creased by up to 30% in males and 45% in individuals aged between 40 and 54 years from 1993 to 2008.19
In Latin American countries, the trend of cirrhosis mortality varies widely: mortality rates increased in
Para-guay and decreased in Chile and Argentine.17 In addition,
mortality rates have been increasing in recent years in Mexico, one of the countries with the highest mortality rates due to liver diseases worldwide.20 In a Brazilian
study, Nader, et al. reported more than 800,000 hospitali-zations due to liver disease from 2001 to 2010, most due to cirrhosis (~30,000 admissions per year).21
In the present study, we reported similar trends for age-standardized cirrhosis mortality rates in Brazil com-pared to those globally described in recent years. In our analysis, age-standardized cirrhosis mortality rates (deaths per 100,000 inhabitants) has been statistically significant decreasing from 2000 to 2012 (p < 0.001). This worldwide decrease in cirrhosis mortality rates is probably associated with screening transfused blood for viral hepatitis, imple-mentation of hepatitis B vaccination programs, access to hepatitis C treatments and effective health policies to pre-vent alcoholic liver disease.22 In our study, the
propor-tional mortality rate from cirrhosis decreased from 50.1% to 43.7% from 2000 to 2012 (Table 1). We hypothesize this was likely driven by a better quality of data registration and an 2-fold increase in proportional mortality rates from liv-er cancliv-er (from 2.97% to 5.55%) in this pliv-eriod.
Brazilian age-standardized cirrhosis mortality rates (per 100,000 inhabitants) in 2010 were similar to France (11.2) and Germany (12.4) in Western-Europe; Paraguay (12.5) and Argentina (14.0) in Latin America. We have higher mortal-ity rates than Scandinavian countries (Sweden with 5.4 and Norway with 4.2 deaths per 100,000 inhabitants) and lower rates than Mexico (38.3), Chile (21.8), North African
Table 7. Evolution of number of deaths and mortality rates of ill-defined or unknown causes of deaths [Symptoms, signs and abnormal clinical and laboratory findings, not elsewhere classified (R00-R99)] from 2000 to 2012 according to the macro-regions in Brazil.
North Northeast Southeast South Center-West Brazil
Deaths Mortality Deaths Mortality Deaths Mortality Deaths Mortality Deaths Mortality Deaths Mortality %
rate rate rate rate rate rate
2000 11,396 88.34 64,850 135.84 45,276 62.53 9,622 38.32 4,605 39.57 135,749 79.95 14.34
2001 11,489 86.74 65,546 135.62 44,867 61.07 9,492 37.29 4,372 36.78 135,766 78.76 14.12
2002 10,873 80.51 66,653 136.46 43,019 57.78 9,790 38.04 3,841 31.74 134,176 76.83 13.65
2003 11,190 81.18 65,488 132.68 42,889 56.89 10,508 40.38 3,359 27.27 133,434 75.44 13.31
2004 11,270 80.13 60,702 121.74 41,250 54.04 10,072 38.27 3,628 28.95 126,922 70.86 12.39
2005 9,715 66.09 43,743 85.74 38,552 49.13 9,246 34.28 3,199 24.57 104,455 56.71 10.37
2006 8,391 55.86 24,275 47.04 40,372 50.74 9,424 34.51 3,081 23.22 85,543 45.80 8.29
2007 7,250 47.25 21,147 40.52 39,747 49.29 9,347 33.82 2,753 20.37 80,244 42.38 7.66
2008 7,755 51.21 21,586 40.66 38,372 47.85 8,700 31.64 2,748 20.06 79,161 41.75 7.35
2009 7,920 51.56 21,696 40.48 37,680 46.57 9,050 32.65 2,648 19.06 78,994 41.25 7.16
2010 7,732 48.74 22,196 41.81 38,047 47.34 8,743 31.92 2,904 20.66 79,622 41.74 7.00
2011 7,473 46.43 23,256 43.47 35,962 44.41 8,389 30.44 3,283 23.05 78,363 40.73 6.69
2012 7,589 46.42 22,723 42.15 33,803 41.44 8,379 30.21 2,441 16.92 74,935 38.63 6.34
% from
2000 to 2012 -33% -48% -65% -69% -25% -34% -12% -21% -47% -57% -45% -52% -56%
countries, such as Egypt (72.7), Sub-Saharan Africa and most countries in Asia.5,17 Sub-Saharan Africa has high rates
of liver disease burden and low funds of global health spending.23 However, comparison of mortality rates due
to cirrhosis among countries has been challenged by dif-ferent death report processes and methodologies used in data analysis across the studies. There is no consensus on which ICD-10 codes should be included to consider death by cirrhosis. Mendez-Sanchez, et al. defined cirrho-sis by a strict list of ICD-10 codes (K74.0-K74.6).20 On the
other hand, Mokdad, et al. opted for a broader definition of cirrhosis including ICD codes from chronic hepatitis, alcoholic liver disease and hepatic failure.17 Studies using
data from death certificates have estimated around 30,000 deaths per year due to cirrhosis in the United States.3
However, if codes for viral hepatitis and alcoholic liver disease had been included in these estimates this number would increase to 60,000 deaths per year.4 In addition, the
crude or unadjusted mortality rate should not be used to compare trends of mortality among different countries. The different age distribution of populations can lead to a misunderstanding in comparisons and interpretation of data. If a country has a higher proportion of an ageing pop-ulation, people will have an inherently greater risk of dy-ing compared to a country with a younger population.24
Thus, comparisons of mortality rates between regions or countries should be interpreted with caution due to the considerable variability in death report processes world-wide and methodologies used in data analysis. In the present study, death due to cirrhosis was defined by the presence of I85 or K73 or K74 in the primary, second-ary or contributing causes of death on the DC; mortality rates were age-adjusted using the direct method and the standard population proposed by WHO which has an average world population age-structure constructed for the period 2000-2025.
We acknowledge that our findings are subject to several limitations, mainly associated with the lack of high quality cause of death registration in some Brazilian regions. The proportion of deaths from ill-defined or unknown condi-tions has been commonly used as an indicator of the quali-ty of cause-of-death data.25 However, a low absolute
number or mortality rate of this condition does not neces-sarily mean a high quality in cause-of-death information, as it does not exclude other forms of misclassification.26
Death count coverage in Brazil has increased from 80% in 1980-1991 to more than 95% in 2000-2010.27 Improvement
in data quality seems to be closely associated with invest-ments in the public health care system and death reporting processes.28 Beyond the satisfactory national death count
coverage in the last 10 years, there are still large regional differences in mortality reports in Brazil: data quality seems to be better in the South and Southeast compared to
other regions.29 Taken together, these observations
sug-gest that the decreasing mortality rate observed for the country likely accurately reflects the changing patterns of mortality due to cirrhosis. The analysis within the major regions, on the other hand, should be interpreted with a grain of salt. The better data quality in the South and Southeast regions suggests the observed decreasing trends might be real while the important increase in cirrhosis-re-lated mortality rates in the North and Northeast might be true or an artifact due to a better quality of data registration in these regions in the more recent years. In a sensitive analysis, we reported similar trends on cirrhosis-related mortality in Brazil and its regions when ill-defined deaths were proportionally redistributed according to the defined causes (i.e. cirrhosis and other causes) by age (Table 4).
The proportion of ill-defined causes of death is varia-ble across European countries with very low rates (< 1%) in Finland, United Kingdom, Austria and Italy.10 In our
study, ill-defined or unknown causes of death represented 9.7% of all deaths in the analyzed period. However, this proportion decreased from 14.3% to 6.3% (a reduction of 56%) from 2000 to 2012 in Brazil (Table 6). A study of França, et al., reported that 20% of ill-defined or un-known causes of death [R00-R99] in Brazil in 2010 were reclassified after investigation. The top ranking death causes reclassified were endocrine diseases, mental disor-ders, nervous system and cardiovascular diseases and ma-ternal causes.30 Thus, liver diseases do not seem to be
highly implicated in the reclassification of unknown caus-es of death. Since 2005, the Brazilian Ministry of Health has initiated a project to upgrade the mortality informa-tion, reducing the proportion of ill-defined deaths.31 We
confirmed that the absolute number of deaths and mortal-ity rates from ill-defined causes of death (R00-R99) de-creased by 50% in Brazil and up to 70% in some macro-regions from 2000 to 2012 reflecting a higher quali-ty in mortaliquali-ty data reporting (Table 6).
since 2000.32 Therefore, it is difficult to estimate with
ac-curacy the percentage of liver deaths that occur as a result of viral hepatitis, non-alcoholic fatty liver disease or exces-sive alcohol consumption.
The major strength of this study was the estimation of the burden of cirrhosis mortality by analyzing individual data from a nationwide database (SIM) provided by the Brazilian Ministry of Health. SIM has registered causes of death based on DC classified by ICD codes since 1979 (ICD-9 from 1979 to 1995 and ICD-10 from 1996 to today). Since 1999, primary, secondary and contributing causes of death have been available on the database. Mortality data has been systematically updated by the Brazilian Unified Health System Information Technology Department. Death by cirrhosis was defined as the presence of the spe-cific ICD-10 in any field of the DC to avoid underestima-tion of mortality rates. In addiunderestima-tion, mortality rates were adjusted for age using the WHO World standard population that allows comparison of our data with different countries worldwide. This analysis of the Brazilian general popula-tion may contribute to a better understanding of the burden of liver diseases worldwide. In terms of territory and popu-lation, Brazil is the largest country in Latin America and the fifth largest country in the world. In addition, the descrip-tion of the burden of cirrhosis mortality in Brazil would emphasize the need of prioritization of the development of preventive health policies in chronic liver diseases.
CONCLUSION
Age-standardized cirrhosis mortality rates progressive-ly decreased from 2000 to 2012 in the Brazilian population. However, cirrhosis remains a major public health issue, responsible for more than 20,000 deaths in 2012. This study paves the way for further urgent research to identify major public health concerns permitting to prioritize health policies for the implementation of cost-effective prevention programs and novel treatments for the most frequent liver diseases in Latin American countries and especially in low-income Brazilian regions.
ABBREVIATIONS
• CI: confidence interval.
• DATASUS: Brazilian Unified Health System Infor-mation Technology Department.
• DC: death certificate. • EU: European Union.
• IBGE: Brazilian Institute of Geography and Statistics. • ICD: International Classification of Diseases.
• SIM: Sistema de Informação sobre Mortalidade - Na-tional Registry of Death database.
• WHO: World Health Organization.
CONTRIBUTORSHIP
• HP: study concept and design; analysis and interpreta-tion of data; statistical analysis; drafting and critical re-vision of the manuscript.
• AGP: acquisition of data; analysis and interpretation of data and critical revision of the manuscript.
• RDB, PML, JF and SWC: interpretation of data and critical revision of the manuscript.
• VGV and BG: study supervision, interpretation of data and critical revision of the manuscript.
COMPETING INTERESTS
The authors have no conflict of interest to disclose re-lated to this topic.
GRANTS/FINANCIAL SUPPORT
This work was supported by funding from:Conselho Nacional de Desenvolvimento Cientifico e Tecnologico (CNPq) / Bolsa Jovem Talento (BJT) - Programa Ciên-cias Sem Fronteiras under grant 301520/2014-3; from Fundação Carlos Chagas Filho de Amparo à Pesquisa do Estado do Rio de Janeiro (FAPERJ) and Fundação para Desenvolvimento Cientifico e Tecnologico em Saude (FioTec) under grant IPEC-010-PPE-13.
REFERENCES
1. Heffler S, Levit K, Smith S, Smith C, Cowan C, Lazenby H, Freeland M. Health spending growth up in 1999; faster growth expected in the future. Health Aff (Millwood) 2001; 20: 193-203.
2. Innes H, Goldberg D, Dillon J, Hutchinson SJ. Strategies for the treatment of Hepatitis C in an era of interferon-free ther-apies: what public health outcomes do we value most? Gut
2015; 64: 1800-9.
3. Vong S, Bell BP. Chronic liver disease mortality in the United States, 1990-1998. Hepatology 2004; 39: 476-83.
4. Asrani SK, Larson JJ, Yawn B, Therneau TM, Kim WR. Un-derestimation of liver-related mortality in the United States. Gastroenterology 2013; 145: 375-82.
5. Blachier M, Leleu H, Peck-Radosavljevic M, Valla DC, Roudot-Thoraval F. The burden of liver disease in Europe: a review of available epidemiological data. J Hepatol 2013; 58: 593-608. 6. Mendez-Sanchez N, Villa AR, Chavez-Tapia NC,
Ponciano-Rodriguez G, Almeda-Valdes P, Gonzalez D, Uribe M. Trends in liver disease prevalence in Mexico from 2005 to 2050 through mortality data. Ann Hepatol 2005; 4: 52-5.
7. Lozano R, Naghavi M, Foreman K, Lim S, Shibuya K, Aboy-ans V, Abraham J, et al. Global and regional mortality from 235 causes of death for 20 age groups in 1990 and 2010: a systematic analysis for the Global Burden of Disease Study 2010. Lancet 2012; 380: 2095-128.
8. Scaglione S, Kliethermes S, Cao G, Shoham D, Durazo R, Luke A, Volk ML. The Epidemiology of Cirrhosis in the United States: A Population-based Study. J Clin Gastroenterol
9. Brasil. Guideline for information of cause of death in the death certificate [Manual de instruções para o preenchimen-to da declaração de obipreenchimen-to]. [cited 25 March 2015; Available at: http://svs.aids.gov.br/download/manuais/ Manual_Instr_ Preench_DO_2011_jan.pdf] Brasilia: Brazilian Ministry of Health [Ministerio da Saude do Brasil]; Brazil; 2001.
10. Kulhanova I, Menvielle G, Bopp M, Borrell C, Deboosere P, Eikemo TA, Hoffmann R, et al. Socioeconomic differences in the use of ill-defined causes of death in 16 European coun-tries. BMC Public Health 2014; 14: 1295.
11. Lima EE, Queiroz BL. Evolution of the deaths registry system in Brazil: associations with changes in the mortality profile, under-registration of death counts, and ill-defined causes of death. Cad Saude Publica 2014; 30: 1721-30.
12. Smith P. Comparison between Registries: Age standardised rates. In: Cancer Incidence in Five Continents. Vol. V. Lyon, France: International Agency for Research on Cancer; 1987. 13. Breslow NE, Day NE. Rates and Rate Standardization. In: Statistical Methods in Cancer Research. Vol. II. Lyon, France: International Agency for Research on Cancer; 1987. 14. Ahmad OB, Boschi-Pinto C, Lopez AD, Murray CJ, Lozano R, Inoue M. Age-standardization of rates: a new WHO stand-ard. GPE Discussion Paper Series: N° 31: World Health Or-ganization, 2001. [cited 25 March 2015; Available from www.who.int/healthinfo/paper31.pdf].
15. WHO. WHO World Standard population (2000-2025) 2014 [cited 25 March 2015; Available from: http://seer.cancer.gov/ stdpopulations /world.who.html
16. Dalmau-Bueno A, Garcia-Altes A, Mari-Dell'olmo M, Perez K, Espelt A, Kunst AE, Borrell C. Trends in socioeconomic ine-qualities in cirrhosis mortality in an urban area of Southern Europe: a multilevel approach. J Epidemiol Community Health 2010; 64: 720-7.
17. Mokdad AA, Lopez AD, Shahraz S, Lozano R, Mokdad AH, Stanaway J, Murray CJ, et al. Liver cirrhosis mortality in 187 countries between 1980 and 2010: a systematic analysis.
BMC Med 2014; 12: 145.
18. Zatonski WA, Sulkowska U, Manczuk M, Rehm J, Boffetta P, Lowenfels AB, La Vecchia C. Liver cirrhosis mortality in Eu-rope, with special attention to Central and Eastern Europe.
Eur Addict Res 2010; 16: 193-201.
19. Marinho RT, Duarte H, Giria J, Nunes J, Ferreira A, Velosa J. The burden of alcoholism in fifteen years of cirrhosis hospi-tal admissions in Portugal. Liver Int 2015; 35: 746-55. 20. Mendez-Sanchez N, Garcia-Villegas E, Merino-Zeferino B,
Ochoa-Cruz S, Villa AR, Madrigal H, Kobashi-Margain RA, et al. Liver diseases in Mexico and their associated mortality trends from 2000 to 2007: A retrospective study of the na-tion and the federal states. Ann Hepatol 2010; 9: 428-38. 21. Nader LA, de Mattos AA, Bastos GA. Burden of liver
dis-ease in Brazil. Liver Int 2014; 34: 844-9.
22. Anderson P, Chisholm D, Fuhr DC. Effectiveness and cost-effectiveness of policies and programmes to reduce the harm caused by alcohol. Lancet 2009; 373: 2234-46. 23. Spearman CW, Sonderup MW. Health disparities in liver
dis-ease in Sub-Saharan Africa. Liver Int 2015; 35: 2063-71. 24. Chapmann & Hall. Medical Biostatistics, 3rd ed.
CRCBiosta-tistics Series; 2012.
25. Franca E, Campos D, Guimaraes MD, Souza MF. Use of ver-bal autopsy in a national health information system: Effects of the investigation of ill-defined causes of death on propor-tional mortality due to injury in small municipalities in Brazil.
Popul Health Metr 2011; 9: 39.
26. Marchand JL, Imbernon E, Goldberg M. [Causes of death in a cohort of EDF-GDF employees: comparison between occu-pational medicine and official statistics data]. Rev Epidemiol Sante Publique 2003; 51: 469-80.
27. de Lima EE, Queiroz BL. Evolution of the deaths registry sys-tem in Brazil: associations with changes in the mortality pro-file, under-registration of death counts, and ill-defined causes of death. Cad Saude Publica 2014; 30: 1721-30. 28. França E, de Abreu DX, Rao C, Lopez AD. Evaluation of
cause-of-death statistics for Brazil, 2002-2004. Int J Epide-miol 2008; 37: 891-901.
29. França E, da Cunha CC, Vasconcelos AM, Escalante JJ, de Abreu DX, de Lima RB, de Morais Neto OL. Investigation of ill-defined causes of death: assessment of a program's per-formance in a state from the Northeastern region of Brazil.
Rev Bras Epidemiol 2014; 17: 119-34.
30. França E, Teixeira R, Ishitani L, Duncan BB, Cortez-Esca-lante JJ, Morais Neto OL, Szwarcwald CL. Ill-defined caus-es of death in Brazil: a redistribution method based on the investigation of such causes. Rev Saude Publica 2014; 48: 671-81.
31. Brasil. Guideline for investigation of ill-defined causes of death [Manual para investigação do obito com causa mal definida]. [cited 25 March 2015; Available at: http://svs. a i d s . g o v . b r / d o w n l o a d / m a n u a i s / m a n u a l _ o b i t o _ m a l _ definida.pdf] Brasilia (DF): Brazilian Ministry of Health [Min-istério da Saude do Brasil]; Brazil; 2009.
32. Sheron N. Alcohol and liver disease in Europe - Simple measures have the potential to prevent tens of thousands of premature deaths. J Hepatol 2016; 64: 957-67.
Correspondence and reprint request:
Hugo Perazzo, M.D., Ph.D.
![Table 3. Age-standardized cirrhosis mortality rate [95% confidence interval] according to macro-regions in Brazil from 2000 to 2012.](https://thumb-us.123doks.com/thumbv2/123dok_es/6440730.213871/4.918.89.838.648.1075/standardized-cirrhosis-mortality-confidence-interval-according-regions-brazil.webp)