Otras secciones de este sitio:
☞ ☞ ☞ ☞
☞ Índice de este número ☞
☞ ☞ ☞
☞ Más revistas ☞
☞ ☞ ☞
☞ Búsqueda
Others sections in this web site:
☞ ☞ ☞ ☞
☞ Contents of this number ☞
☞ ☞ ☞
☞ More journals ☞
☞ ☞ ☞ ☞ Search Artículo:
Non-invasive quantitation of cardiac hemodynamics with Echocardiography and Doppler ultrasound
Derechos reservados, Copyright © 2004 Instituto Nacional de Cardiología Ignacio Chávez
Archivos de Cardiología de México
Suplemento
Supplement 2
Abril-Junio
April-June 2 0 0 4
Volumen
Volume 7 4
edigraphic.com
* Heart Centre. University Medical Centre Radboud Nijmegen.
Address for correspondence: Heart Centre, University Medical Centre Radboud Nijmegen, Geert Grooteplein 8, 6500 HB Nijmegen. The Netherlands. Tel: ++31-24-3614533, Fax: ++31-24-3540537. E-mail: g.pop@cardio.umcn.nl
Introduction
ntil recently hemodynamic assessment of the heart could be obtained only by the invasive approach of catheterization. In the last years echocardiography and especial-ly Doppler flow anaespecial-lysis have demonstrated, that this non-invasive method gives almost similar results and sometimes even better.1,2 Echocardi-ography has the advantages that it can be per-formed at the bedside, it is a rapid and very safe method and it is relatively inexpensive. Further-more, it has offered the opportunity to re-evalu-ate the hemodynamic alterations of the heart as frequent as necessary, which can be used for op-timizing medical treatment and establishing the right moment for surgical repair, if necessary.
II M-Mode and 2D evaluation of cardiac hemodynamics (without Doppler)
The evaluation of cardiac hemodynamics by M-Mode and 2D echocardiography without Dop-pler often gives only indirect evidence of abnor-malities. However, the obtained data are espe-cially helpful to determine the duration of an existing defect by showing the presence and in-tensity of organ damage in the heart (the degree of hypertrophy and/or dilatation). It also often helps to elucidate the etiology of an hemody-namic alteration (presence of wall movement abnormalities, vegetations, myxoma, etc ). In
Table I a summary is made of the several M-Mode
and 2D findings and the corresponding hemo-dynamic alterations.
Non-invasive quantitation of cardiac hemodynamics with
Echocardiography and Doppler ultrasound
Gheorghe AM Pop,* Maureen van de Vlugt,* Aline Huizenga*
Summary
Until recently hemodynamic assessment of the heart had to be done invasively by catheteriza-tion. Nowadays echocardiography with Doppler has demonstrated to give similar results by a non-invasive approach. The methods to deter-mine several hemodynamic parameters by echocardiography without Doppler are dis-cussed (dimensions of the cavities, left ventricu-lar mass, ejection fraction) as well as with use of Doppler (cardiac output, quantification of valve regurgitation and stenosis, pressure gradients, valve area and intracardiac pressure). Basic for-mulas such as the continuity and simplified Ber-nouilli equations are discussed.
Resumen
VALORACIÓNDELAHEMODINÁMICACARDÍACACON MÉTODOSNOINVASIVOS: ECOCARDIOGRAFÍAY
ULTRASONIDO DOPPLER
Hasta hace poco, la valoración hemodinámica del corazón empleaba al cateterismo (técnica invasi-va) como herramienta. Actualmente, la ecocardio-grafía con Doppler ha mostrado resultados simi-lares. En este trabajo, se discuten los métodos ecocardiográficos sin Doppler para evaluar va-rios parámetros hemodinámicos (dimensiones de las cavidades, masa del ventrículo izquierdo, frac-ción de eyecfrac-ción), así como con el uso de Do-ppler (gasto cardíaco, cuantificación de regurgita-ción y estenosis valvulares, gradientes de pre-sión, área valvular y presión intracardíaca). Adi-cionalmente, se discuten las ecuaciones de con-tinuidad y la de Bernoulli simplificada.
Non-invasive quantitation of cardiac hemodynamics with echocardiography and Doppler ultrasound S231
MG Vol. 74, Supl. 2, 60 Aniversario/Abril-Junio 2004:S230-S233
edigraphic.com
Left ventricular ejection fraction (LVEF)Several large clinical trials in heart failure pa-tients have shown the strong predictive power of the LVEF to predict major cardiovascular events. Therefore, determination of LVEF has become the most utilized tool in both research and clinical practice to express left ventricular (LV) contractile performance. LVEF by contrast ventriculography and radionuclide ventriculog-raphy are considered as ‘gold standards’. How-ever, the resolution of 2-D transthoracic echocar-diography (especially when ‘harmonics’ and/or contrast agents are added) has improved in re-cent years and several studies have demonstrat-ed an excellent correlation with the ‘gold stand-ard’.3 The American Society of Echocardiogra-phy recommends to determine LVEF by com-puting systolic and diastolic volumes from bi-plane planimetry of paired orthogonal long axis apical views.4 The most recommended algorithm for use in clinical practice is Simpson’s rule, also known as the ‘disc summation method’. Anoth-er established method to evaluate ventricular systolic function is the wall motion scoring (WMI).5 WMI is a mean score of wall motion derived from values of regional wall motion as-signed in a segmental LV model. Preferentially, 16 segments are used and scored in all standard 2-D views. A linear relationship appears to exist between WMI and LVEF; hence, a regression equation may be used to convert WMI to LVEF.
III Estimation of Stroke Volume and Cardiac Output
The flow through a certain cross-sectional area (CSA) can be calculated by the formula: Flow rate = CSA x Flow velocity
The cardiac flow is pulsatile during a cardiac cycle and a sum must be made of all velocities within one cycle; this sum is called time veloci-ty integral (TVI).6 By tracing the Doppler veloc-ity signal TVI can be determined and normally this calculation is done automatically by the newest Echo/Doppler units. Subsequently, stroke volume (SV) is calculated by multiplying TVI by CSA.
SV= CSA x TVI
The CSA for calculation of SV is determined at the LVOT just beneath the aortic cusps in the parasternal long axis view. It is considered to be circular, so it can be determined by measurement of the orifice diameter (D):
CSA = (D/2)2 x π = D2 x 0.785 or SV = D2 x 0.785 x TVI
Cardiac output is calculated by multiplying SV with the heart frequency.
IV Quantitation of heart valve defects
A Valve regurgitation volume Two methods exist to estimate the regurgitant volume by Echo/Doppler: the volumetric method and the proximal isovelocity surface area (PISA) meth-od. In the volumetric method6 the regurgitant volume is the difference between the total for-ward stroke (= Qtotal) and the systemic stroke volume (= Qs), hence regurgitant volume = Q
to-tal - Qs. For example calculation of a mitral in-sufficiency needs determination of Qtotal through the CSA at the mitral orifice and de-termination of the Qs through the CSA at the LVOT. On the other hand, for calculation of an aortic insufficiency the mitral inflow (= Qs) must be subtracted from the total flow (Qtotal) at the LVOT level.
Table I. Summary of several M-mode and 2-D echo findings and their corresponding hemodynamic
alterations.
M-Mode and 2 D findings Hemodynamic alterations
Left ventricular hypertrophy Long-lasting hypertension or AS Diminished fractional shortening Decreased contraction force Fluttering of mitral valve Aortic regurgitation
Systolic anterior motion of mitral valve Dynamic obstruction of LVOT Midsystolic pulmonary valve closure Dynamic obstruction of LVOT
Dilated RV + D-shaped LV Pulmonary hypertension
Dilated IVC with lack of inspiratory collapse Increased RV systolic pressure Persistent bowing of atrial septum to RA or LA Increased LA or RA pressure Diastolic RA and RV wall inversion or collapse Cardiac tamponade
Abnormal ventricular septal motion Constrictive pericarditis
Abnormal TAPSE RV dysfunction
edigraphic.com
:rop odarobale FDP
VC ed AS, cidemihparG
arap
acidémoiB arutaretiL :cihpargi-deM sustraídode-m.e.d.i.g.r.a.p.h.i.c
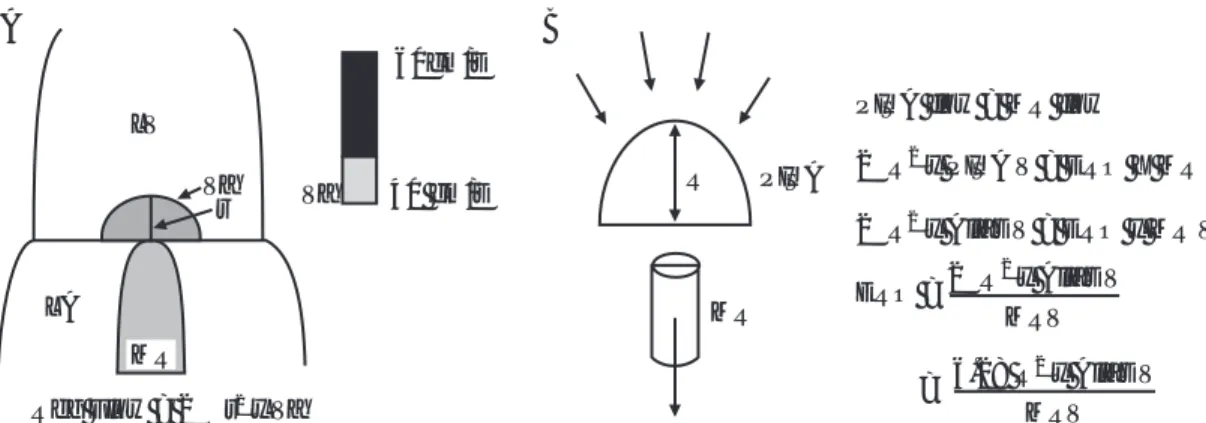
Fig. 1. From the velocity at which aliasing occurs (Va) and the radius of the isovelocity hemisphere (A) the
regurgitant volume can be calculated using the formulas depicted in B.
LV
60cm/s
Va r
LA
Reg Flow = 2πr x Va2
Va 40 cm/s
MR
R
MR PISA
PISA flow = MR flow
2 R x PISA V = ERO X MR V
2 R x Alias V = ERO x MR V
ERO =
π
π
2
2
2 R x Alias Vπ 2 MRV
6.28 R x Alias V2
MRV =
A B
The PISA method is based on the continuity equation and the concept of conservation of flow.7 The regurgitant jet is calculated by deter-mining the effective regurgitant orifice area (ERO), because the regurgitant volume = ERO x regurgitant TVI. Using the Nyquist limit of the color-coded Doppler signal, the flow velocity proximal to the regurgitant orifice (Alias V) can be determined (Fig. 1). The area of the isoveloc-ity hemisphere is calculated as 2π x r2; subse-quently flow rate = 2π x r2 x Alias V = ERO x regurgitant velocity. Finally, the regurgitant vol-ume can be determined, because this is equal to the regurgitant orifice area (ERO) multiplied by the mitral regurgitation TVI.
B Valve pressure gradient The blood velocities can be converted to pressure gradients using the simplified Bernoulli equation. The complete Bernoulli equation has 3 components (convec-tive acceleration, flow acceleration and the vis-cous friction), but for the measurement of the
flow gradient across a narrowed orifice in the clinical setting only the factor of convective ac-celeration is important. Hence,
Pressure gradient (∆∆∆∆∆P) = 4 x (Peak flow velocity)2
The measured peak flow velocity is an instanta-neous event, so the converted pressure gradients will also be instantaneous and represent maxi-mal values. The peak-to-peak gradient as meas-ured in aortic stenosis during catheterization is not instantaneous and is obtained from the dif-ference between maximal pressure in the left ventricle versus maximal pressure in the aorta, both of which do not occur at the same moment. Hence, the maximal calculated pressure gradi-ent by Doppler technique will always be higher than the peak-to-peak gradient during catheter-ization. Several studies have demonstrated an excellent correlation between the pressure data calculated by Doppler and the intracavitary pres-sure meapres-surements by cardiac catheterization.8,9 C Valve area calculation For calculation of the valve area the continuity equation can be used
(Fig. 2). As one of the areas (A1) can be
meas-ured, and the 2 velocities before and after the stenotic or regurgitant area can be determined, the area of interest (A2) can be calculated. For example in aortic stenosis the A1 will be the diameter of the left ventricle outflow tract, the V1 is the flow velocity in the LVOT and the V2 is the flow velocity after the aortic valve area. Another method to estimate the severity of the valve area is determination of the pressure half time (PHT)(10). The PHT is the time interval for the peak pressure gradient to reach its half level. As the pressure gradient is calculated by the
Flow (Q) = CSA x Velocity
A1
V1
V1
A2
V2
Continuity Equation
A2 = Q1 / V2 Q1 - Q2
Q1 = A1 x V1 = A2 x V2
Non-invasive quantitation of cardiac hemodynamics with echocardiography and Doppler ultrasound S233
MG Vol. 74, Supl. 2, 60 Aniversario/Abril-Junio 2004:S230-S233
edigraphic.com
sustraídode-m.e.d.i.g.r.a.p.h.i.c cihpargidemedodabor
square root of the flow velocity, this PHT is the same as the time interval of the peak velocity to reach v2 x the level of the peak velocity. The deceleration time (DT) is the time interval from the peak velocity to when it reaches zero baseline and the DT is always proportionally related to the PHT, according to PHT= 0.29 x DT.
V Intracardiac pressures The velocity of a regur-gitant jet is related to the pressure drop across a
valve, which finding can be used to calculate the pressure in the different cardiac cavities. For exam-ple: from the tricuspid regurgitant jet velocity the RV pressure can be estimated (according to the simplified Bernoulli equation) by adding (TR ve-locity)2 x 4 to the RA pressure, which usually is 10 mm Hg. In a similar way the end diastolic LV pres-sure (LVEDP) can be calculated, if an aortic regur-gitation (AR) can be detected:8 LVEDP = DBP – (AR EDV)2 x 4 in which DBP is systemic diastolic blood pressure. Another way to estimate LVEDP is to consider the pattern of the pulmonary venous flow and the mitral inflow.11 Finally, even the typ-ical contractility parameter of dp/dt, which is nor-mally derived from invasive measurements, can be estimated by Doppler flow analysis.12
VI Conclusion
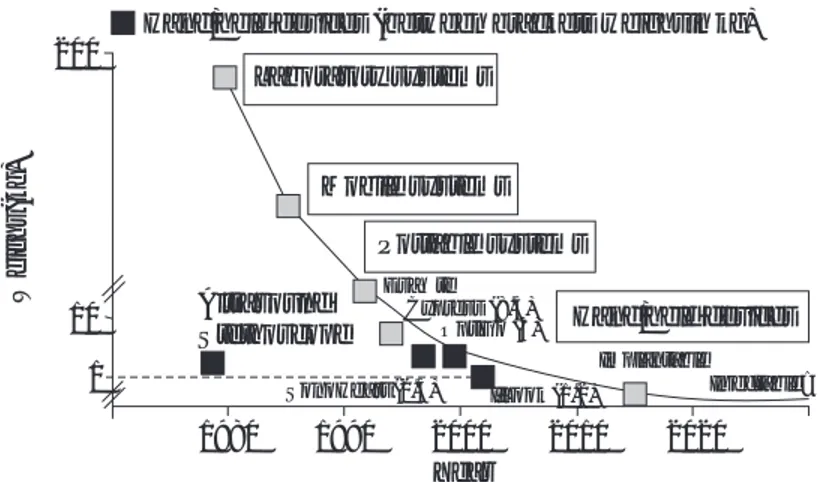
Non-invasive quantitation of hemodynamic pa-rameters by echocardiography with Doppler has become a reliable tool in clinical research and for clinical decision making in daily practice. As echo/Doppler equipment is becoming small-er and more portable, in time the echocardio-graph may become a modern replacement for our present stethoscope (Fig. 3).13
References
1. FEIGENBAUM H: Evolution of echocardiography. Circulation 1996; 93: 1321-1327.
2. TEIRSTEIN PS, YOCK PG, POPP RL: The accuracy of Doppler ultrasound measurement of pressure gra-dients across irregular, dual, and tunnel-like obstruc-tions to blood flow. Circulation 1985; 72: 577-584.
3. MCGOWAN JH, CLELAND GF: Reliability of
report-ing left ventricular systolic function by echocar-diography: a systematic review of 3 methods. Am
Heart J 2003; 146: 388-397.
4. SCHILLER NB, SHAH PM, CRAWFORD M:
Recommenda-tions for quantitation of the left ventricle by two-dimen-sional echocardiography: American Society of Echocardiography Committee on Standards, Subcom-mittee on Quantitation of Two-Dimensional Echocar-diograms. J Am Soc Echocardiogr 1989; 2: 358-367.
5. EDWARDS WD, TAJIK A, SEWARD JB: Standardized
nomenclature and anatomical basis for regional tomographic analysis of the heart. Mayo Clin Proc
1981; 56: 479-497.
6. OH JK, SEWARD JB, TAJIK AJ: The Echo Manual.
Second Edition 1999; Chapter 6: 59-71.
7. MESSIKA-ZEITOUN D, FUNG YIU S, CORMIER B, IUNG
B, SCOTT C, VAHANIAN A, TAJIK AJ, ENRIQUEZ-SA -RANO M: Sequential assessment of mitral valve area during diastole using colour M-mode flow
con-vergence analysis: new insights into mitral steno-sis. Eur Heart J 2003; 24: 1244-1253.
8. NEUMANN A, SOBLES JS, ANAGNOS PC, KAGZI M, PARRILLO JE: Accurate noninvasive estimation of left ventricular end-diastolic pressure: compari-son with catheterization. J Am Soc Echocardiogr
1998;11(2): 126-131.
9. DABAGHI SF, ROKEY R, RIVERA JM, SALIBA WI, MAJID PA: Comparison of echocardiographic as-sessment of cardiac hemodynamics in the inten-sive care unit with right-sided cardiac catheter-ization. Am J Cardiol 1995; 76(5): 392-395.
10. THOMAS JD, WEYMAN AE: Doppler mitral pressure
half-time: a clinical tool in search of theoretical justification. J Am Coll Cardiol 1987; 10: 923-929.
11. SOHN DW, CHOI YJ, OH BH, LEE MM, LEE YW: Esti-mation of left ventricular end-diastolic pressure with the difference in pulmonary venous and mitral A durations is limited when mitral E and A waves are overlapped. J
Am Soc Echocardiogr 1999; 12(2): 106-12.
12. CHUNG NS, NISHIMURA RA, HOLMES DR JR, TAJIK AJ: Measurement of left ventricular dp/dt by simultaneous Doppler echocardiography and cardiac catheteriza-tion. J Am Soc Echocardiogr 1992; 5: 147-152.
13. ROELANDT JRTC: Farewell Lecture. Beyond the invis-ible. The Thoraxcentre Journal 2003; 15; 3: 54-63.
Hand/held devices (between brackets weight in kg) 200
Weight
(kg)
10
1
Laboratory systems
Mobile systems
Portable systems
Hand/held devices Altrasound
Stethoscope
EsaOte Cypress (8.5)
OptiGo (3)
Implantable
Injectable? SonoHeart (2.5) I’Look (1.2)
1980 1990 2000 2010 2020 Year