Research Article
MEG Analysis of Neural Interactions in
Attention-Deficit/Hyperactivity Disorder
Amine Khadmaoui,
1Carlos Gómez,
1Jesús Poza,
1,2Alejandro Bachiller,
1Alberto Fernández,
3,4Javier Quintero,
3,5and Roberto Hornero
1,21Biomedical Engineering Group, E.T.S. Ingenieros de Telecomunicaci´on, Universidad de Valladolid, Campus Miguel Delibes, Paseo Bel´en 15, 47011 Valladolid, Spain
2IMUVA, Instituto de Investigaci´on en Matem´aticas, Universidad de Valladolid, Campus Miguel Delibes, Paseo Bel´en 7, 47011 Valladolid, Spain
3Department of Psychiatry, Facultad de Medicina, Universidad Complutense de Madrid, Ciudad Universitaria, 28040 Madrid, Spain 4Laboratory of Cognitive and Computational Neuroscience, Centro de Tecnolog´ıa Biom´edica, Campus Montegancedo,
Pozuelo de Alarc´on, 28223 Madrid, Spain
5Psychiatry Service, Hospital Infanta Leonor, Avenida Gran V´ıa del Este 80, 28031 Madrid, Spain Correspondence should be addressed to Carlos G´omez; [email protected]
Received 24 December 2015; Accepted 7 March 2016
Academic Editor: Leonardo Franco
Copyright © 2016 Amine Khadmaoui et al. This is an open access article distributed under the Creative Commons Attribution License, which permits unrestricted use, distribution, and reproduction in any medium, provided the original work is properly cited.
The aim of the present study was to explore the interchannel relationships of resting-state brain activity in patients with attention-deficit/hyperactivity disorder (ADHD), one of the most common mental disorders that develop in children. Magnetoencephalo-graphic (MEG) signals were recorded using a 148-channel whole-head magnetometer in 13 patients with ADHD (range: 8–12 years) and 14 control subjects (range: 8–13 years). Three complementary measures (coherence, phase-locking value, and Euclidean distance) were calculated in the conventional MEG frequency bands: delta, theta, alpha, beta, and gamma. Our results showed that the interactions among MEG channels are higher for ADHD patients than for control subjects in all frequency bands. Statistically significant differences were observed for short-distance values within right-anterior and central regions, especially at delta, beta, and gamma-frequency bands (𝑝 < 0.05; Mann-Whitney𝑈test with false discovery rate correction). These frequency bands also showed statistically significant differences in long-distance interactions, mainly among anterior and central regions, as well as among anterior, central, and other areas. These differences might reflect alterations during brain development in children with ADHD. Our results support the role of frontal abnormalities in ADHD pathophysiology, which may reflect a delay in cortical maturation in the frontal cortex.
1. Introduction
Attention-deficit/hyperactivity disorder (ADHD) is a persis-tent neuropsychiatric disorder, which changes with develop-ment from childhood through adulthood [1]. It is charac-terized by excessive impulsivity and hyperactivity and/or by difficulty in maintaining attention. These features predispose the children to psychiatric and social pathology, in addition to academic dysfunctions or chaotic interpersonal relationships in later life [1]. Prevalence rates of ADHD depend on distinct
factors, such as the diagnostic criteria and the sampled population. However, the prevalence rate was placed by several studies to be about 4–6% [2, 3], making this disorder commonly diagnosed in childhood. Despite its clear medical, social, and familial relevance, the nature of this dysfunction is not entirely understood and there is no neurobiological marker defined for it. Therefore, diagnosis relies exclusively on clinical criteria, such as Diagnostic and Statistical Manual of Mental Disorders (DSM) and International Statistical Classification of Diseases (ICD). Nevertheless, clinicians still
need to collect data from informants (parents and teachers) and follow developmental variations in symptom expression [4].
In the recent years, neuroimaging research has evolved rapidly, providing several ways to examine the pathophysi-ology of ADHD and the biological effects of medical treat-ments. The earliest neuroimaging studies used single-photon emission computed tomography (SPECT) and positron-emission tomography (PET), showing frontostriatal abnor-malities in ADHD [5, 6]. Later, these techniques have been replaced by functional magnetic resonance imaging (fMRI), which offers better spatial and temporal resolution for functional researches [7]. Most fMRI studies revealed that ADHD might be related to dorsal anterior cingulate cortex dysfunction, which has been shown to be essential in cognition, attention, and decision making [8, 9]. In another study, ADHD was defined as a disorder characterized by a delay of cortical maturation, which was most prominent in prefrontal regions [10]. Additionally, Bush et al. [7] reviewed several functional neuroimaging studies in ADHD and con-cluded that patients showed a consistent pattern of frontal dysfunction in the brain. In sum, neuroimaging techniques provide extensive evidence for brain dysfunction in ADHD.
To understand dynamic cognitive processes, neurophys-iological techniques, such as electroencephalography (EEG) and magnetoencephalography (MEG), are required. Both allow acquiring neural activity with higher temporal res-olution than SPECT, PET, and fMRI [11]. EEG and MEG are completely noninvasive and record the electromagnetic oscillations produced by cerebral activity directly, without the need to interpret it in terms of proxy measure [11, 12]. Never-theless, there are some differences between these techniques. While electric fields are strongly influenced by several factors, such as distance between sensors or electrode location, mag-netic fields are reference-free and less affected by distortions produced by the resistive properties of the skull and the scalp [11]. However, MEG equipment is characterized by limited availability and high costs, in comparison to EEG devices [13]. Several studies evidenced the utility of EEG/MEG analysis to evaluate the brain activity in ADHD. Spectral analysis revealed that ADHD patients showed significantly higher theta relative power and lower beta relative power, along with higher theta/alpha and theta/beta ratios [14]. Likewise, recent studies suggested that nonlinear measures can complement spectral analysis in order to understand brain dynamics in ADHD [15]. For instance, MEG data were analyzed by using Lempel-Ziv complexity [16] and fuzzy entropy [15]. They revealed that brain activity is less complex and more regular in ADHD patients compared to controls. In sum, accumulating evidence suggests that EEG and MEG are useful to explore the neurophysiological substrate of neural dysfunction in ADHD. However, further research is necessary to characterize the neural dynamics associated with this disorder.
All the aforementioned research works analyzed EEG/ MEG activity by studying local activation patterns (i.e., neural activity recorded from each channel is evaluated independently). However, several authors considered that higher brain functions depend on a balance between local
specialization and global integration of brain processes [17]. Therefore, a better comprehension of the brain as a complex structural and functional network is needed [18]. To achieve this, it is important to study how neural couplings are carried out (for a review about brain connectivity, see Friston [19] and/or Sakkalis [20]). Although connectivity patterns have been widely investigated in other brain disorders, only a few studies have focused on ADHD [21–24]. For instance, Clarke et al. [21] showed that ADHD children have an underlying brain dysfunction in the frontal lobes, by means of mean square EEG coherence. Other authors computed MEG phase coherence during an auditory attention task, revealing hyperconnectivity in the high frequency range in adults with ADHD compared to controls [22].
Most of the previous coupling studies used a single measure, mainly coherence, to analyze brain dynamics in ADHD. In this study, three complementary measures have been applied in order to get a comprehensive characterization of the interchannel relationships in ADHD. To begin with, coherence (COH) is a normalized linear measure widely used to explore connectivity at a particular frequency. In essence, it quantifies linear correlations in the frequency domain [25]. Secondly, phase-locking value (PLV) is a synchronization measure that identifies whether frequency specific transient phase locking exists [26]. Finally, Euclidean distance (ED) is a similarity measure, which has been proposed to assess the statistical distance between probability distributions [27, 28]. The aim of our study is to provide further insights into the underlying brain dynamics associated with ADHD. For this purpose, COH, PLV, and ED were calculated in the
conven-tional MEG frequency bands (𝛿,𝜃,𝛼,𝛽, and𝛾). We attempt
to address the following research questions: (i) How does ADHD affect the neural interaction patterns? (ii) Can our methodology reflect the regional abnormalities of ADHD? (iii) Can the proposed measures provide complementary information about neural dynamics?
2. Materials and Methods
2.1. MEG Recording. Brain magnetic fields were acquired from each participant with a 148-channel whole-head magne-tometer (MAGNES 2500 WH, 4D Neuroimaging) located in a magnetically shielded room at the MEG Center Dr. P´erez-Modrego (Spain). During MEG recording, subjects were lying comfortably on a patient bed, in a relaxed state, and with their eyes closed. They were instructed to stay awake and to avoid eye and head movements in order to reduce the pres-ence of artifacts in the recordings. Their behavior was con-trolled during the recording procedure by means of a video-camera. Additionally, technicians may communicate with chil-dren during MEG acquisition using a loud-speaking inter-com. Participants included in the final sample did not exhibit significant difficulties in maintaining their immobility.
myographic artifacts, both visual inspection and independent component analysis (ICA) were performed [15]. Finally, artifact-free epochs of 848 samples (5 s) were selected for further analyses.
2.2. Subjects. In this study, MEG data were acquired from 27 subjects. The clinical group comprised 13 children with
ADHD (age =9.5±1.3years, mean±standard deviation, SD;
range 8–12 years). Inclusion criteria included a full DSM-IV (DSM, Fourth Edition) diagnosis of ADHD combined type with associated impairment in at least two settings and Con-ners’ Parent Rating Scale (CPRS) hyperactivity rating greater than two SD above age- and sex-specific means [29]. The DSM-IV diagnosis of ADHD was based on the parent version of the Diagnostic Interview for Children and Adolescents [30]. ADHD patients had never used any psychoactive drug or received any psychoactive therapy.
The control group was formed by 14 healthy children (10.4 ± 1.5years, mean±SD; range 8–13 years) without past or present neurological disorders. There were not significant
differences (𝑝values>0.05, Mann-Whitney𝑈test) between
ADHD patients and control subjects in terms of age and years
of education (6.8 ± 1.2years in ADHD patients and7.3 ± 1.4
years in controls; mean±SD) and they all were strictly
right-handed. Written informed consent and assent to participate in the study were obtained from parents and children, respectively. The Institutional Review Board approved the research protocol.
2.3. Neural Interaction Measures. The study of neural interac-tions seeks to understand how different regions of the brain cortex communicate with each other. In this research, we focused on three complementary points of view, which have been developed to analyze these neural connections: COH, PLV, and ED.
2.3.1. Coherence (COH). COH is a normalized linear measure that provides information about the degree of coupling between two signals within a given frequency band [25, 31]. It has been commonly used in neuroscience to evaluate the cor-relation among the neurophysiological signals measured at different sensors [32]. This measure has been previously used to analyze the brain background activity in ADHD [21, 23, 24].
In particular, mean square coherence has been calculated. It is a real-valued function defined as the square cross-spec-trum normalized by the product of the two power spectra.
Having two MEG channels, 𝑥(𝑡) and 𝑦(𝑡), COH can be
calculated as follows [25]:
COHband𝑥𝑦 = ∑
𝑓∈band
𝑆𝑥𝑦(𝑓)2
𝑆𝑥𝑥(𝑓) ⋅ 𝑆𝑦𝑦(𝑓),
band= {𝛿, 𝜃, 𝛼, 𝛽, 𝛾} , (1)
where𝑆𝑥𝑦(𝑓)is the cross-power spectral density and𝑆𝑥𝑥(𝑓)
and 𝑆𝑦𝑦(𝑓) are the respective autopower spectral densities
[25]. COH values range from 0 to 1. A value of 0 indicates no linear dependence between signals, whereas a value of 1 is obtained when they are perfectly coupled.
2.3.2. Phase-Locking Value (PLV). PLV is a highly sensitive measure of neural synchronization that specifically identifies whether frequency transient phase locking exists. It quantifies
the relationship between the phases of𝑥(𝑡)and𝑦(𝑡), while
their amplitudes could be uncorrelated [33].
To calculate PLV, firstly it is necessary to constrain the spectrum by filtering on the frequency band of interest. Then, Hilbert transform was used to extract the instantaneous
phase,𝜑band𝑥 (𝑡)and𝜑band𝑦 (𝑡), from the two signals,𝑥(𝑡)and
𝑦(𝑡), respectively. Thus, the instantaneous phase difference
for epoch𝑛was obtained as follows [26]:
Δ𝜑band
𝑥𝑦 (𝑡, 𝑛) = 𝜑𝑥band(𝑡, 𝑛) − 𝜑band𝑦 (𝑡, 𝑛) . (2) Finally, PLV was calculated as the variability of the instantaneous phase difference:
PLVband𝑥𝑦 = 1
𝑁
𝑁
∑
𝑛=1𝑒
𝑖Δ𝜑band
𝑥𝑦 (𝑡,𝑛)
, band= {𝛿, 𝜃, 𝛼, 𝛽, 𝛾} , (3)
where𝑁is the number of samples per epoch and|⋅|indicates
the modulus of the complex value. The range of PLV values varies between 0 (nonphase locked, random activity) and 1 (perfect phase synchrony).
2.3.3. Euclidean Distance. The concept of distance between two probability distributions was initially developed by Mahalanobis in 1936 [34]. It is widely used between statistical models in signal processing applications, such as detection, classification, pattern recognition, or coding [35]. This mea-sure has been successfully applied to differentiate electromag-netic brain signals in different disorders, such as schizophre-nia and Alzheimer’s disease [28, 36].
In this study, ED was used to evaluate the differences between the spectral contents in the normalized power spec-tra of two MEG sensors. ED is defined as follows [27]:
EDband𝑥𝑦 = ∑
𝑓∈band
[𝑃𝑥(𝑓) − 𝑃2 𝑦(𝑓)]
1/2
,
band= {𝛿, 𝜃, 𝛼, 𝛽, 𝛾} , (4)
where𝑃𝑥(𝑓) = (1/𝑁)𝑆𝑥𝑥(𝑓)and𝑃𝑦(𝑓) = (1/𝑁)𝑆𝑦𝑦(𝑓)are
the normalized power spectra for a given frequency band
from the signals𝑥(𝑡)and𝑦(𝑡), respectively. ED ranges from
0 to 1, corresponding to the highest and lowest similarity, respectively. Therefore, to have a direct relation with COH
and PLV, ED= 1 −ED was considered.
3. Results
In this study, the three methods (COH, PLV, and ED) were
computed for the following frequency bands: 𝛿 (1–4 Hz),
𝜃 (4–8 Hz), 𝛼 (8–13 Hz), 𝛽 (13–30 Hz), and 𝛾 (30–65 Hz).
Results for the artifact-free epochs were averaged. The result of computing the three measures (COH, PLV, and ED) for
all pairwise combinations of channels was an𝑀 × 𝑀matrix
(𝑀 = 148) for each method, where each entry 𝑀𝑖𝑗
(a) (c)
(b)
Left-anterior
Left-posterior Left-lateral Left-central
Right-anterior
Right-posterior Right-lateral Right-central
Figure 1: Distribution of MEG regions and illustration of (a) short-distance, (b) interhemispheric long-short-distance, and (c) intrahemi-spheric long-distance connections.
To facilitate the interpretation of the results, these values were grouped into (left and right) anterior, central, lateral, and posterior regions to obtain long-distance intra- and interhemispheric (within one hemisphere and homologue regions of two hemispheres) and short-distance local mea-sures [37]. Short-distance meamea-sures involved interactions within one region and were calculated by averaging the coupling values between all pairs of sensors within one brain area. On the other hand, long-distance measures (12 intrahemispheric measures: central, anterior-lateral, anterior-posterior, central-anterior-lateral, central-posterior, and lateral-posterior, both in the left and right hemispheres; 4 interhemispheric measures: anterior, central, lateral, and pos-terior) involved interactions between two different regions. Long-distance values were calculated averaging coupling val-ues for pairs of sensors, where each sensor was in a different brain region. The distribution of MEG channels is displayed in Figure 1.
Statistical analyses were performed to study the differ-ences in the interchannel relationships between ADHD and
control groups using Mann-Whitney𝑈test. In order to deal
with multiple comparison problem,𝑝values were corrected
with false discovery rate (FDR) method. Statistically
sig-nificant results have been considered when 𝑝 values were
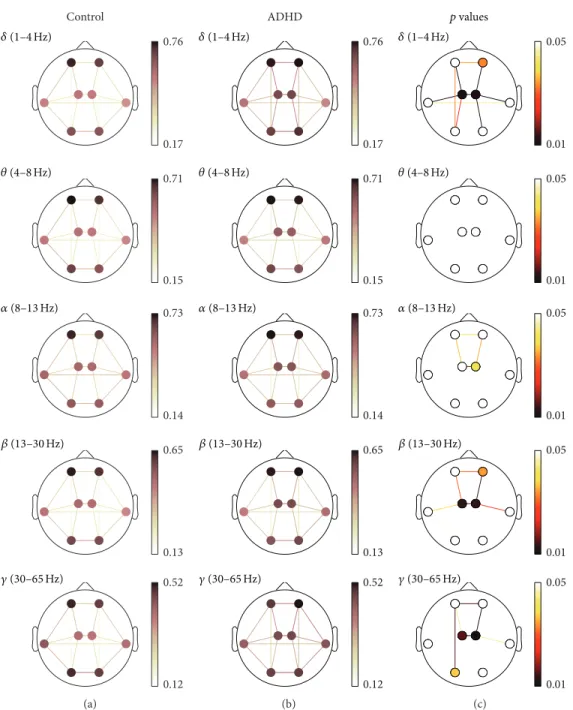
lower than 0.05. Detailed results for each measure are shown in Figure 2 (COH), Figure 3 (PLV), and Figure 4 (ED). In these figures, (a) and (b) illustrate the averaged values
for each group, while the corresponding FDR-corrected 𝑝
values (Mann-Whitney𝑈test) at each frequency band are
displayed in (c). It is important to note that connections across regions in (c) were only displayed when statistically significant differences between groups were obtained.
To begin with, short-distance COH values showed sta-tistically significant increases in ADHD patients compared
to controls in the right-anterior (𝛿and𝛽), left-central (𝛿,𝛽,
and𝛾), right-central (𝛿, 𝛼,𝛽, and𝛾), and left-posterior (𝛾)
areas. This effect was more pronounced in central region (𝛿,
𝛽, and𝛾). Moreover, interhemispheric long-distance values
revealed a significant interaction increase between anterior
(𝛿,𝛼,𝛽, and𝛾), central (𝛿,𝛼,𝛽, and𝛾), and lateral areas (𝛿).
Finally, intrahemispheric long-distance values also showed a
significant increase between anterior and central regions (𝛿,
𝛼, 𝛽, and𝛾) and between central and lateral areas (𝛿 and
𝛽in both hemispheres, as well as𝛾only in the right one).
Additionally, significant differences were also found between
central and posterior regions (𝛿) and between left-anterior
and left-posterior areas (𝛿and𝛾).
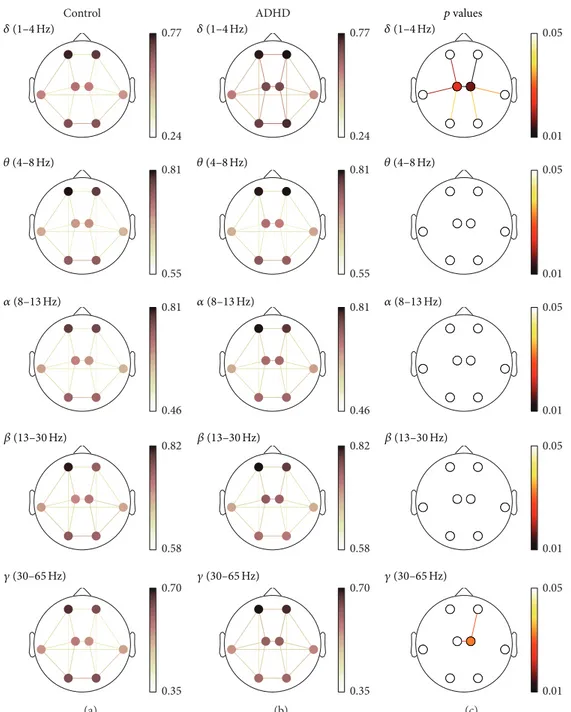
PLV results supported the patterns discussed previously. Short-distance values were higher in ADHD children com-pared to controls, and these differences were statistically
significant within left-central (𝛿) and right-central (𝛿 and
𝛾) regions. Furthermore, interhemispheric long-distance
val-ues also showed statistically significant differences between
central regions (𝛿and 𝛾). Finally, intrahemispheric values
revealed significant differences between anterior and central
regions (𝛿and𝛾), central and lateral areas (𝛿), and central and
posterior regions (𝛿).
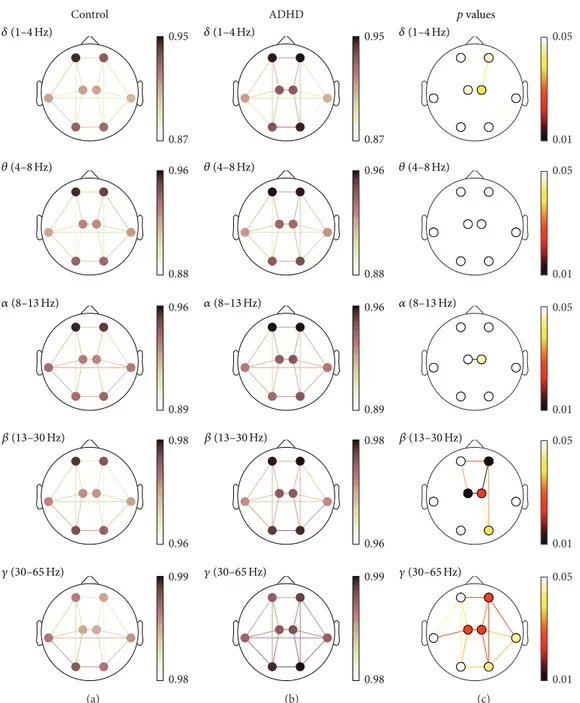
In the same way as COH and PLV values, short-distance ED values were higher in ADHD children in comparison to controls. There were statistically significant differences
within right-anterior (𝛿,𝛽, and𝛾), left-central (𝛿,𝛽, and𝛾),
right-central (𝛿, 𝛼, 𝛽, and 𝛾), right-lateral (𝛽), and
right-posterior (𝛽and𝛾) regions. Long-distance values also showed
significant differences in the same frequency bands and regions. Interhemispheric long-distance values were
statisti-cally significant between anterior (𝛿, 𝛽, and 𝛾), central (𝛿,
𝛼, 𝛽, and𝛾), lateral (𝛽), and posterior regions (𝛽). Finally,
𝛿,𝛽, and 𝛾showed several significant differences in
intra-hemispheric neural relationships. Significant differences were
found between anterior and central regions (𝛽and𝛾in both
hemispheres, as well as 𝛿 only in the right hemisphere),
central and posterior regions (𝛾in both hemispheres, as well
as𝛿and𝛽only in the right one), and anterior and
right-posterior regions (𝛽and 𝛾). Additionally, it is noteworthy
that𝛾revealed statistically significant differences among all
regions with the exception of the connection between left-lateral and left-posterior areas.
Finally, receiver operating characteristic (ROC) curves, with a leave-one-out cross-validation procedure, were used to assess the ability of COH, PLV, and ED to discriminate ADHD patients from control children. Only interactions that showed significant differences between groups were evaluated with this technique. For COH measure, the highest
accuracy was reached in 𝛿 band for short-distance values
at the right-central region: 88.89% (76.92% sensitivity; 100% specificity). In the case of PLV, an accuracy of 81.48% (69.23% sensitivity; 92.86% specificity) was obtained for
central interhemispheric values, also in𝛿band. Lastly, the
Control
0.76
0.17
0.71
0.15
0.73
0.14
0.65
0.13
0.52
0.12
𝛾(30–65Hz)
𝛽(13–30Hz)
𝛼(8–13Hz)
𝜃(4–8Hz)
𝛿(1–4Hz)
(a)
ADHD
0.76
0.17
0.71
0.15
0.73
0.14
0.65
0.13
0.52
0.12
𝛾(30–65Hz)
𝛽(13–30Hz)
𝛼(8–13Hz)
𝜃(4–8Hz)
𝛿(1–4Hz)
(b)
0.05
0.01
0.05
0.01
0.05
0.01
0.05
0.01
0.05
0.01
𝛾(30–65Hz)
𝛽(13–30Hz)
𝛼(8–13Hz)
𝜃(4–8Hz)
𝛿(1–4Hz)
pvalues
(c)
Figure 2: COH spatial analyses. (a) and (b) depict COH values for controls and ADHD patients, respectively. (c) displays statistically significant values between groups, where connections among regions were only displayed when statistically significant differences within groups were obtained (Mann-Whitney𝑈test, FDR-corrected𝑝values<0.05).
4. Discussion
4.1. Neural Interactions in ADHD. The first research question pointed out in Introduction addressed the characterization of ADHD neural interaction patterns. Previous researches revealed that neural oscillations are an essential instrument for enabling coordinated synchronous activity during normal brain functioning [38]. They also suggest that different frequency bands are involved in distinct functional and
computational interactions [32, 39]. In this research, the
patterns showed statistically significant differences in 𝛿, 𝛼,
𝛽, and𝛾 bands. The main differences were found in𝛿, 𝛽,
and 𝛾, especially in central and anterior regions.
𝛾(30–65Hz)
𝛽(13–30Hz)
𝛼(8–13Hz)
𝜃(4–8Hz)
𝛿(1–4Hz)
Control
0.77
0.24
0.81
0.55
0.81
0.46
0.82
0.58
0.70
0.35 (a)
0.77
0.24
0.81
0.55
0.81
0.46
0.82
0.58
0.70
0.35 ADHD
𝛾(30–65Hz)
𝛽(13–30Hz)
𝛼(8–13Hz)
𝜃(4–8Hz)
𝛿(1–4Hz)
(b)
0.05
0.01
0.05
0.01
0.05
0.01
0.05
0.01
0.05
0.01
𝛾(30–65Hz)
𝛽(13–30Hz)
𝛼(8–13Hz)
𝜃(4–8Hz)
𝛿(1–4Hz) p
values
(c)
Figure 3: PLV spatial analyses. (a) and (b) depict PLV values for controls and ADHD patients, respectively. (c) displays statistically significant values between groups, where connections among regions were only displayed when statistically significant differences within groups were obtained (Mann-Whitney𝑈test, FDR-corrected𝑝values<0.05).
Our findings are consistent with different previous researches. For instance, Montagu [41] showed a significantly higher intrahemispheric COH at frequencies up to 8 Hz in ADHD compared to a control group. Similar results were reported by other studies, which revealed an increased inter-hemispheric and intrainter-hemispheric COH in frontal and cen-tral regions [42, 43]. More recent researches also associated
ADHD with an increased intrahemispheric COH in𝛿and𝛽
[44]. Additionally, Heinrichs-Graham et al. [22] applied PLV
to evaluate neural coupling in adults with ADHD during an auditory attention task. They obtained that adults with
ADHD showed higher functional coupling in𝛽(14–30 Hz)
and𝛾 (30–56 Hz) than controls. These coupling alterations
may arise from an aberrant balance of excitation and inhi-bition in local neural circuits of ADHD children [45].
Control
0.95
0.87
0.96
0.88
0.96
0.89
0.98
0.96
0.99
0.98
𝛾(30–65Hz)
𝛽(13–30Hz)
𝛼(8–13Hz)
𝜃(4–8Hz)
𝛿(1–4Hz)
(a)
ADHD
0.95
0.87
0.96
0.88
0.96
0.89
0.98
0.96
0.99
0.98
𝛾(30–65Hz)
𝛽(13–30Hz)
𝛼(8–13Hz)
𝜃(4–8Hz)
𝛿(1–4Hz)
(b)
0.05
0.01
0.05
0.01
0.05
0.01
0.05
0.01
0.05
0.01
𝛾(30–65Hz)
𝛽(13–30Hz)
𝛼(8–13Hz)
𝜃(4–8Hz)
𝛿(1–4Hz)
pvalues
(c)
Figure 4: ED spatial analyses (ED). (a) and (b) depict ED values for controls and ADHD patients, respectively. (c) displays statistically significant values between groups, where connections among regions were only displayed when statistically significant differences within groups were obtained (Mann-Whitney𝑈test, FDR-corrected𝑝values<0.05).
suggested that gamma-frequency activity also plays an important role in attention and memory [46]. Indeed, our research revealed a statistically significant increase of interchannel relationships in ADHD patients compared to
controls in𝛾. In sum, our findings agree with previous studies
about children with ADHD, which showed an increase in neural coupling in comparison to controls. Notwithstand-ing, our results revealed alterations also in high frequency bands.
while ED barely showed statistically significant differences. However, ED showed more differences than COH and PLV
at higher frequencies (𝛽 and 𝛾), especially in 𝛾.
Further-more, our results showed that frontal and central regions are the most affected in ADHD patients in comparison to controls.
Over the past two decades, structural and functional imaging studies have associated ADHD with abnormalities in frontal brain regions (for a review, see Bush et al. [8]). A recent EEG study revealed a similar conclusion with ADHD chil-dren: most EEG differences were related to increased fron-tocentral activity in ADHD children [47]. This fronfron-tocentral increase was interpreted as a sign of cortical hypoarousal in ADHD patients and might represent a delay in regional cortical maturation. Shaw et al. [10] studied the growth trajectory of each cortical point. They concluded that ADHD is characterized by a maturational delay, which is more prominent in the prefrontal cortical regions essential for control of cognitive processes, including attention and motor planning [10]. Finally, Fern´andez et al. [16] found a significant decrease of Lempel-Ziv complexity values in the MEG frontal activity of ADHD patients, which might reflect a delay during brain development. In summary, our findings revealed that ADHD abnormalities in frontal cortex affect neural interactions between different brain areas. Additionally, these results suggest that the brain development in children with ADHD diverges from that of controls. Such divergence might consist of a delayed or altered cortical maturation, which mainly affects frontal cortical regions.
4.3. Complementarity of Neural Interaction Measures. We raised the third research question about whether the pro-posed measures provide complementary analyses. Several studies suggested that the interactions between pairs of sensors can be useful to understand the underlying neural mechanisms [18, 48]. However, while most of the previous coupling studies applied a single measure, mainly COH, we calculated three different measures (COH, PLV, and ED). Consequently, we analyzed both phase, which is related to neuronal firing, and amplitude, which is associated with the discharges of assemblies of neurons [38, 49, 50]. The com-bination of the three measures could constitute a sensitive methodology for functional disconnectivity of local and large-scale networks in ADHD.
It should be noted that COH, PLV, and ED are not equiva-lent, but they provide three complementary points of view for neural characterization. COH has been used in several studies to assess functional connectivity for resting-state approaches [21, 43, 44]. On the other hand, PLV and phase coherence are better suited to address attentional processes associated with ADHD, such as visual or auditory recognition [22]. Besides COH and PLV, similarity approaches, such as ED, may gain novel insights into brain activity by providing a phase-independent measure of resting-state neural interac-tions. There is a lack of studies that have applied statistical distances to characterize EEG/MEG recordings in ADHD. In this regard, one of the main contributions of our study is the application of ED to describe the similarity patterns in ADHD.
To sum up, different interaction patterns were found in our study depending on the frequency band, the region of cortex, and the measure considered. As shown in Figures 2, 3, and 4, COH and PLV obtained the largest statistically
significance results compared to ED in𝛿frequency band. On
the other hand, ED was more sensitive in 𝛽and 𝛾 bands,
providing further significant differences. Hence, our results also suggest that the three measures are complementary.
4.4. Limitations and Future Research Lines. Several concerns of this research merit consideration. Firstly, the size of the sample is small to be useful as a diagnostic tool. Therefore, this study should be extended on a larger patient population. Secondly, the current study was carried out during a resting-state condition. This condition has the limitation of being subjective, since it relies on the particular introspective capabilities of each subject [51]. The coupling patterns would be significantly different during the performance of visual or memory tasks. In this regard, it would be interesting to analyze the interaction patterns associated with these tasks in future works. Thirdly, interaction values were grouped into predefined brain regions to facilitate the interpretation of the results, despite the loss of MEG spatial resolution. Future studies might benefit from exploring the affected regions in detail. Likewise, COH, PLV, and ED were computed in conventional EEG frequency bands to facilitate the clinical interpretation of the results. However, the choice of the spectral bandwidth can affect the sensitivity of PLV and ED [26]. Further studies should be devoted to exploring whether other divisions of the frequency range using, for instance, a uniform spectral bandwidth distribution can be useful to improve ADHD identification. In addition to this, the detected increase in connectivity is not specific to ADHD. It also appears in other pathological and physiological states in children, such as autism spectrum disorder [52]. Finally, as aforementioned, it is noteworthy that neuronal processing comprises interactions between oscillations at different fre-quencies [53]. Therefore, it might be interesting to evaluate cross-frequency coupling, which provides a plausible mech-anism for the neural coordination during action functions, perception, and cognition [54].
5. Conclusions
This study investigated COH, PLV, and ED of MEG signals in children with ADHD. Our results suggest that ADHD is associated with a neuronal hyperconnectivity in central
and right anterior regions for𝛿,𝛽, and𝛾 frequency bands.
Competing Interests
There is no conflict of interests that could inappropriately influence this research work.
Acknowledgments
This research was supported by “Ministerio de Econom´ıa y Competitividad” and FEDER (TEC2014-53196-R), by “Con-sejer´ıa de Sanidad de la Junta de Castilla y Le´on” (BIO/VA08/ 15), and by “Consejer´ıa de Educaci´on de la Junta de Castilla y Le´on” (VA059U13). A. Bachiller was in receipt of a PIF-UVA grant from University of Valladolid.
References
[1] P. H. Wender,Attention-Deficit Hyperactivity Disorder in Adults, Oxford University Press, New York, NY, USA, 1995.
[2] W. E. Pelham, E. M. Gnagy, K. E. Greenslade, and R. Milich, “Teacher ratings of DSM-III-R symptoms for the disruptive behavior disorders,”Journal of the American Academy of Child and Adolescent Psychiatry, vol. 31, no. 2, pp. 210–218, 1992. [3] S. Lindgren, M. Wolraich, A. Stromquist, C. Davis, R. Milich,
and D. Watson, “Diagnostic heterogeneity in attention-deficit hyperactivity disorder,” in Proceedings of the Fourth Annual NIMH International Research Conference on the Classification and Treatment of Mental Disorders in General Medical Settings, Bethesda, Md, USA, 1990.
[4] J. Biederman and S. V. Faraone, “Attention-deficit hyperactivity disorder,”The Lancet, vol. 366, no. 9481, pp. 237–248, 2005. [5] M. Ernst, A. J. Zametkin, J. A. Matochik, L. Liebenauer, G.
A. Fitzgerald, and R. M. Cohen, “Effects of intravenous dex-troamphetamine on brain metabolism in adults with attention-deficit hyperactivity disorder (ADHD). Preliminary findings,” Psychopharmacology Bulletin, vol. 30, no. 2, pp. 219–225, 1994. [6] J. B. Schweitzer, T. L. Faber, S. T. Grafton, L. E. Tune, J. M.
Hoffman, and C. D. Kilts, “Alterations in the functional anatomy of working memory in adult attention deficit hyperactivity disorder,”American Journal of Psychiatry, vol. 157, no. 2, pp. 278– 280, 2000.
[7] G. Bush, E. M. Valera, and L. J. Seidman, “Functional neuro-imaging of attention-deficit/hyperactivity disorder: a review and suggested future directions,”Biological Psychiatry, vol. 57, no. 11, pp. 1273–1284, 2005.
[8] G. Bush, P. Luu, and M. I. Posner, “Cognitive and emotional influences in anterior cingulate cortex,” Trends in Cognitive Sciences, vol. 4, no. 6, pp. 215–222, 2000.
[9] S. Durston, “A review of the biological bases of ADHD: what have we learned from imaging studies?”Mental Retardation and Developmental Disabilities Research Reviews, vol. 9, no. 3, pp. 184–195, 2003.
[10] P. Shaw, K. Eckstrand, W. Sharp et al., “Attention-deficit/hyper-activity disorder is characterized by a delay in cortical matu-ration,”Proceedings of the National Academy of Sciences of the United States of America, vol. 104, no. 49, pp. 19649–19654, 2007. [11] P. M. Rossini, S. Rossi, C. Babiloni, and J. Polich, “Clinical neu-rophysiology of aging brain: from normal aging to neurodegen-eration,”Progress in Neurobiology, vol. 83, no. 6, pp. 375–400, 2007.
[12] L. B. N. Hinkley, J. P. Owen, M. Fisher, A. M. Findlay, S. Vino-gradov, and S. S. Nagarajan, “Cognitive impairments in schizo-phrenia as assessed through activation and connectivity mea-sures of magnetoencephalography (MEG) data,” Frontiers in Human Neuroscience, vol. 3, article 73, 2010.
[13] E. Niedermeyer and F. H. L. da Silva,Electroencephalography: Basic Principles, Clinical Applications, and Related Fields, Lip-pincott Williams & Wilkins, Baltimore, Md, USA, 2005. [14] R. J. Barry, S. J. Johnstone, and A. R. Clarke, “A review of
elec-trophysiology in attention-deficit/hyperactivity disorder: II. Event-related potentials,”Clinical Neurophysiology, vol. 114, no. 2, pp. 184–198, 2003.
[15] J. Monge, C. G´omez, J. Poza, A. Fern´andez, J. Quintero, and R. Hornero, “MEG analysis of neural dynamics in attention-deficit/hyperactivity disorder with fuzzy entropy,”Medical Engi-neering and Physics, vol. 37, no. 4, pp. 416–423, 2015.
[16] A. Fern´andez, J. Quintero, R. Hornero et al., “Complexity anal-ysis of spontaneous brain activity in attention-deficit/hyper-activity disorder: diagnostic implications,”Biological Psychiatry, vol. 65, no. 7, pp. 571–577, 2009.
[17] K. J. Friston, “Brain function, nonlinear coupling, and neuronal transients,”Neuroscientist, vol. 7, no. 5, pp. 406–418, 2001. [18] C. J. Stam and E. C. W. van Straaten, “The organization of
physiological brain networks,” Clinical Neurophysiology, vol. 123, no. 6, pp. 1067–1087, 2012.
[19] K. J. Friston, “Functional and effective connectivity in neu-roimaging: a synthesis,”Human Brain Mapping, vol. 2, no. 1-2, pp. 56–78, 1994.
[20] V. Sakkalis, “Review of advanced techniques for the estimation of brain connectivity measured with EEG/MEG,”Computers in Biology and Medicine, vol. 41, no. 12, pp. 1110–1117, 2011. [21] A. R. Clarke, R. J. Barry, R. McCarthy et al., “Coherence
in children with Attention-Deficit/Hyperactivity Disorder and excess beta activity in their EEG,”Clinical Neurophysiology, vol. 118, no. 7, pp. 1472–1479, 2007.
[22] E. Heinrichs-Graham, J. D. Franzen, N. L. Knott, M. L. White, M. W. Wetzel, and T. W. Wilson, “Pharmaco-MEG evidence for attention related hyper-connectivity between auditory and pre-frontal cortices in ADHD,”Psychiatry Research-Neuroimaging, vol. 221, no. 3, pp. 240–245, 2014.
[23] J. J. Gonz´alez, L. D. M´endez, S. Ma˜nas, M. R. Duque, E. Pereda, and L. de Vera, “Performance analysis of univariate and multi-variate EEG measurements in the diagnosis of ADHD,”Clinical Neurophysiology, vol. 124, no. 6, pp. 1139–1150, 2013.
[24] G. V. Tcheslavski and A. A. (Louis) Beex, “Phase synchrony and coherence analyses of EEG as tools to discriminate between children with and without attention deficit disorder,”Biomedical Signal Processing and Control, vol. 1, no. 2, pp. 151–161, 2006. [25] P. L. Nunez, R. Srinivasan, A. F. Westdorp et al., “EEG coherency
I: statistics, reference electrode, volume conduction, Laplacians, cortical imaging, and interpretation at multiple scales,” Elec-troencephalography and Clinical Neurophysiology, vol. 103, no. 5, pp. 499–515, 1997.
[26] J.-P. Lachaux, E. Rodriguez, J. Martinerie, and F. J. Varela, “Mea-suring phase synchrony in brain signals,”Human Brain Map-ping, vol. 8, no. 4, pp. 194–208, 1999.
[28] A. Bachiller, J. Poza, C. G´omez, V. Molina, V. Suazo, and R. Hornero, “A comparative study of event-related coupling pat-terns during an auditory oddball task in schizophrenia,”Journal of Neural Engineering, vol. 12, no. 1, Article ID 016007, 2015. [29] C. K. Conners,Spanish Conners’ Parent Rating Scales-Revised,
Multi-Health Systems, North Tonawanda, NY, USA, 2000. [30] W. Reich and Z. Welner, Revised Version of the Diagnostic
Interview for Children and Adolescents (DICA-R), Department of Psychiatry, School of Medicine, Washington University, St. Louis, Mo, USA, 1998.
[31] P. L. Nunez, R. B. Silberstein, Z. Shi et al., “EEG coherency II: experimental comparisons of multiple measures,”Clinical Neu-rophysiology, vol. 110, no. 3, pp. 469–486, 1999.
[32] A. Von Stein and J. Sarnthein, “Different frequencies for dif-ferent scales of cortical integration: from local gamma to long range alpha/theta synchronization,” International Journal of Psychophysiology, vol. 38, no. 3, pp. 301–313, 2000.
[33] P. Bob, M. Palus, M. Susta, and K. Glaslova, “EEG phase syn-chronization in patients with paranoid schizophrenia,” Neuro-science Letters, vol. 447, no. 1, pp. 73–77, 2008.
[34] P. C. Mahalanobis, “On the generalized distance in statistics,” Proceedings of the National Academy of Sciences of the United States of America, vol. 2, pp. 49–55, 1936.
[35] M. Basseville, “Distance measures for signal processing and pattern recognition,”Signal Processing, vol. 18, no. 4, pp. 349– 369, 1989.
[36] R. Bru˜na, J. Poza, C. G´omez, M. Garc´ıa, A. Fern´andez, and R. Hornero, “Analysis of spontaneous MEG activity in mild cog-nitive impairment and Alzheimer’s disease using spectral entropies and statistical complexity measures,”Journal of Neural Engineering, vol. 9, no. 3, Article ID 036007, 2012.
[37] C. J. Stam, B. F. Jones, I. Manshanden et al., “Magnetoen-cephalographic evaluation of resting-state functional connec-tivity in Alzheimer’s disease,”NeuroImage, vol. 32, no. 3, pp. 1335–1344, 2006.
[38] W. Singer, “Neuronal synchrony: a versatile code for the defini-tion of reladefini-tions?”Neuron, vol. 24, no. 1, pp. 49–65, 1999. [39] T. P. Meehan and S. L. Bressler, “Neurocognitive networks:
findings, models, and theory,”Neuroscience and Biobehavioral Reviews, vol. 36, no. 10, pp. 2232–2247, 2012.
[40] K. Supekar, L. Q. Uddin, A. Khouzam et al., “Brain hypercon-nectivity in children with autism and its links to social deficits,” Cell Reports, vol. 5, no. 3, pp. 738–747, 2013.
[41] J. D. Montagu, “The hyperkinetic child: a behavioural, electro-dermal and EEG investigation,”Developmental Medicine and Child Neurology, vol. 17, no. 3, pp. 299–305, 1975.
[42] R. J. Chabot, H. Merkin, L. M. Wood, T. L. Davenport, and G. Serfontein, “Sensitivity and specificity of QEEG in children with attention deficit or specific developmental learning disorders,” Clinical EEG Electroencephalography, vol. 27, no. 1, pp. 26–33, 1996.
[43] R. J. Chabot and G. Serfontein, “Quantitative electroencephalo-graphic profiles of children with attention deficit disorder,” Biological Psychiatry, vol. 40, no. 10, pp. 951–963, 1996. [44] F. E. Dupuy, A. R. Clarke, R. J. Barry, R. McCarthy, and M.
Selikowitz, “EEG coherence in children with attention-deficit/ hyperactivity disorder: differences between good and poor responders to methylphenidate,”Psychiatry Research, vol. 180, no. 2-3, pp. 114–119, 2010.
[45] G. Testa-Silva, A. Loebel, M. Giugliano, C. P. J. De Kock, H. D. Mansvelder, and R. M. Meredith, “Hyperconnectivity and slow synapses during early development of medial prefrontal cortex in a mouse model for mental retardation and Autism,”Cerebral Cortex, vol. 22, no. 6, pp. 1333–1342, 2012.
[46] O. Jensen, J. Kaiser, and J.-P. Lachaux, “Human gamma-frequency oscillations associated with attention and memory,” Trends in Neurosciences, vol. 30, no. 7, pp. 317–324, 2007. [47] S. K. Loo and S. Makeig, “Clinical utility of EEG in
attention-deficit/hyperactivity disorder: a research update,” Neurothera-peutics, vol. 9, no. 3, pp. 569–587, 2012.
[48] N. B. Turk-Browne, “Functional interactions as big data in the human brain,”Science, vol. 342, no. 6158, pp. 580–584, 2013. [49] F. Varela, J.-P. Lachaux, E. Rodriguez, and J. Martinerie, “The
brainweb: phase synchronization and large-scale integration,” Nature Reviews Neuroscience, vol. 2, no. 4, pp. 229–239, 2001. [50] P. J. Uhlhaas, C. Haenschel, D. Nikoli´c, and W. Singer, “The
role of oscillations and synchrony in cortical networks and their putative relevance for the pathophysiology of schizophrenia,” Schizophrenia Bulletin, vol. 34, no. 5, pp. 927–943, 2008. [51] E. Tagliazucchi, F. von Wegner, A. Morzelewski, S. Borisov,
K. Jahnke, and H. Laufs, “Automatic sleep staging using fMRI functional connectivity data,”Neuroimage, vol. 63, no. 1, pp. 63– 72, 2012.
[52] P. Barttfeld, B. Wicker, S. Cukier, S. Navarta, S. Lew, and M. Sigman, “A big-world network in ASD: dynamical connectivity analysis reflects a deficit in long-range connections and an excess of short-range connections,”Neuropsychologia, vol. 49, no. 2, pp. 254–263, 2011.
[53] M. Le Van Quyen and A. Bragin, “Analysis of dynamic brain oscillations: methodological advances,”Trends in Neurosciences, vol. 30, no. 7, pp. 365–373, 2007.
Submit your manuscripts at
http://www.hindawi.com
Computer Games Technology
International Journal of
Hindawi Publishing Corporation
http://www.hindawi.com Volume 2014
Hindawi Publishing Corporation
http://www.hindawi.com Volume 2014
Distributed Sensor Networks International Journal of
Advances in
Fuzzy
Systems
Hindawi Publishing Corporation
http://www.hindawi.com Volume 2014
International Journal of Reconfigurable Computing
Hindawi Publishing Corporation
http://www.hindawi.com Volume 2014
Hindawi Publishing Corporation
http://www.hindawi.com Volume 2014
Applied
Computational
Intelligence and Soft
Computing
Advances in
Artificial
Intelligence
Hindawi Publishing Corporation
http://www.hindawi.com Volume 2014
Advances in
Software Engineering
Hindawi Publishing Corporation
http://www.hindawi.com Volume 2014
Hindawi Publishing Corporation
http://www.hindawi.com Volume 2014
Electrical and Computer Engineering
Journal of Journal of
Computer Networks and Communications
Hindawi Publishing Corporation
http://www.hindawi.com Volume 2014
Hindawi Publishing Corporation
http://www.hindawi.com Volume 2014
Multimedia
International Journal of
Biomedical Imaging
Hindawi Publishing Corporation
http://www.hindawi.com Volume 2014
Artificial
Neural Systems
Advances inHindawi Publishing Corporation
http://www.hindawi.com Volume 2014
Robotics
Journal ofHindawi Publishing Corporation
http://www.hindawi.com Volume 2014 Hindawi Publishing Corporationhttp://www.hindawi.com Volume 2014 Computational Intelligence and Neuroscience
Hindawi Publishing Corporation
http://www.hindawi.com Volume 2014
Modelling & Simulation in Engineering
Hindawi Publishing Corporation
http://www.hindawi.com Volume 2014
The Scientific
World Journal
Hindawi Publishing Corporation
http://www.hindawi.com Volume 2014
Hindawi Publishing Corporation
http://www.hindawi.com Volume 2014
Human-Computer Interaction
Advances in
Computer EngineeringAdvances in
Hindawi Publishing Corporation