ECONOMÍA
SERIE DOCUMENTOS
No. 40, Enero de 2004
Performance and Efficiency in Colombia’s Power
Utilities: An Assessment of the 1994 Reform
Carlos Pombo Rodrigo Taborda
BORRADORES DE
INVESTIGACIÓN BORRADORES
DE
31 p. : cuad., tab. –- (Economía. Serie Documentos, 40). Incluye bibliografía.
ISSN: 0124-4396
P
ERFORMANCE ANDE
FFICIENCY INC
OLOMBIA’
SP
OWERU
TILITIES: A
NA
SSESSMENT OF THE1994 R
EFORM* Associate professor and director graduate studies, Department of Economics, Universidad del Rosario.
Financial support from the IDB’s Latin American Research Network is gratefully acknowledged and Instituto Colombiano para el Desarrollo de la Ciencia y la Tecnología “Francisco José de Caldas” - COLCIENCIAS.
C
ARLOSP
OMBO*[email protected]
Facultad de Economía Universidad del Rosario Calle 14 # 4 – 69 Bogotá, Colombia
R
ODRIGOT
ABORDA[email protected]
Facultad de Economía Universidad del Rosario Calle 14 # 4 – 69 Bogotá, Colombia
A
BSTRACTThis paper describes the core features of the power sector 1994 regulatory reform and evaluates utility perfor-mance and efficiency before and after the reform. The perforperfor-mance analysis assesses the changes in means and medians of a series of profitability, efficiency, investment, sales of the privatized power holdings. Technical efficiency is estimated through DEA technique in a sample of 33 power thermal-plants that account for 85% of the thermal park and 12 distribution utilities. The sample units are plants that were active before the reform and new entrants that started business operations after the reform. The main outcomes show that efficiency scores have improved after the reform and that regulatory policy has had a positive effect on technical efficiency in thermal power generation. In contrasts the less efficient power distributors got worsened after the reform and were not able to undertake plant restructuring in order to catch up productive efficiency with respect to the best practice production frontier.
JEL Classification: L43, L51, L94,O3
Key Words: Privatization, industrial restructuring, Colombian power sector, regulatory reform
R
ESUMENEl artículo describe las características centrales de la reforma regulatoria al sector eléctrico en 1994 y evalúa el desempeño y la eficiencia de las empresas públicas antes y después de la reforma. El análisis de desempeño evalúa los cambios en medias y medianas en ganancias, eficiencia, inversión y ventas de las empresas privatizadas en el sector. La eficiencia técnica es estimada mediante la técnica DEA en una muestra de 33 plantas térmicas de energía, que representan el 85% del parque térmico; y 12 empresas distribuidoras de energía. La muestra de plantas generadoras está compuesta por plantas que estaban activas antes de la reforma y plantas nuevas que entraron en operación después de la reforma. Los principales resultados muestran que la eficiencia mejoro después de la reforma y que la política regulatoria ha tenido un efecto positivo en la eficiencia de la generación térmica de energía. Por el contrario, las distribuidoras de energía menos eficientes empeoraron después de la reforma y no llevaron a cabo una reestructuración para alcanzar la eficiencia productiva respecto a las empresas que conforman la frontera de eficiencia en distribución de energía.
Clasificación JEL: L43, L51, L94, O3.
1. I
NTRODUCTIONThe 1994 regulatory reform of the power sector in Colombia is one of first reforms in Latin America that introduced a market system for the wholesale electricity transactions and the first in implementing a bidding system for its pool in the region. In this sense, the reform deepened the Chilean as well as the Argentinean experiences, where wholesale electricity prices were based on declared costs rather than marginal supply prices.1 The reform sought to introduce
new competition and set up an independent regulatory system. In that sense, the main purpose was to set the basis for the expansion and diversification of power generation sources, improv-ing both the sector’s efficiency and its reliability. Political willimprov-ingness to support this plan was important by 1992 because the country was in the middle of a generalized power shortage and rationing schedules.
The generating system had to be made less vulnerable to abnormal hydrological conditions (i.e., El Niño) and more reliant on thermal generation from either coal or natural gas. The reform focused to incentive utilities’ efficiency and productivity levels through the introduc-tion of market competiintroduc-tion, independent grid access, and markup price regulaintroduc-tion for power distribution. Inspired in the British reform, the regulatory reform in Colombia split the tradi-tional vertical monopoly structure of the power sector into four different activities: generation, transmission, distribution and commercialization of electricity; it also created the pool market for electricity with remarkable results in buyer’s price hedging, efficiency improvements in power generation, and overall gain in system reliability due to firm entry during the last recorded 1996-1997 El Niño cycle. In addition the positive effect of the new regulation implied the setting up of a non-regulated market of large clients that boosted transactions of forward electricity contracts.
Regarding power transmission, new regulation handle this activity as a natural monopoly. The reform consolidated Interconexión Eléctrica S.A (ISA) as the country’s power transmission company.2 Power distributors as domiciliary public service providers face two types of
regula-tion. The first one is price regularegula-tion. The regulatory commission [Comisión de Regulación de Energía y Gas (CREG)] currently sets the markup formula for distributors as well as the deter-mining the nature of pass through to final users. The second type of regulation concerns quality control, whereby companies are subject to sanctions if their service fails to meet minimum quality standards. The reform was designed to impact two types of final users. Residential users are mainly regulated consumers. Final prices for them are set by a markup formula. The reform
1 A complete presentation of the regulatory reform in Colombia is in Pombo (2001). Estache and
Rodriguez-Pardina (1998) and Mendoça and Dahl (1999) outlines a general presentation of the process in Latin America. The study of the Guash and Spiller (1999) published by the World Bank is a comprehensive study regarding privatization, regulatory policy instruments, and contract designing for several Latin American countries and network industries. Nonetheless, for the power sector the Colombian experienced was tangentially mentioned in the study. On the other hand the IDB 2001 provides a short analysis the sustainability of the power sector reforms in Latin America. For an international review see Newbery (2000).
2 ISA is in fact the larger power transported for the Andean Region. ISA won in 2001 the concession for the
also introduced the figure of non-regulated users. They are large clients, mainly commercial and industrial users. The reforms and regulations led power holdings to undertake a generalized divestiture process across electricity holdings in order to fully separate power generation, trans-mission, distribution, and the setting up of new commercialization activities. Thus, privatization arose as one instrument for promoting market competition and industry restructuring, and it became a complementary policy within a broad deregulatory context.
This paper presents an ex-post performance analysis for the electric utilities based on three elements: i) an analysis of firm performance through the changes in means and medians of profitability, operating efficiency, labor, investment and sales indicators of the privatized power utilities ii) direct measures of productive efficiency scores through data envelope analysis pro-gramming (DEA) applied to thermal power plants as well as a sample of electricity distribution companies and, iii) a econometric analysis regarding the determinants and micro-fundamentals of the thermal plant efficiency scores.
The paper core objectives are two-fold. First it seeks to provide new empirical evidence regarding changes in electric utilities performance and productive efficiency derived from the 1994 regulatory reform. The results look to offer objective elements for ex-post policy evalua-tion regarding the benefits of market designing, promoevalua-tion of market competievalua-tion, and price and quality regulation. The results are also important for contrasting purposes were the Colom-bian experience has not been fully stressed in international studies despite of been the first pool based on a bidding procedure in Latin America. Second, the focus on the efficiency analysis completes previous results of recent studies regarding the power sector reform in Colombia.3
The paper structure is organized in four additional sections. Section 2 outlines the privatization and regulatory reform program undertook during the 1994-1998 period. Section 3 presents the results of changes in performance variables of the privatized power-holdings. It evaluates the null hypothesis of structural changes in indicators mean and medians outlines regarding firm profitability, efficiency, investment, payroll size, and sales. The analysis carried out takes into account industry-adjusted indicators by specific control group. Section 4 carries out a DEA plant efficiency measurement across thermal generation plants that counts for 85% of system thermal park, and a preliminary assessment of changes in productive efficiency for the larger power distribution companies after the reform. Section 5 performs the econometric analysis of the thermal plant efficiency, and Section 6 concludes.
2. I
NDUSTRYR
ESTRUCTURING ANDP
RIVATIZATION INTHEP
OWERS
ECTOR4Regulatory reform in Colombia’s electricity supply industry (ESI) is supported by the Elec-tric Law (Law 143) and by the Domiciliary Public Services Law (Law 142) of July 1994. The reform changed the structure of the vertically integrated industry. The new regulatory institu-tions started to operate one year later. The reform’s core elements followed the schemes adopted
3 See Pombo (2001) for more details.
in Great Britain concerning the separation of power activities and markets, the setting up of an electricity spot market or pool, and the development of a long-term contract market for elec-tricity.5 Law 143 created the Regulatory Commission for Energy and Gas [Comisión de Regulación
de Energía y Gas, (CREG)] and rules regarding: i) the sector’s planning and expansion plans, ii) the regulatory scheme, iii) power generation, iv) transmission and grid operation, v) grid access fees, vi) the rate-setting regime for electricity sales, vii) concession contracts, and vii) environ-mental issues.
The power sector reform sought to introduce new competition and set up an independent regulatory system. In that sense, the main purpose was to set the basis for the expansion and diversification of power generation sources, improving both the sector’s efficiency and its reli-ability. Political willingness to support this plan was important by 1992 because the country was in the middle of a generalized power shortage and electricity rationing schedules were imposed. The generating system had to be made less vulnerable to abnormal hydrological con-ditions (i.e., El Niño) and more reliant on thermal generation from either coal or natural gas.
Diagram 1 synthesizes the post-reform power market structure by power activity: genera-tion, transmission and distribution. There are several comments worth mentioning. First, the split among power activities implied the divestiture of the main power holdings that were vertically integrated monopolies. The same happened with the national grid company[Interconexión Eléctrica S.A. (ISA)], which had to sell all of its power generating units in 1995 and become an independent generator firm. The new regulatory framework seeks to promote market entry and competition among generators. They compete openly by sending their bids one day ahead to the pool. The sale price is based on an hour of use and it distinguishes between peak and off-peak hours. The National Dispatch Center, which is located at ISA’s headquarters, combines infor-mation regarding the system’s constraints, such as hydrological factors, reservoir levels, and transmission bottlenecks, with final commercial demand in order to determine the dispatch orders. Thus, the market price that the pool6 sets is the highest marginal bid that clears the
market each hour. Based on the above, the pool administrator runs the next-day merit order dispatches.7 Financial transactions take place by direct purchases from the pool or through
5 The national grid company Interconexión ISA as the largest nationwide power generator and transporter of bulk
electricity following the vertically integrated natural monopoly model. For more details, see World Bank (1991). A complete description of the regulatory reform in Colombia’s power sector is in Pombo (2001b) and ISA reports. Historically, Colombia’s power sector has been divided in five regional markets: Bogotá Power Company (EEB); the Atlantic Coast Regional Electric Corporation Eléctrica S.A (ISA) was founded in 1967. By that time, the sectoral development view was to consolidate (CORELCA), Public Enterprises of Medellín (EPM), Public Enterprises of Cali and the Cauca Valley Corporation (EMCALI and CVC), and the Colombian Power Institute (ICEL). So far, only two out of the five power distribution networks have been privatized. Nevertheless, one has to keep in mind that the city of Bogotá is still the largest shareholder of CODENSA, the power distribution utility founded after the EEB divestiture. Therefore, EPM, EMCALI, and ICEL still, as public utilities, cover 70% of the geographical areas that belong to the National Interconnected System. Hence, privatization and entry competition remain a pending and unfinished task for local power distribution.
6 The pool is locally known as the
Mercado de Energía Mayorista (MEM).
7 The power market in Colombia parallels the British pool of the early 1990s. For more details on electricity markets
contracts signed directly between generators and final users. However, the pool administrator runs the invoicing generated by all financial agreements. That is, that office pays and collects bills derived from contracts.
Regarding power transmission, new regulation handle this activity as a natural monopoly. The reform consolidated ISA as the country’s power transmission firm. In this sense, the regulator determines prices and guarantees access to the grid to all providers. This company is not allowed to have an equity share in either power generating or distributing companies. Power distributors as domiciliary public service providers face two types of regulation. The first one is price regulation. CREG currently sets the markup formula for distributors as well as the determining the nature of pass through to final users. With respect to the latter, CREG determines: i) direct purchase costs such as the pool sale price and transportation charges, ii) capacity charges, and iii) costs of the reserve provisions to stabilize the system and prevent bottlenecks in the transmission system.8 Price regulation at this stage differs from most
sys-tems that have moved toward electricity markets that have adopted price-cap rules. The second type of regulation concerns quality control, whereby companies are subject to sanc-tions if their service fails to meet minimum quality standards. The reform was designed to impact two types of final users.
Residential users are mainly regulated consumers. Final prices for them are set by the markup formula, which includes past inflation. The reform also introduced the figure of non-regulated users. They are large clients, mainly commercial and industrial users. The minimum consump-tion to become a large client was set in 1995 in 2 Megawatts (MW) per month likewise the parameter used in England. This lower limit was reduced to 0.5 MW in 1997. A large client might enter into a purchase agreement contract with a power distributor, wholesale retailer or generator. This implies that these large consumers can hedge against pool price volatility, a sensitive variable especially in hydro-based systems. The reforms and regulations led power holdings to undertake a generalized divestiture process across electricity holdings in order to fully separate power generation, transmission, distribution, and the setting up of new commer-cialization activities. Thus, privatization arose as one instrument for promoting market compe-tition and industry restructuring, and it became a complementary policy within a broad deregulatory context.
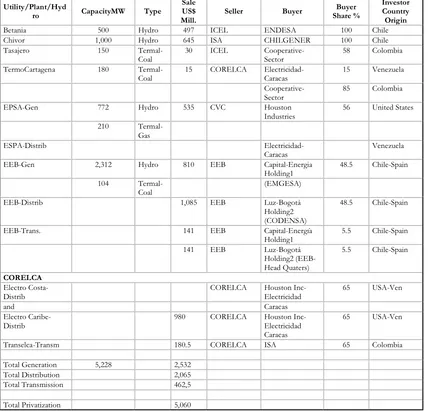
Table 1 describes the sales process in the power sector. It depicts the privatized utility, thermal plant or hydro unit, the capacity of each unit expressed in Megawatts, the sale amount in current US$, the power holding seller as well as the company buyer, and the last column it includes the buyer’s country origin. Privatization in the power sector had two phases until 1998. The first one was the 1996–1997 privatization round, which focused on the sale of thermal plants and hydroelectric stations. Sales reached US$3.9 billion. This represented a 50% transfer of overall system generating capacity. The most important transaction was the sale of
8 The last component is the analog for the Uplift component in Great Britain. For details on the Colombian and
48% of the Bogotá Power Company’s net worth, which also included the transfer of the local distribution network and the regional grid. The buyers were two holding companies owned by ENDESA and CHILECTRA, Chile’s largest power generators.
D
IAGRAM1
T
HEP
OWERM
ARKETS
TRUCTUREDistributor costs passthrough to clients
Distributors + Power Retailers - Buying and selling of electricity
- Competition + Entry (Gradual) - Mark-up approved by CREG for the regulated market
Transmission
Monopoly Grid-free access Regulated fees
National Dispatch Center
Pool Administration
GENERATION
• Entry + Competition. • Free prices
• Short-run supply competition
CLIENTS
Regulated users
Non-regulated users (0.5MW)
Operative stage
ELECTRICITY SPOT MARKET
Notes: This diagram shows the power sector structure after the regulatory reform and the relation among power activities. Non-regulated users are large clients (commercial, industrial users) whose minimum consumption is 0.5 megawatts (MW) of capacity per month. 1 MW of capacity = 1000 KWh.
Source: Interconexión Eléctrica S.A -ISA- report 1998.
privatized firms in manufacturing and power utilities in order to provide an assessment of their privatization and economic deregulation policies. In these two sectors, assets transfers accounted for 90% of the total privatization sales in the productive sector as of mid-1999.
3. C
HANGESIN PERFORMANCE OF THE PRIVATIZED POWER UTILITIESThe ex-post performance analysis in the power sector takes into account the effects of the 1994 reform on firm entry, market competition, and efficiency gains. In that sense, the analysis focuses on firm changes in means and medians of direct measures of profitability, efficiency, assets and investments, and sales of the privatized power holdings. The study sample covers the equity transfers in three out of five regional power systems where privatization took place, as described in Section 2. They are the former: i) Bogotá Power Company, ii) Cauca Valley Corpora-tion (CVC) and iii) the Corporación Regional de la Costa Atlántica (CORELCA) holding. The control group is Public Enterprises of Medellín [Empresas Públicas de Medellín (EPM)], which is a munici-pally owned company and has been traditionally the most efficient public enterprise not only in power generation and distribution but also in other services such as water and telecommunica-tions. All series since 1995 shared the assumption of the pre-reform electric holding structure in order to have comparable statistics. The dataset collects the historical financial reports for the privatized power holdings from several sources since 1983, which allowed us to replicate similar measures of profitability, efficiency, assets and investment, sales, and employment.
The performance analysis follows the approach of firm assessments used in privatization studies such as Megginson et al. (1994) and La Porta and López-de-Silanes (1999).11 Tables 2
and 3 present the main results regarding the performance effects of the regulatory reform on the power holdings. Several facts are worth mentioning. First, the reform has had a direct and positive effect on utility operating efficiency. The average cost per unit dropped 45% at con-stant prices. The mean (median) of sales to PPE rose 17% (18%), while the mean (median) sales to employees rose 20.3% (15.7%). The same happened with the operating income to employee ratio where the mean (median) increase was 63% (48%) at constant prices after the reform. Changes are significant at the 5-percent level.
There are at least three important sources of these efficiency gains. First, utilities made an effort to reduce both power losses and the under-collecting problem in distribution. This was the case for the Bogotá Power Company in particular, which drastically reduced it power loss indices from 53% in 1985 to 22% in 1996. The same trend is observed for the other privatized holdings.12 Second, the reform and privatization induced new investment in incumbent firms,
in contrast to what was observed for manufacturing. All investment rates at least doubled on average. Notice that capital stock remains unchanged, but this is not statistically significant. Total assets usually have several biases depending on the depreciation schedules. For that
rea-9 See Appendix 2 for a complete description of the power sector databases.
1 0 See Pombo (2001b) for more details. The point here is that there are two sources of power losses. One is the
T
ABLE1
P
RIVATIZATION IN THEP
OWERS
ECTOR: 1995-1998
Utility/Plant/Hyd
ro CapacityMW Type
Sale US$ Mill.
Seller Buyer Share %Buyer
Investor Country Origin
Betania 500 Hydro 497 ICEL ENDESA 100 Chile
Chivor 1,000 Hydro 645 ISA CHILGENER 100 Chile
Tasajero 150
Termal-Coal
30 ICEL Cooperative-Sector
58 Colombia
TermoCartagena 180 Termal-Coal
15 CORELCA Electricidad-Caracas
15 Venezuela
Cooperative-Sector
85 Colombia
EPSA-Gen 772 Hydro 535 CVC Houston
Industries
56 United States
210 Termal-Gas
ESPA-Distrib
Electricidad-Caracas
Venezuela
EEB-Gen 2,312 Hydro 810 EEB Capital-Energia
Holding1
48.5 Chile-Spain
104 Termal-Coal
(EMGESA)
EEB-Distrib 1,085 EEB Luz-Bogotá
Holding2 (CODENSA)
48.5 Chile-Spain
EEB-Trans. 141 EEB Capital-Energía
Holding1
5.5 Chile-Spain
141 EEB Luz-Bogotá Holding2 (EEB-Head Quaters) 5.5 Chile-Spain CORELCA Electro Costa-Distrib
CORELCA Houston Inc-Electricidad
65 USA-Ven
and Caracas
Electro Caribe-Distrib
980 CORELCA Houston Inc-Electricidad Caracas
65 USA-Ven
Transelca-Transm 180.5 CORELCA ISA 65 Colombia
Total Generation 5,228 2,532
Total Distribution 2,065
Total Transmission 462,5
Total Privatization 5,060
Notes on Table 1: This table describes the sales process in the power sector. It depicts the privatized utility, thermal plant or hydro unit, the capacity of each unit expressed in Megawatts, the sale amount in current US$, the power holding seller as well as the company buyer, and the last column it includes the buyer’s country origin. Generating capacity is expressed in megawatts (MW). One MW of capacity = 1000 KWh. Sales are in millions of current US$. EEB = Empresa de Energía de Bogota; EPSA = Empresa del Pacifico S.A (formerly CVC); CVC = Corporación Autónoma del Cauca; ICEL = Instituto Colombiano de Energía Eléctrica; CORELCA = Corporación Eléctrica de la Costa Atlántica; ISA = Interconexión Eléctrica S.A.
1: Capital Energía = ENDESA (Chile) + ENDESA-Desarrollo (Spain)
2: Luz Bogota = CHILECTRA (Chile) + ENERSIS (Chile) + ENDESA-Desarrollo (Spain)
[image:10.612.91.519.135.546.2]Variabe N Before
N After
Mean Befote Median Before
Mean After Median After
t-stat z-stat I.Profitability
Operating Income/Sales 48 20 0.3208 0.1891 -3.093ª 0.3587 0.2262 2.410b
Net Income/Sales 48 20 0.1382 0.0882 -0.693 0.1992 0.0998 0.794 Operating Income/PPE 48 20 0.0562 0.0288 -3.060ª 0.0556 0.0397 2.544b Operating Income/Net-Worth 48 20 0.0997 0.0463 -3.155ª
II.Operating efficiency
Cost per unit 48 20 0.0292 0.0207 -1.790b
0.0226 0.0194 1.561 Log (Sales/PPE) 48 20 1.2574 1.4289 3.260ª 1.2278 1.4101 -2.907ª Log (Sales/employees 48 20 2.0020 2.2035 4.469ª 2.0021 2.1578 -3.957ª Operating income/employees 48 20 112.82 183.91 4.367ª 105.54 156.68 -4.321ª
III. Labor
Log (Employees) 48 20 3.4354 3.3987 -0.4701 3.5205 3.4255 0.8080
IV. Assets and Investment
Log (PEE) 48 20 4.1807 4.1733 -0.1135
4.1513 4.1509 0.1750 Investment/salesd 48 8 0.0039 0.0066 1.9950b
0.0033 0.0063 -1.1710 Investment/employeesd 48 8 0.4869 0.8374 1.6493c
0.2721 0.6909 -1.5220 Investment/PPEd 48 8 0.0742 0.1579 3.1909ª 0.0647 0.1521 -1.9900b Log (PPE/total amployees) 48 20 0.7453 0.7746 0.4286 0.7817 0.7960 -0.2690
V. Output
Log (Sales) 48 20 5.4382 5.6023 2.5933ª
5.4771 5.6886 -2.6250ª
T
ABLE2
C
HANGES INP
ERFORMANCE: S
AMPLEOFP
RIVATIZEDP
OWERU
TILITIESANDP
UBLICE
NTERPRISESOFM
EDELLÍNNotes on Table 2: This table presents raw results for 3 privatized power holdings and Public Enterprises of Medellin. The dataset is a balanced panel by construction and the sample size (N) refers to firm-year observations for two times periods: i) before the regulatory reform a = 1983-1994 and ii) the post-reform years = 1995-1999. The maximum number of firm-year observations before the reform is 40, and 20 after the reform. The table reports for each empirical proxy the number of usable observations, the mean, and the median values before and after the sector regulatory reform (1995), and the t-stat and z-t-stat (Mann-Whitney non-parametric rank sum) as the test for significance of the change in mean and median values. Value variables before transformations in logs are in millions of pesos at 1995 prices. Definitions of each variable as well as details on Colombia’s power sector datasets and definitions can be found in Appendices 1 and 2.
son a more accurate indicator is the current investment rates. Notice that in most cases the changes in performance of operating efficiency and investment-adjusted indicators are not statistically significant with respect to their control group. The reading of such a result is that, despite efforts made by the newly privatized and divested electric holdings, these were not enough to surpass EPM’s efficiency changes.
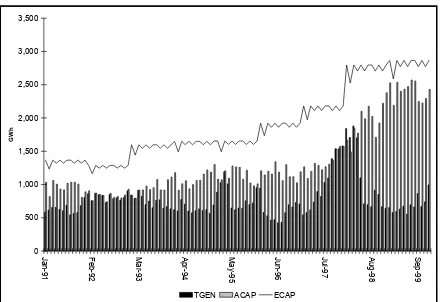
Third, employment cuts were not as significant. The four electric holdings had on average 13,300 employees before the reform. This number only decreased to 11,600 employees during the 1995–1999 period. Thus, the observed 23% real increase in labor productivity was due to the increase in sales rather than drastic employment cuts. In fact, the mean (median) of sales in-creased by 16.4% (21.1%). One must keep in mind that the 1994 reform adopted a mixed model for the provision of electricity, given the appropriate signals to private investors in undertaking long-lasting efforts. This new investment implied that firms received embodied efficiency gains. This point becomes clear with the evolution of thermal capacity as depicted in Figure 1, which clearly shows sharp increases in thermal capacity and a doubling during the 1990s.
The new regulation has used two instruments to provide incentives to market entry. One is the design of capacity charges by which the regulator guarantees a minimum return on the installed capacity. The second instrument is the power purchase agreements (PPAs). These are long-term contracts through which generators hedge against unexpected changes in demand and distributors hedge against system constraints. One type of PPA initially implemented in Colombia is to pay what is generated, which involves an advance purchase of plant capacity. Most thermal generators are marginal producers whose objective is to generate a hedge for the sys-tem. In fact, the thermal park had 63 plants with an effective capacity of 3,800 MW in 1998, which represents a 32% share. Among them 21 started commercial operations after 1993 and 16 are privately owned. This is not a coincidence since the government had already undertaken an emergency expansion plan to overcome the 1992 power generation crisis.11 Thus, fixed
in-vestment in thermal generation has played a central role in improving system reliability as well as promoting market entry in power generation.
The behavior of profitability indicators, however, did not mirror the efficiency gains. Notice the striking result that all profitability indicators, adjusted and unadjusted, dropped after the regulatory reform. The mean (median) of operating income to sales ratio was 32.1% (35.8%) before the reform for the study sample. The indicator fell to 18.9% (22.6%) during the post-reform years. Operating income to PPE or Net Worth, as indicators of firms’ profit rates of gross and net fixed assets respectively, were reduced by close to one half. The above changes are significant at the 5-percent level. The adjusted indicators show the same behavior. That is, the privatized holdings lost relative profitability with respect to their control group.
The conventional wisdom would say that any gains in input productivity must have a direct impact on firm profitability rates if and only if there are not drastic changes in market
T
ABLE3
I
NDUSTRY-A
DJUSTEDC
HANGESINP
ERFORMANCEP
RIVATIZEDP
OWERU
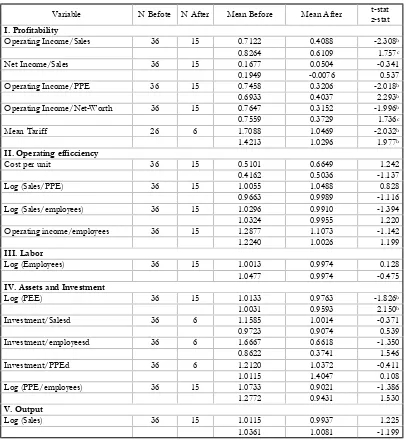
TILITIESNotes on Table 3: This table presents the industry-adjusted results for 3 privatized power holdings. Performance proxies are adjusted relative to Public Enterprises of Medellín. The dataset is a balanced panel by construction and the sample size (N) refers to firm-year observations for two times periods: i) before the regulatory reform = 1983-1994; and ii) the post-reform years = 1995-1999. The maximum number of firm-year observations before the post-reform is 36, and 15 after the reform for each adjusted variable. The table reports for each empirical proxy the number of usable observations, the mean, and the median values before and after the sector regulatory reform (1995), and the t-stat and z-stat (Mann-Whitney non-parametric rank sum) as the test for significance of the change in mean and median values. Definitions of each variable as well as details on Colombia’s power sector datasets and definitions can be found in Appendices 1 and 2 a = significant at 0.01; b = significant at 0.05; significant at 0.1; d = post-reform period = 1995–1996 due to availability of appropriate data.
Variable N Befote N After Mean Before Mean After t-stat
z-stat
I. Profitability
Operating Income/Sales 36 15 0.7122 0.4088 -2.308b
0.8264 0.6109 1.757c
Net Income/Sales 36 15 0.1677 0.0504 -0.341
0.1949 -0.0076 0.537
Operating Income/PPE 36 15 0.7458 0.3206 -2.018b
0.6933 0.4037 2.293b
Operating Income/Net-Worth 36 15 0.7647 0.3152 -1.996b
0.7559 0.3729 1.736c
Mean Tariff 26 6 1.7088 1.0469 -2.032b
1.4213 1.0296 1.977b
II. Operating efficciency
Cost per unit 36 15 0.5101 0.6649 1.242
0.4162 0.5036 -1.137
Log (Sales/PPE) 36 15 1.0055 1.0488 0.828
0.9663 0.9989 -1.116
Log (Sales/employees) 36 15 1.0296 0.9910 -1.394
1.0324 0.9955 1.220
Operating income/employees 36 15 1.2877 1.1073 -1.142
1.2240 1.0026 1.199
III. Labor
Log (Employees) 36 15 1.0013 0.9974 0.128
1.0477 0.9974 -0.475
IV. Assets and Investment
Log (PEE) 36 15 1.0133 0.9763 -1.826b
1.0031 0.9593 2.150b
Investment/Salesd 36 6 1.1585 1.0014 -0.371
0.9723 0.9074 0.539
Investment/employeesd 36 6 1.6667 0.6618 -1.350
0.8622 0.3741 1.546
Investment/PPEd 36 6 1.2120 1.0372 -0.411
1.0115 1.4047 0.108
Log (PPE/employees) 36 15 1.0733 0.9021 -1.386
1.2772 0.9431 1.530
V. Output
Log (Sales) 36 15 1.0115 0.9937 1.225
[image:13.612.95.501.130.570.2]tition. The 1994 regulatory reform implied more competition within the market in power gen-eration and distribution. First, ownership composition changed drastically within the first five years after the regulatory reform, which has induced a balanced distribution of the power
gen-F
IGURE1.
T
HERMALC
APACITY VS. G
ENERATION(GW
H)
0 500 1,000 1,500 2,000 2,500 3,000 3,500
J
an-91
F
eb-92
Ma
r-93
Apr
-94
Ma
y
-95
J
u
n-96
Ju
l-9
7
Aug-9
8
S
e
p-99
GW
h
TGEN ACAP ECAP
Notes en Figure 1: TGEN = thermal generation, ACAP = available capacity, ECAP = effective capacity. Source: Interconexión Eléctrica S.A -ISA- (1998, 1999)
erating capacity between public and private utilities. By 1998 public utilities counted for 42% of the power generating capacity while private and mixed-capital utilities held a 58% share. The largest generator has a 21% market share.12 This outcome contrasts with the initial
dives-titure in the UK where the CEGB was split into a duopoly for non-nuclear generation, and in Chile where the three largest power generators control 85% of the market.
On the power distribution side, privatized utilities dropped their final rates after 1995 and have converged to EPM’s final-user rates. The relative rate for regulated users dropped from
[image:14.612.88.528.169.471.2]1.70 to 1.04 after the reform. If one takes into account the non-regulated electricity market, the drop must be even greater. Table 4 summarizes the main variables of the wholesale electric-ity market. Two facts are noteworthy. First, the evolution of electricelectric-ity spot prices suggests that buyers—power distributors—have effectively hedged against pool price volatility. Real contract prices dropped 42% from 1996 to 2000. That outcome is important since contracts have a 75% market share in bulk electricity. Another important outcome is that market deregu-lation has sharply increased the number of non-regulated users, most of which are large indus-trial and commercial clients. In fact, the definition of “large customer” has changed over time. It began with a minimum individual consumption of 2.5 MW/month and has gradually de-creased. The current level is at 0.1 MW/month, implying that non-regulated demand doubles during the analyzed period and accounts for 25% of today’s commercial demand for electricity. There was an additional factor that contributed to narrowing gross and net utility profits. There was a sharp increase in financial costs during the first half of the 1990s. The four regional markets under study had on average a 90% real increase in their financial costs relative to the average of the 1980s. The Bogotá Power Company faced most of the indebtedness burden because of the over-costs generated by the five-year delay in the startup of the Guavio hydro-electric plant.
T
ABLE4
M
ARKETE
FFICIENCYV
ARIABLES- A
NNUALA
VERAGESDate Mean Spot Price US$/K Wh Mean PPAs Price US$/K Wh Spot price Index Dic98 =100 PPAs price IndexD ic98=10 0 Commercial Demand GWh Non Regulated Demand GWh Regulated Demand GWh Non Regulated Demand Share Non Regulated Users Number
1996 0.0084 0.0348 52.8 125.0 3,329.6 454.5 2,875.0 0.1365 11.2
1997 0.0548 0.0321 342.7 115.2 3,410.1 453.9 2,956.2 0.1336 95.3
1998 0.0374 0.0288 233.7 103.4 3,452.5 659.5 2,793.0 0.1910 678.8
1999 0.0159 0.0220 99.3 79.1 3,316.5 676.1 2,640.4 0.2038 891.6
2000 0.0204 0.0203 127.7 72.9 3,387.3 843.7 2,543.6 0.2489 2,377.0
Sources: Interconexión Eléctrica S.A (ISA) (1998, 1999) and Mercado de Energía Mayorista (MEM) requested files. Notes on Table 4: This table shows the main variables of the wholesale electricity market. The spot price indicates the pool daily prices and the PPA or purchase power agreements are forward contracts of electricity prices and dispatched quantities. Both are market prices. Final residential and small commercial users, whose price formula is set by the regulatory commission, form the regulated demand. Non-regulated users are large clients who underwrite purchase contracts with power generators and distributors. The commercial demand is equal to the sum of the regulated and non-regulated demand. The last column reports the average of large clients that are registered in the electricity market for a given year. Prices per-kilowatt is in US$ at 1998 prices. Value series were deflated by US CPI. KWh = kilowatt per hour, GWh = gigawatts per hour = 1 million of kilowatts per hour.
4. P
RODUCTIVEE
FFICIENCY OFT
HERMALP
LANTS ANDP
OWERD
ISTRIBUTIONC
OMPANIESpower losses, and to undertake new investments in power generating capacity. This section presents the measurement of productive efficiency trough DEA methodology at plant-level for a sample of thermal electricity generation plants and distribution firms. Fifty-five thermal plants belonging to the interconnected system are the thermal park since 1995. But only 32 units have been active, showing a permanent or temporary production within a specific year. Because of changes in the statistical sources, the dataset has been divided in two samples. The first sample records about 33 thermal plants from 1988–1994—that is, the pre-reform years. The second one records 32 thermal units for the post-reform years (1995–2000).
The basic intuition that one must recall in the measurement of a plant productive efficiency from DEA estimation is the following: consider a set of plants that use different combinations of inputs to produce one unit of a homogeneous output (electricity fits concept). If every plant is producing efficiently, all are in best practice isoquant. In the case that one plant is demanding more inputs in order to produce one unit of output, we are able to say that the plant is inefficient to the best practice isoquant. Data Envelope Analysis (DEA) allows us to calculate a measure of plant technical efficiency. In particular, DEA uses a sequence of linear programs to construct a transformation frontier to compute efficiency measures relative to this reference technology. Inefficiency is measured as the ratio of the radial distance from the origin to the combination of input usage in an input space and the radial distance from the origin to the frontier, which is a isoquant made up of the input combinations of the remaining group of firms which are considered efficient (i.e. pair wise input - one output in an Cartesian plane). This ratio will take a value between zero and one. If a plant has an efficiency score of 1, one says that is technically efficient. If the score is less than 1 then the plant is inefficient. For instance if plant B has a score 0.8 and plant A has a score of 1, then plant B is 20% inefficient relative to the production frontier. That is if plant B uses its inputs as plant A, then she would increase its output in 20%. The above measurement is called as non-parametric input-oriented efficiency scores.13
The measurement of the efficiency scores requires information of inputs and output for each thermal unit. Plant inputs are capital (or capacity in MW), labor (number of employees), and fuel consumption (coal, gas, fuel oil, and diesel oil). All fuels must have a common measure unit, such as BTUs or T-Calories.14 Output is given in millions of KWh (GWh). Information for
power generation, consumption by type of fuel and capacity at plant-level is available by cross-ing the different datasets before and after 1994.
Labor input is not directly observable for most units. There are two reasons for that prob-lem. One is that before privatization thermal units were vertically integrated with power utili-ties, thus payroll series were recorded following accounting criteria. Power companies kept labor records to fulfill the requirements of financial reporting. Second, there was no regulator requesting information by power activity. Labor statistics after 1996 have improved sharply since the regulator (Superintendent of Domiciliary Public Services) has been in charge of the
1 3 The literature of DEA as well as their applications is extensive. The following references provide a good
introduc-tion and reviews on the topic: Coelli, et al. (1998)andThanassoulis (2002).
1 4 BTUs stands for British thermal unit; the basic conversion factors are: 1 kWh = 3,412.1 BTUs; 1 GWh = 0.86
SIVICO database. Labor series by power company are broken down by occupational catego-ries, sectoral activities (i.e. generation, transmission, and distribution), and by type of power generation. In addition, after privatization the plants that were sold became new utilities. This allowed for making direct inferences of labor input (number of employees) by thermal substa-tions. Fixed coefficients of labor to capacity were assumed based on the information sent by power generators in order to complete labor series before 1995.15
Table 5 displays the results of the efficiency frontier measurement exercise on 42 thermal plants that were active as marginal producers before and after the 1995 regulatory reform. The first three columns depict the plant name, startup year and plant capacity in megawatts (MW). All thermal units before the reform belonged to one out of the five electric holdings in the country as described in section 2. The fourth column indicates the ownership status by the year 2000, that is if whether the thermal unit belong to a public, private or a mixed-capital electric utility. The next four columns describe the efficiency scores before and after the 1994 reform. The table presents two types of scores. The first one is the variable SCORE that uses MW of capacity as total capital input. The second one the variable SCORE1, which capacity is adjusted by its effective utilization and this is the definition of capital input used in these estimations. The reason to perform such adjustment is that most thermal units are marginal producers. The base system in Colombia is hydro. The efficiency measures are under constant return to scale assumption, that is the value of total output is equal total input spending and therefore the sum of inputs weights is equal to 1.16
The exercise provides empirical evidence regarding the post-effects of the 1994 regulatory reform for power generation. First, entry in new generating capacity took place since 1993. One must recall that Colombia was in a middle of rationing power schedule and the government undertook an emergency plan. Among the several measures one was the overhaul of the largest thermal plants in the country. The reform, as mentioned, provided incentives to expand the power generating capacity in thermal generation. The new plants that entered in the system are in bold in the table. One sees that they are among the most efficient. Their efficiency score is greater that 0.8 once capital-input is corrected by capacity utilization. The second implication is that the most efficient plants before the reform are no longer after the reform. Nonetheless, this result is smoothed if one contrasts the adjusted scores by capacity that is the SCORE1 variable. Because entrants are pushing plant efficiency meaning that they are in the production frontier.
Changes in technical efficiency are measured by a downward shift on an isoquant. In this sense, the measurements show that the best practice frontier has moved after the reform. If there were no the case one would expect no change in plant efficiency between periods. Thus, this shift in the efficiency frontier imply an efficiency gain due to entry and new gas-based and combined-cycle technologies. Entrants are more efficient relative to incumbent plants and be-came benchmark technologies. Therefore, there is a positive evidence in support that overall thermal generation was able decrease the input to output ratios.
1 5 Appendix 2 describes the methodology and the contents of the power sector databases. The request for labor
series was made through the Colombian Power Generator Association (ACOLGEN). SIVICO stands for Sistema de Vigilancia y Control.
1 6 The classical applications of DEA are under CRTS, because it is assumed that plants are operating at an optimal
4.1 E
FFICIENCYMEASUREMENTINPOWER DISTRIBUTIONThe productive efficiency in power distribution companies completes the measurement ex-ercise. Along with the assessment for thermal plants efficiency, both exercises offers a compre-hensive analysis of plant efficiency changes due to the new regulation. Efficiency measurement for power distribution through non-parametric linear programming DEA is not as straightfor-ward than power generation, regarding definitions of what really constitutes an input or output variables. There are several studies on efficiency and performance in energy distribution sys-tems. Filippini &Wild (2001), estimate econometrically cost functions for electricity distribu-tion in Switzerland. Hjalmarsson & Veiderpass (1992) use DEA technique to estimate Malmquist index measures of productivity growth. Miliotis (1992), Bagdadioglu, Waddams & Weyman (1996), and Pacudan & Guzman (2002) perform DEA analysis to asses effects of policy and ownership in efficiency for Greece, Turkey and Philippines respectively.
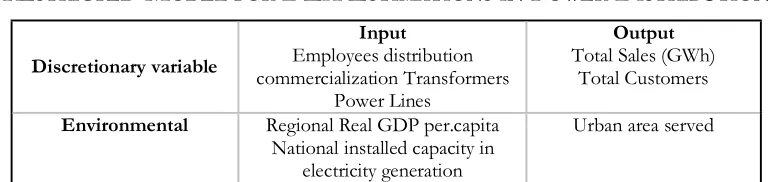
Looking for an appropriate definition of a DEA model for power distribution we have classified the variables into inputs, outputs and environmental. The dual classification in-put/output/environmental of some variables comes along with a suitable characterization of the decision-making-unit (DMU) functions, if we take transformers and distribution power lines network simply as inputs, they are variables “under” control of the utility or the DMU which is the proper name in DEA literature. Nonetheless, the decision of input demand are endogenous to environmental variables such as: extension, topography, population density, urban migration where all together will determine for instance DMU’s new investments in power lines network, substations and transformers.
Several definitions of a proper DEA model for electricity distribution can be formulated, ranging from the whole consideration of inputs/outputs/environmental variables of Table 6, to simply define as input the number of employees and output the number of customers, leav-ing the remainleav-ing variables aside or out of control of the DMU (environmental variables). Thanassoulis (2001) discusses the selection of variables and the definition of the input/out-put/environmental. In particular, he stresses that there must be some prior knowledge regard-ing DMU’s operational characteristics, with the purpose of put a weight and rank variables by their importance into the efficiency scores measures. DEA itself imposes a constraint in the formulation of a final model where multiple inputs and outputs can bring most of the DMU’s into the frontier leaving few for efficiency evaluation. Therefore, adopting a restricted model for efficiency assessment reduces the trade-off between relative efficiency and number of in-puts. Table 6 depicts the study restricted-model for a given power distribution utility input/ output/environmental variables.
The dataset collects information of 12 power distribution companies that belonged to the five electric systems in the country that cover the larger 15 urban cities in the country.17 Ten
utilities were power distributors before the 1994 reform and still as regional power distribution companies. The reminder two companies are vertically integrated utilities in power generation
T
ABLE5
T
HERMALP
LANTSDEA E
FFICIENCYS
CORESSources: Own estimations based on EMS 1.3 software written by Scheel (2000).
Notes on Table 5: All thermal units before the reform belonged to one out of the five electric holdings in the country as described in section 2. The fourth column indicates the ownership status by the year 2000, that is if whether the thermal unit belong to a public, private or a mixed-capital electric utility. The next four columns describe the efficiency scores before and after the 1994 reform. The table presents two types of scores. The first one is the variable SCORE
DMU Plant Name StartupPlant MWCap Ownership beforeScore Scoreafter Score1before Score1after RelativeEffic. RelativeEffic.1
1 Barranca 1 1982 13 Public 0.7859 0.5932 0.7859 0.7939 - +
2 Barranca 2 1982 13 Public 0.7203 0.5932 0.7448 0.7702 - +
3 Barranca 3 1972 66 Public 0.8798 0.6404 0.8798 0.8211 -
-4 Barranca 4 1983 32 Public 0.6625 0.6118 0.6625 0.8110 - +
5 Barranca 5 1983 21 Public 0.7023 0.6176 0.7023 0.8217 - +
6 Bquilla 1 1980 58 Public 0.9211 . 0.9139 .
7 Bquilla 3 1980 66 Private 1.0000 0.6624 1.0000 0.7156 - +
8 Bquilla 4 1980 69 Private 0.9699 0.7439 0.9803 1.0000 - +
9 Cartagena 1 1980 66 Private 0.8677 0.6428 1.0000 0.7447 -
-10 Cartagena 2 1980 54 Private 0.7932 0.6515 0.7437 0.8274 - +
11 Cartagena 3 1980 67 Private 0.8712 0.6815 0.8603 0.8245 -
-12 Chinu 4 1982 14 Public 0.4242 . 0.7097 .
13 Cospique 1 1960 4 Public 0.9086 . 1.0000 .
14 Cospique 2 1960 4 Public 0.7277 . 1.0000 .
15 Cospique 3 1967 8 Public 1.0000 . 0.9722 .
16 Cospique 4 1966 9 Public 1.0000 . 0.7791 .
17 Cospique 5 1965 12 Public 0.4487 . 0.8584 .
18 Flores 1 1993 152 Private 0.9881 1.0000 0.9881 1.0000 + +
19 Guajira 1 1987 160 Public 1.0000 0.8563 1.0000 0.7743 -
-20 Guajira 2 1987 160 Public 1.0000 0.8374 1.0000 0.8915 -
-21 Paipa 1 1963 31 Public 0.4048 0.4977 0.3208 0.8859 + +
22 Paipa 2 1975 74 Public 0.7307 0.3794 0.4755 0.7891 - +
23 Paipa 3 1978 74 Public 0.6331 0.4154 0.3874 0.7735 - +
24 Palenque 3-4 1972 15 Public 0.8780 0.4586 1.0000 0.8011 -
-25 Palenque 5 1985 21 Public 0.6706 . 0.6706 . . .
26 Proeléctrica 1 1993 46 Private 0.9993 0.9695 0.9993 0.8857 -
-27 Proeléctrica 2 1993 46 Private 1.0000 0.9695 1.0000 0.9654 -
-28 Tasajeo 1985 163 Private 1.000 0.6755 1.0000 0.8241 -
-29 Tibú 1 1965 6 Public 0.1669 . 0.3157
30 Tibú 2 1965 6 Public 0.1632 . 0.8026
31 Zipa 2-3 1976 104 Mixed 0.4904 0.8888 0.4213 0.6721 + +
32 ZIPA 3 1976 66 Mixed . 0.2235 . 0.8021 . .
33 Zipa 4 1981 66 Mixed 0.4626 0.1879 0.4601 0.6797 - +
34 Zipa 5 1985 66 Mixed 0.2692 0.3213 0.3042 0.8655 + +
35 Flores 2 1996 100 Private . 0.9199 . 0.9205
36 Flores 3 1998 152 Private . 1.0000 . 1.0000
37 Merilectrica 1998 157 Private . 0.7887 . 0.9273
38 Tebsa B1 1998 768 Private . 1.0000 . 0.9141
39 Termocentro 1 1997 99 Public . 0.9160 . 1.0000
40 Dorada 1 1997 52 Public . 0.2554 . 0.8010
41 Sierra 1 1998 150 Public . 0.1442 . 0.8564
42 Termovalle 1 1998 214 Private . 0.8237 . 0.8858
Total Decrease (plants) 19 12
Share Capacity 35.3% 24.6%
and distribution. On the other hand, three of these com=panies have privatized their distribu-tion network as explained in secdistribu-tion 2.18
T
ABLE6
R
ESTRICTED-M
ODELFORDEA E
STIMATIONSINP
OWERD
ISTRIBUTIONscores before and after the 1994 reform. The table presents two types of scores. The first one is the variable SCORE that uses MW of capacity as total capital input. The second one the variable SCORE1, which capacity is adjusted by its effective utilization and this is the definition of capital input used in these estimations. The reason to perform such adjustment is that most thermal units are marginal producers. In Colombia the base system is hydro. The efficiency measures are under constant return to scale assumption, that is the value of total output is equal total input spending and therefore the sum of inputs weights is equal to 1. DMU = Decision-making unit; Input1: Capacity in MW; Input2: Labor in Number of Employees; Input3: Fuels, standardized in T-Calories; Output = electricity generation in gigawatts. Periods: Before Reform 1988–1994; After Reform: 1995–2000; Input-Output variables are annual averages.
1 8 One must recall that the 1994 reform did not mandate to divest between generation and distribution. What the
reform forbids is for new enterprises to have two or more power activities, and no one must have investments in power transmission. The integrated utilities are Public Enterprises of Medellín (EPM), and Caldas Hydro Com-pany (CHEC). Regarding Bogotá Power ComCom-pany (EEB) the dataset was chained keeping the pre-reform stricture to make compatible the time series. On the other hand, the privatized distribution networks are represented for ELECTROCOSTA and ELECTRICARIBE, utilities that arose from the divestiture of CORELCA holding, and CODENSA that as explained in section 2 arose from the divestiture of EEB. For a complete description of the power sector in Colombia before the 1994 reform is in Pombo (2001).
1 9 This decomposition is originally due to Banker, Charnes and Cooper (1984).
Discretionary variable
Input
Employees distribution commercialization Transformers
Power Lines
Output
Total Sales (GWh) Total Customers
Environmental Regional Real GDP per.capita National installed capacity in
electricity generation
Urban area served
Table 7 summarizes the results of the efficiency scores of the chosen restricted-model. It also decomposes technical inefficiency into plant Variable Return to Scale (VRTS) and Scale Efficiency (SE). One must recall that the expected technology in power distribution is a fixed coefficient constant return to scale (CRTS) according to the traditional peak-load model (Steiner 1957). How-ever, this decomposition arises when one suspects that firms are not operating at an optimal scale due to power transmission, financial or other market constraints.19 In particular, it can be shown that
Technical Efficiency (CRTS) = [Pure Technical Efficiency (VRTS) x Scale Efficiency] (1) where scale efficiency < 1.
Table 7 highlights the efficiency scores across power distributors. Under the assumption of CRTS we show that six out of the twelve electricity distribution firms are totally efficient for our time span. The lowest efficiency score correspond to CHEC for 13 years and CEDELCA for 3 years. For the period under study four utilities exhibit VRTS meaning that they could reduce technical inefficiency through getting internal scale economies by means of a increase in sales,
[image:20.612.113.499.272.363.2]customers or in area served. Two utilities present serious inefficiencies in power distribution according to the scale efficiency component [CEDELCA (68.4) and Huila (86%)]. Moreover their efficiency scores worsened after the reform. These utilities show on average permanent financial and operating over-costs, high levels of non-technical losses in power distribution, and contrac-tion in their regional per-capita consumpcontrac-tion of electricity relative to the benchmark utilities.20
The next section turns to modeling efficiency and profitability as functions of plant charac-teristics, ownership structure, and regulatory policy variables for the former IFI firms and the sample of thermal plants, with the purpose of shedding light on the determinants of those performance variables.
T
ABLE7
DEA E
FFICIENCYS
CORES- P
OWERD
ISTRIBUTIONC
OMPANIESSource: Own calculations based on FEN-SIVICO datasets.
2 0 The privatization process had a sudden stop in 1999. Private investors have not been interested in the former ICEL subsidiaries (CEDELCA, CEDENAR, CENS, CHEC, ESSA, HUILA, and TOLIMA) and EMCALI due to their long-term financial, labor and pension liabilities. Sector authorities have stressed the financial problem and the call for State capitalization. On the other hand the pool’s administrator has penalized with stopping or rationing
Constant Returns to Scale
DMU 1986-1987 1988-1989 1990-1991 1992-1993 1994-1995 1996-1997 1998-1999 2000-2001
CEDELCA 0.71 0.76 0.87 0.78 0.72 0.58 0.67 0.34
CEDENAR 1.00 1.00 1.00 1.00 1.00 1.00 1.00 1.00
CENS 1.00 0.83 1.00 0.89 0.85 0.92 0.96 1.00
CHEC 0.55 0.56 0.62 0.49 0.45 0.52 0.40 0.40
EEB 1.00 1.00 1.00 1.00 1.00 1.00 1.00 1.00
ELECTRICARIBE 1.00 1.00 1.00 1.00 1.00 1.00 1.00 1.00
ELECTROCOSTA 0.91 0.96 1.00 0.97 0.98 1.00 1.00 1.00
EMCALI 1.00 1.00 1.00 1.00 1.00 1.00 1.00 1.00
EPM 1.00 1.00 1.00 1.00 1.00 1.00 1.00 1.00
ESSA 0.84 0.79 0.89 0.84 0.82 0.72 0.59 0.57
HUILA 0.91 0.72 0.92 0.83 069 0.92 0.69 0.65
TOLIMA 1.00 1.00 1.00 1.00 1.00 1.00 1.00 1.00
Variable Returns to Scale
CEDELCA 1.00 1.00 1.00 1.00 1.00 0.92 1.00 0.99
CEDENAR 1.00 1.00 1.00 1.00 1.00 1.00 1.00 1.00
CENS 1.00 1.00 1.00 1.00 1.00 1.00 1.00 1.00
CHEC 0.55 0.57 0.64 0.50 0.45 0.53 0.48 0.56
EEB 1.00 1.00 1.00 1.00 1.00 1.00 1.00 1.00
ELECTRICARIBE 1.00 1.00 1.00 1.00 1.00 1.00 1.00 1.00
ELECTROCOSTA 0.97 1.00 1.00 0.97 1.00 1.00 1.00 1.00
EMCALI 1.00 1.00 1.00 1.00 1.00 1.00 1.00 1.00
EPM 1.00 1.00 1.00 1.00 1.00 1.00 1.00 1.00
ESSA 0.86 0.79 0.89 0.84 0.82 0.73 0.61 0.66
HUILA 0.97 0.80 1.00 0.89 0.77 1.00 0.94 1.00
TOLIMA 1.00 1.00 1.00 1.00 1.00 1.00 1.00 1.00
Scale efficiency
CEDELCA 0.71 0.76 0.87 0.78 0.72 0.62 0.67 0.35
CEDENAR 1.00 1.00 1.00 1.00 1.00 1.00 1.00 1.00
CENS 1.00 0.83 1.00 0.89 0.85 0.92 0.96 1.00
CHEC 1.00 1.00 0.97 0.99 1.00 0.98 0.84 0.71
EEB 1.00 1.00 1.00 1.00 1.00 1.00 1.00 1.00
ELECTRICARIBE 1.00 1.00 1.00 1.00 1.00 1.00 1.00 1.00
ELECTROCOSTA 0.94 0.96 1.00 1.00 0.98 1.00 1.00 1.00
EMCALI 1.00 1.00 1.00 1.00 1.00 1.00 1.00 1.00
EPM 1.00 1.00 1.00 1.00 1.00 1.00 1.00 1.00
ESSA 0.98 1.00 1.00 1.00 1.00 0.99 0.96 0.87
HUILA 0.93 0.89 0.92 0.93 0.91 0.92 0.74 0.65
5. T
HERMALP
OWERP
LANTS: S
TATISTICALA
NALYSIS OFE
FFICIENCYS
CORESThis section reports the results of an econometric analysis of thermal power plant DEA efficiency scores. The exercise follows a limited dependent variable model because the depen-dent variable under analysis is censored by construction. It takes positive values and is bounded at 1.00; thus, the efficient plants will record an efficiency score −yit− of one. Otherwise,
0≤yit <1. The sample might also be truncated because there is knowledge of independent variables if only yit is observed. This is particularly important for marginal power producers
when the thermal plants are shut down by maintenance, transmission, and generation con-straints because there is no power dispatch.
The baseline censored-model follows a linear specification:
0
it it
e
y = +
it
x' B 0 1
it
y otherwise
< ≤
(2)
and the residuals are I.I.D following a normal distribution with zero mean and constant variance. Equation (2) models efficiency scores as a function of plant characteristics, ownership struc-ture, and regulatory related policy dummies. Plant characteristics include plant age, capital-labor ratio, technology type, and load factor. Controlling for the load factor indicates how marginal a given producer is.21 A dummy that takes the value of 1 for all private plants captures ownership.
The regulatory dummy tries to capture the effect of large customer definition. Thus, for each plant that dummy takes a value of one after 1998 (when the lower limit for large clients was set in 0.5 MW/month, which implied a jump from 100 to 900 non-regulated users on average). The dataset includes all observed records from each one of the 33 active thermal plants during the 1995-2000 period. Therefore, the dataset is an unbalanced panel with 166 observations.
Table 8 displays the Tobit regressions. The dependent variable in the first two equations is SCORE1, which represent plant efficiency scores measured under the assumptions of constant return to scale (CRTS), convex technology and plant generating capacity or capital input is adjusted by its effective utilization. This adjustment normalizes plant capacity by load factor, which means that all producers are treated as if they were off-peak generators. The dependent variable of the third equation is SCORE2 by which the measure of plant efficiency relaxes the assumption of CRTS. The reading of those results is as follows. First, the equations exhibit
power delivery to distributors since 2000 because of their contract indebtedness with power generators. such as CHEC with power generators since 2000. The last important transaction in the sector was EPM’s purchase of CHEC. We do not present further analysis of the financial situation of the regional power distributors because it need more research and it is beyond the scope of this paper.
2 1 The definition of load factor for this exercise is:
* (365* 24) /1000 *8.76
GWh GWh
LF
K K
high quality of fit reported by the R2 of the OLS regressions.22 In particular, the overall effect
of the plant characteristics, ownership structure, and regulatory policy dummy explain 90% of
2 2 In general, the variables included in the Tobit regressions are robust. Residuals are homoskedastic according to the
reported OLS tests. The residuals are not normal, which is associated with the distribution Kurtosis. The distribu-tion of the residuals is symmetric.
T
ABLE8
T
HERMALP
LANTSE
FFICIENCYS
CORESD
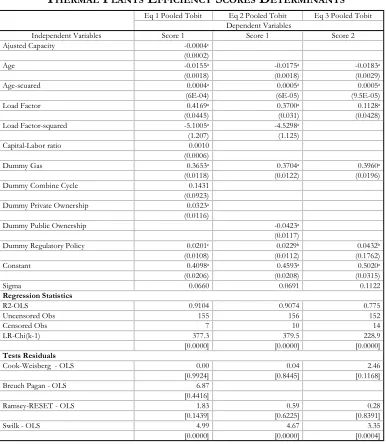
ETERMINANTSEq 1 Pooled Tobit Eq 2 Pooled Tobit Eq 3 Pooled Tobit Dependent Variables
Independent Variables Score 1 Score 1 Score 2
Ajusted Capacity -0.0004c
(0.0002)
Age -0.0155a -0.0175a -0.0183a
(0.0018) (0.0018) (0.0029)
Age-scuared 0.0004a 0.0005a 0.0005a
(6E-04) (6E-05) (9.5E-05)
Load Factor 0.4169a 0.3700a 0.1128a
(0.0445) (0.031) (0.0428)
Load Factor-squared -5.1005a -4.5298a
(1.207) (1.125)
Capital-Labor ratio 0.0010
(0.0006)
Dummy Gas 0.3653a 0.3704a 0.3960a
(0.0118) (0.0122) (0.0196)
Dummy Combine Cycle 0.1431
(0.0923) Dummy Private Ownership 0.0323a (0.0116)
Dummy Public Ownership -0.0423a
(0.0117)
Dummy Regulatory Policy 0.0201c 0.0229b 0.0432b
(0.0108) (0.0112) (0.1762)
Constant 0.4098a 0.4593a 0.5020a
(0.0206) (0.0208) (0.0315)
Sigma 0.0660 0.0691 0.1122
Regression Statistics
R2-OLS 0.9104 0.9074 0.775
Uncensored Obs 155 156 152
Censored Obs 7 10 14
LR-Chi(k-1) 377.3 379.5 228.9
[0.0000] [0.0000] [0.0000]
Tests Residuals
Cook-Weisberg - OLS 0.00 0.04 2.46
[0.9924] [0.8445] [0.1168]
Breuch Pagan - OLS 6.87
[0.4416]
Ramsey-RESET - OLS 1.83 0.59 0.28
[0.1439] [0.6225] [0.8391]
Swilk - OLS 4.99 4.67 3.35
[0.0000] [0.0000] [0.0004]
[image:23.612.112.498.153.597.2]the efficiency scores once capital input is adjusted by capacity utilization, and explains 78% when the assumption of constant returns to scale is relaxed. Second, dummy variables for technology are robust and statistically significant in all equations. This implies that new gas-based technologies improve system efficiency, since they save on fuel consumption. Entrants played a central role in this particular issue. Third, the load factor is positively related, meaning that there is an effective reduction in the power losses associated with the frequent and costly plant start-ups. However, the square of the variable is negatively related, showing that there are decreasing returns to scale at full plant capacity.
Fourth, plant age is negatively related, meaning that older plants lose relative efficiency. None-theless, there are positive learning effects that partially offset plant aging, given the behavior of the square of the age variable. For instance, the accumulated efficiency loss after 10 years is 17%, but the learning effect represents a 4.5% efficiency gain. Fifth, regulatory policy has had positive effects. The regression coefficients indicate on avreage ot the three equations an overall efficiency gain of 2.8%. Sixth, the exercise is not conclusive regarding if there are structural differences in productive efficiency due to ownership. The private ownership dummy turned out not to be sig-nificant once capital input was corrected for capacity utilization and the assumption of CRTS was relaxed (Eq. 3). This result is in line with other studies. The study of Pollit (1995) reports statisti-cally insignificant regression coefficients for his ownership dummy. Those regressions are based on a cross-sectional dataset of 768 thermal power plants for 14 countries.
6. C
ONCLUSIONSThe performance and efficiency analysis of the power sector yielded important outcomes after the 1994 sectoral reform. The general trends of electricity contract prices, the evolution of plant entry in thermal generation, and the increasing share of non-regulated users in com-mercial demand suggest that the regulatory reform has been effective in promoting market competition and system efficiency. The performance analysis shows as in the case of IFI firms that the 1994 regulatory reform and the privatization program had on one side a positive im-pact on electric utilities efficiency, but on the other a negative imim-pact on profitability.
The sources of efficiency gains are explained by market competition in power generation, the reduction of the non-technical power losses in distribution, and the new investment in thermal capacity in gas-based technologies. The measurement of efficiency scores by thermal units
rein-of variable return to scale (VRTS), convex technology and capital input is adjusted by its effective utilization. The independent variables are: (1) plant generating capacity in (MW) adjusted by utilization rates, (2) plant age, (3) plant age squared, (4) load factor, (5) the squared of load factor, (6) plant capital-labor ratio, (7) gas technology - a dummy that takes the value of one if plant technology is gas based and zero otherwise, (8) combined cycle - a dummy that takes the value of one if plant technology is gas based and zero otherwise, (9) private - a dummy that takes the value of one if plant is privately owned and zero otherwise, (10) public - a dummy that takes the value of one if plant is publicly owned and zero otherwise, and (11) regulation - a dummy that takes the value of one for the years that the definition of a large client was set to a minimum consumption of 0.5 MW per month.
forces the evidence in favor of the existence of an overall gain in system efficiency and reliability. In contrast, the results of efficiency trends across power distributors are not conclusive. The reform did not boost efficiency within the inefficient power distributors. Moreover they became less efficient after 1995. However, the efficient distributors, which are the larger utilities, remain on the best practice frontier. Financial, managerial and demand constraints seems to be the sources the inability of getting an overall efficiency gain through an industry catching up effect in power distribution. Hence, disentangle the above elements needs further research.
Regulatory policy has had positive effects on plant efficiency based on the econometric results. The increasing number of non-regulated users has led generators to offer more competitive prices in order to ensure generation on contract bases. Consistent with other studies we found no evi-dence of positive impact in efficiency due to private ownership of electric utilities. Instead, regu-lation and market reform pin down the positive change in technical efficiency across thermal units. On the other hand, the results of the reform on utilities’ profitability are opposite to the expected direction. This outcome is partially explained by industry regulatory reform that intro-duced market competition in generation. This implied to utilities to face a price cap or an upper limit that limited their capacity to get extra-profits through power generation. In fact, the wholesale electricity market in Colombia is one of the most competitive given the number of power generators relative to the in the market size. Two additional facts were pointed out. First, power holdings faced financial over costs due to the increase in their external debt service and delays in startup in some hydro units at the beginning of the 90s. Second, power distributors have decreased real tariffs to final users. This is a consequence of the existence of a non-regulated market that has introduced competition in the market of forward contracts.
R
EFERENCESArmstrong, M., S. Cowan, et al. (1997). Regulatory Reform: Economic Analysis and British Experience. Cambridge, Massachusetts, MIT Press.
Bagdadioglu, N., C. Waddams, et al. (1996). “Efficiency and Ownership in Electricity Distribution: A Non-Parametric Model of the Turkish Experience.” Energy Economics18: 1-23
Banker, R., A. Charnes, et al. (1984). “Some Models for Estimating Technical and Scale Efficiencies in Data Envelop-ment Analysis.” ManageEnvelop-ment Science 30: 1078-1092.
Charnes, A., W. Cooper, et al. (1978). “Measuring the efficiency of decision making units.” European Journal of Operational Research 2: 429-444.
Coelli, T, Rao, D S P and Battese, G (1998) An Introduction to Efficiency and Productivity Analysis, Boston, Kluwer Academic Publishers
Estanche, A. and M. Rodriguez-Pardina (1998). Light and Lightning at the End of the Public Tunnel: The Reform of the Electricity Sector in the Southern Cone. Policy Research Working Papers - World Bank: 22