Other uses, including reproduction and distribution, or selling or
licensing copies, or posting to personal, institutional or third party
websites are prohibited.
In most cases authors are permitted to post their version of the
article (e.g. in Word or Tex form) to their personal website or
institutional repository. Authors requiring further information
regarding Elsevier’s archiving and manuscript policies are
encouraged to visit:
Genetic deficiency of apolipoprotein D in the mouse is
associated with nonfasting hypertriglyceridemia
and hyperinsulinemia
Margarita Jiménez-Palomares
a, Irene Cózar-Castellano
a, María Dolores Ganfornina
b,
Diego Sánchez
b,⁎
, Germán Perdomo
a,⁎
a
Hospital Universitario Puerta del Mar, Unidad de Investigación, Cádiz, Spain
bInstituto de Biología y Genética Molecular-Departamento de Bioquímica y Biología Molecular y Fisiología,
Universidad de Valladolid-CSIC, Valladolid, Spain
A R T I C L E I N F O A B S T R A C T
Article history:
Received 12 January 2011 Accepted 26 April 2011
Apolipoprotein D (ApoD) is an atypical apolipoprotein with an incompletely understood function in the regulation of triglyceride and glucose metabolism. We have demonstrated that elevated ApoD production in mice results in improved postprandial triglyceride clearance. This work studies the role of ApoD deficiency in the regulation of triglyceride and glucose metabolism and its dependence on aging. We used ApoD knockout (ApoD-KO) mice of 3 and 21 months of age. Body weight and food intake were measured. Hepatic histology, triglyceride content, lipoprotein lipase levels, and plasma metabolites were studied. Phenotypic characterization of glucose metabolism was performed using glucose
tolerance test. β-Cell mass, islet volume, and islet number were analyzed by
histomorphometry. Apolipoprotein D deficiency results in nonfasting hypertriglyceridemia
in young (P= .01) and aged mice (P= .002). In young ApoD-KO mice, hypertriglyceridemia was
associated with 30% to 50% increased food intake in nonfasting and fasting conditions, respectively, without changes in body weight. In addition, lipoprotein lipase levels were
reduced by 35% in adipose tissue (P= .006). In aged ApoD-KO mice, hypertriglyceridemia was
not associated with changes in food intake or body weight, whereas hepatic triglyceride
levels were reduced by 35% (P= .02). Furthermore, nonfasting plasma insulin levels were
elevated by 2-fold in young (P= .016) and aged (P= .004) ApoD-KO mice, without changes in
blood glucose levels, glucose tolerance, β-cell mass, or islet number. These findings
underscore the importance of ApoD in the regulation of plasma insulin levels and triglyceride metabolism, suggesting that ApoD plays an important role in the pathogenesis of dyslipidemia.
© 2011 Elsevier Inc. All rights reserved.
Author contributions: The experiments were performed at the laboratories of DS, MDG, GP, and IC. GP, DS, and IC participated in the conception, design, analysis, and interpretation of the data. GP wrote the manuscript; and DS, IC, and MDG revised it critically for important intellectual content. MJP and MDG participated in the collection, analysis, and interpretation of the data. All authors approved the final version of the manuscript.
⁎Corresponding authors.Diego Sánchez is to be contacted at Instituto de Biología y Genética Molecular, c/Sanz y Forés s/n, Universidad de Valladolid-CSIC, 47003 Valladolid, Spain. Tel.: +34 983 184 814; fax: +34 983 184 800. Germán Perdomo, Hospital Universitario Puerta del Mar, Planta 9 Unidad de Investigación, 11009 Cádiz, Spain. Tel.: +34 956 245 008; fax: +34 956 002 347.
E-mail addresses:[email protected](D. Sánchez),[email protected](G. Perdomo).
0026-0495/$–see front matter © 2011 Elsevier Inc. All rights reserved.
doi:10.1016/j.metabol.2011.04.013
A v a i l a b l e a t w w w . s c i e n c e d i r e c t . c o m
1.
Introduction
Apolipoprotein D (ApoD) is a lipocalin widely expressed in mammalian tissues and known to bind a series of hydropho-bic ligands in vitro with high affinity (pregnenolone,
proges-terone, and arachidonic acid)[1-3]as well as cholesterol with
very low affinity[4]. The expression of ApoD is prominent in
the nervous system, particularly upon aging or induced damage. We have shown that it exerts protective roles in both situations: by controlling the levels of brain peroxidated
lipids in a model of accelerated aging by oxidative insult[5], or
by controlling the extent and duration of inflammatory
processes after peripheral nerve injury [6], influencing this
way the rate of nerve regeneration.
Curiously, ApoD was simultaneously discovered in the human breast cyst fluid and as an apolipoprotein present in high-density lipoproteins (HDLs) and to a lesser extent in very
low-density lipoproteins (VLDLs)[7,8]. Apolipoprotein D is an
atypical apolipoprotein, unrelated to other apolipoproteins in
both structure and evolutionary origins[9]. Because ApoD is
mainly located in HDLs, it was soon proposed to have a role in
lipid homeostasis[10].
TheDrosophilagenome contains 2 lipocalin homologues of vertebrate ApoD, glial Lazarillo (GLaz), and neural Lazarillo (NLaz), mainly expressed in glia and neurons,
respectively [11,12]. Genetic ablation of GLaz or NLaz
reduces total triglyceride (TG) content and resistance to
starvation in young flies [11,12], whereas aging is
accom-panied by neutral fats accumulation in NLaz-deficient flies
[13]. In contrast, overexpression of NLaz increases total TG
content and resistance to starvation [11]. In addition to its
role in the regulation of lipid metabolism, NLaz mutants exhibit low glucose levels, whereas flies overexpressing
NLaz show elevated glucose levels [11]. Taken together,
these studies illustrate that the Drosophila ApoD
homo-logues GLaz and NLaz play a role in the regulation of lipid and glucose metabolism besides their roles in nervous system physiology.
To gain insights into the role of ApoD in the regulation of lipid metabolism in a vertebrate model organism, we have previously used a gain-of-function approach to overexpress ApoD in mouse. Elevated ApoD production in the liver of young mice results in enhanced lipoprotein lipase (LPL) activity and improved postprandial TG clearance, whereas
VLDL-TG production remained unchanged [14]. However,
brain overexpression of human ApoD in middle-aged mice results in hepatic steatosis, despite normal lipid concentra-tion in circulaconcentra-tion, glucose intolerance, and insulin resistance
[15]. Finally, epidemiological studies in humans associate
ApoD genetic variants with elevated plasma TG levels[16,17];
and theTaqI polymorphism of the APOD gene is associated
with the development of obesity, insulin resistance,
hyper-insulinemia, and type 2 diabetes mellitus[18,19].
Thus, the precise role of mammalian ApoD in the regulation of lipid metabolism has only recently started to be addressed; and to fully understand the role of ApoD in TG metabolism, an analysis of the loss-of-function mouse model is required. In this study, we hypothesized that a loss of ApoD would increase plasma TG levels, contributing to the
patho-genesis of dyslipidemia. To address this hypothesis, we evaluated the impact of losing ApoD on TG metabolism in young and aged ApoD-deficient mice (ApoD knockout [KO]). Here we show that genetic ablation of ApoD results in hypertriglyceridemia and hyperinsulinemia in nonfasting conditions. These findings underscore the importance of ApoD in the regulation of TG metabolism and in insulin-dependent processes.
2.
Methods
2.1. Ethical approval
Experimental procedures were approved by the Animal Care and Use Committee of the University of Valladolid in
accordance with theGuidelines for the Care and Use of Mammals
in Research (European Commission Directive 86/609/CEE and Spanish Royal Decree 1201/2005).
2.2. Experimental animals
Wild-type (WT) and ApoD-KO mice were bred at the animal facility of the University of Valladolid, Spain. Apolipoprotein
D–KO mice were generated and genotyped as previously
described [5]. Mice were fed standard rodent chow and
water ad libitum in ventilation-controlled cages in a 12-hour light/dark cycle. The experimental cohorts used in this study were males of the F1 generation of homozygous
crosses. The parental generation was composed of ApoD−/−
and ApoD+/+ littermates from heterozygous crosses of the ApoD-KO line in C57BL/6 background. This strategy avoids the potential maternal effects of ApoD and generates WT and ApoD-KO cohorts with a homogeneous genetic back-ground. Two independent cohorts were used for the collection of tissues at 2 ages: 3 months (n = 10/genotype) and 21 months old (n = 11/genotype).
2.3. Plasma biochemistry
Blood samples were obtained from mice under fasting conditions (16 hours) or under nonfasting conditions (animals had free access to food pellets ad libitum for 48 hours after the fasting period). This paradigm compares fasting vs nonfasting conditions because the exact timing of food intake with respect to sample collection is not determined. Blood was collected from the tail vein into capillary tubes precoated with potassium-EDTA (Sarstedt, Nümbrecht, Germany) for the preparation of plasma. Blood glucose levels were determined using a Glucometer Xceed (Abbott Diabetes Care, Oxon, United Kingdom). Plasma TG and cholesterol levels were determined using the Wako TG and cholesterol reagents (Wako Chemi-cals, Neuss, Germany). Plasma insulin levels were measured using ultrasensitive mouse enzyme-linked immunosorbent assay (ALPCO Diagnostics, Salem, NH).
2.4. Food intake
After the 16-hour fasting period, food pellets (50 g) were added to each cage; and food intake of each mouse was estimated from the difference in remaining food weight at 24 and 48 hours. These weights were averaged to provide an estimate of the mean food intake of each genotype in the 48-hour period following fasting.
2.5. Glucose tolerance test and insulin sensitivity index
Mice were fasted for 16 hours and injected intraperitoneally with glucose at 2 g/kg of body weight. Blood glucose levels were determined and plotted as a function of time. Insulin sensitivity index (ISI) was calculated using the formula ISI = 2/[(INS × GLU) + 1], where INS is fasting plasma insulin levels and GLU is fasting blood glucose levels with values converted to picomoles per liter and millimoles per liter,
respectively [20].
2.6. Hepatic TG determination and liver histology
Hepatic TG determination was performed as previously
described [14]. For liver histology, standard paraffin and
cryostat sections were performed after fixation in 4%
paraformaldehyde as previously described [6]. Oil red O
staining was performed on 10-μm cryostat sections using
isopropanol as diluent. Hematoxylin-eosin staining was
performed on 3-μm paraffin sections following standard
procedures[6].
2.7. Determination of islet mass and
islet histomorphometry
Pancreata were excised, fixed, sectioned, and stained with insulin; and quantitative islet histomorphometry was
per-formed as previously described[21].
2.8. Immunoblot analysis
To determine the effect of ApoD deficiency on LPL protein expression, epididymal fat tissue was collected from experimental and control mice. Cell extracts were obtained in lysis buffer (Cell Lysis Buffer; Cell Signaling, Beverly, MA) supplemented with protease inhibitors (Protease Inhibitor Cocktail; Sigma, St Louis, MO). Solubilized
pro-teins (20 μg per lane) were separated by sodium dodecyl
sulfate polyacrylamide gel electrophoresis and electrotrans-ferred onto polyvinylidene difluoride membranes for con-ventional immunoblotting. After probing with LPL-specific antibody (1:1000; Santa Cruz Biotechnology, Heidelberg, Germany), the membranes were stripped and reprobed
with antibody against β-actin (1:5000; Sigma).
Chemilumi-nescence signals (ECL Plus detection system; Amersham Biosciences, Piscataway, NJ) were detected in the linear range for quantification purposes.
2.9. Statistical analysis
Statistical analyses of data were performed by Studentttest
and by analysis of variance. Data were expressed as mean ±
SD.Pvalues < .05 were considered significant.
3.
Results
3.1. Effect of ApoD deficiency on TG metabolism in mice
We reported that elevated ApoD production resulted in
significant reduction in plasma TG levels in mice[14]. Here,
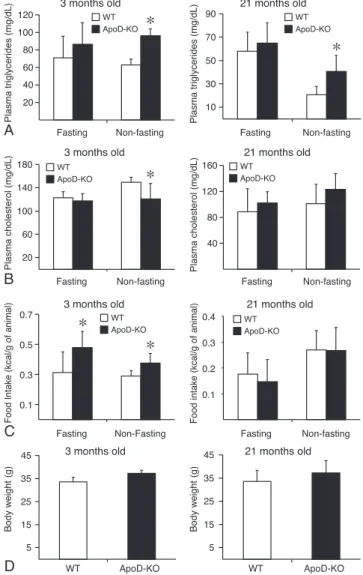
we determined the impact of ApoD on TG metabolism in the ApoD-KO mice. When compared with control, nonfasting ApoD-KO mice exhibited significantly increased TG levels at 3
and 21 months of age (Fig. 1A). In contrast, fasting plasma TG
levels remained unchanged (Fig. 1A). Whereas ApoD
deficien-cy reduced plasma cholesterol levels in ApoD-KO mice at 3 months of age, this reduction was not observed at 21 months
of age (Fig. 1B). In addition, ApoD deficiency resulted in a
significantly increased food intake at 3 months of age (Fig. 1C)
without differences in body weight (Fig. 1D). However, food
20 40 60 80 100 120 Fasting Non-fasting
Plasma triglycerides (mg/dL)
WT ApoD-KO
*
10 30 50 70 90 Fasting Non-fastingPlasma triglycerides (mg/dL)
*
3 months old 21 months old
20 60 100 140 180 Fasting Non-fasting
Plasma cholesterol (mg/dL)
*
40 80 120 160 Fasting Non-fastingPlasma cholesterol (mg/dL)
0.1 0.3 0.5 0.7
Fasting Non-Fasting
Food Intake (kcal/g of animal)
*
*
0.1 0.2 0.3 0.4 Fasting Non-fastingFood intake (kcal/g of animal)
5 15 25 35 45 WT ApoD-KO Body w e ight (g) 5 15 25 35 45 WT ApoD-KO Body w e ight (g)
A
B
C
D
3 months old 21 months old
3 months old 21 months old
3 months old 21 months old
WT ApoD-KO WT ApoD-KO WT ApoD-KO WT ApoD-KO WT ApoD-KO
intake and body weight at 21 months remained unchanged (Fig. 1C-D).
To investigate the potential effect of ApoD deficiency on hepatic fat metabolism, we determined hepatic TG content. When compared with control mice, ApoD-KO mice exhibited a trend (16% reduction) in hepatic TG content at 3 months of age (however, differences did not reach statistical significance; data not shown). In contrast, hepatic TG content was significantly reduced by 35% in ApoD-KO mice at 21 months
of age compared with control mice (Fig. 2A). To confirm these
findings, liver tissues from both ApoD-KO and control groups were stained with oil red O. Histological examination of liver sections revealed significant differences in hepatic TG content
in ApoD-KO and control mice at 21 months of age (Fig. 2B).
To investigate the mechanism by which ApoD deficiency is associated with nonfasting hypertriglyceridemia, we analyzed the expression level of LPL, a key enzyme in the hydrolysis and clearance of TG-rich particles, in peripheral tissues of young
mice. As shown inFig. 3, LPL levels in adipose tissue from
young mice were reduced by 30% to 40% in ApoD-KO mice compared with WT control animals. These results shed light on the mechanism by which ApoD deficiency is associated with nonfasting hypertriglyceridemia and spur the hypothesis that ApoD deficiency reduces TG clearance through decreased LPL activity.
3.2. Effect of ApoD deficiency on glucose metabolism in mice
Elevated serum TGs are often associated with insulin
resis-tance in rodents and humans[22]. To investigate the effect of
ApoD deficiency on glucose metabolism, we determined blood glucose and insulin levels in ApoD-KO and control mice. When compared with control, ApoD-KO mice exhibited
similar fasting and nonfasting blood glucose levels (Fig. 4A).
However, nonfasting plasma insulin levels were significantly
elevated in ApoD-KO mice (Fig. 4B). To evaluate the impact of
ApoD deficiency on whole-body glucose disposal rates,
glucose tolerance tests were performed. As shown inFig. 4C,
similar glucose profiles were observed in ApoD-KO and control mice in response to intraperitoneal glucose infusion. However, ApoD-KO mice show a trend to increase insulin release during the glucose tolerance test, although this trend did not achieve statistical significance (data not shown). Based
on fasting blood glucose and plasma insulin levels, we
calculated the ISI. As shown in Fig. 4D, ApoD-KO mice
exhibited similar ISI regardless of age. However, ApoD-KO mice at 3 and 21 months of age were associated with increased
nonfasting insulin to glucose ratio (Fig. 4E), suggesting that
ApoD deficiency is associated with inappropriate hyperinsu-linemia to maintain normoglycemia in nonfasting conditions. Insulin resistance usually precedes the development of glucose intolerance and type 2 diabetes mellitus. Before this happens, the pancreas compensates for insulin resistance by
increasing insulin secretion sustaining normoglycemia.β-Cell
compensation can be accomplishing by increasingβ-cell mass
or enhancing cellular secretory capacity. To investigate why an ApoD deficiency leads to hyperinsulinemia, we performed
a histomorphometric analysis ofβ-cell mass in ApoD-KO and
control mice. As shown in Fig.5, pancreaticβ-cell mass (A-D
and C), islet volume (B), and islet number (D) were not significantly different between ApoD-KO and control mice. These findings suggest that the hyperinsulinemia observed in Fig. 2–Hepatic TG content. Mice were killed at 21 months of age. A, Frozen liver tissues (20 mg) were used to quantify hepatic TG content in ApoD-KO and WT mice. B, Cryostat sections of livers stained with oil red O and counterstained with hematoxylin. Calibration bar: 50μm. *P< .05 vs control.
nonfasting ApoD-KO mice was not due toβ-cell mass changes
or growth, but related toβ-cell function.
4.
Discussion
In this study, we hypothesized that ApoD deficiency would increase plasma TG levels and could contribute to the pathogenesis of dyslipidemia. To contrast this hypothesis, we tested whether mice lacking ApoD gene have elevated plasma TG levels. We show that ApoD deficiency is associated with hypertriglyceridemia and decreased LPL protein levels in adipose tissue in nonfasting conditions. Consistently, we previously showed that elevated ApoD production was associated with increased LPL activity in mice, contributing
to improved postprandial TG clearance[14]. In parallel with
these results, epidemiological studies in African populations have identified 3 missense mutations (namely, Phe36Val,
Tyr108Cys, and Thr158Lys) in the ApoD gene associated with
significantly elevated plasma TG levels [16,17]. In addition,
plasma ApoD levels are significantly lower in patients with
hyperchylomicronemia [23]. Taken together, these findings
demonstrate a role for ApoD in the regulation of TG metabolism and suggest that ApoD deficiency contributes to the pathogenesis of dyslipidemia.
Interestingly, hypertriglyceridemia was not accompanied by hepatic accumulation of TGs in nonfasting ApoD-KO mice. At first inspection, the effect of ApoD deficiency, promoting hypertriglyceridemia and reducing hepatic TG levels, might seem be contradictory. There are several possible explana-tions. First, ApoD deficiency may enhance hepatic VLDL-TG secretion, which would explain the reduced hepatic TG levels and hypertriglyceridemia in nonfasting conditions. Second, ApoD deficiency may increase fatty acid oxidation, which would reduce hepatic TG levels. Third, ApoD deficiency may
decrease hepatic “de novo” fatty acid biosynthesis and/or
esterification of exogenous fatty acids. Although the precise effect of ApoD deficiency on hepatic lipid metabolism needs further investigation, these possibilities may explain, at least in part, the observed reduced hepatic TG levels.
Apolipoprotein D regulation in response to fat load has not been extensively studied. In support of this notion, we showed that elevated plasma ApoD levels in diet-induced obese mice were associated with reduced body weight and fat pad mass
[14]. Here, we show an age-dependent effect of ApoD
deficiency on food intake and body weight. Three-month-old ApoD-KO mice show augmented food intake without an increase in body weight. Thus, our results are consistent with the hypothesis that ApoD regulates body weight and energy homeostasis by a potential mechanism that would implicate enhanced energy expenditure.
In addition to its effect on TG metabolism, young ApoD-KO mice have reduced nonfasting plasma cholesterol levels compared with WT mice, sustaining the concept that ApoD regulates cholesterol metabolism in mice. Supporting such a role, we have previously shown that hepatic overexpression of
ApoD decreased plasma cholesterol levels in mice [14].
Interestingly, the effect of ApoD deficiency on cholesterol metabolism was lost with aging. It is plausible that other apolipoproteins involved in cholesterol regulation such as apolipoprotein A-I compensate for a deficit in ApoD during aging. Nonetheless, the role of ApoD in the regulation of cholesterol metabolism remains to be deciphered; and further work is warranted.
Also in the context of lipid metabolism, Do Carmo et al[15]
reported that transgenic mice overexpressing human ApoD show hepatic steatosis with normal plasma TG levels. The discrepancies in the transgenic mouse phenotypes observed could be explained by the different methodological ap-proaches used in both studies. First, 2 different gain-of-function paradigms (chronic overexpression in transgenic mice vs acute overexpression using adenoviral vectors) were used. Second, mouse and human ApoD complementary DNA was used to overexpress ApoD in mice. Although human ApoD and mouse ApoD present a high degree of similarity in their sequences, there are some structural differences that may be of importance to explain the phenotypes. Mouse ApoD lacks Cys116, a residue involved in the intermolecular WT
ApoD-KO
3 months old 21 months old
A
B
C
D
40 80 120 160 200 Fasting Non-fasting Plasma glucose (mg/dL) 40 80 120 160 200 Fasting Non-fasting Plasma glucose (mg/dL) Plasma insulin (ng/mL) Plasma insulin (ng/mL) 100 200 300 4000 20 40 60 120
Time (min) Blood glucose (mg/dL) ApoD-KO WT 100 200 300 400
0 20 40 60 120
Time (min) Blood glucose (mg/dL) 0.005 0.010 0.015
3 months 21 months
Insulin sensitivity index
10 20 30 40
3 months 21 months
Ratio non-fasti
n
g
Insulin/Glucose
*
*
3 months old 21 months old
3 months old 21 months old
WT ApoD-KO
E
WT ApoD-KO 0.5 1.0 1.5 2.0 2.5 3.0 Fasting Non-fasting*
0.5 1.0 1.5 2.0 2.5 3.0 3.5*
Fasting Non-fasting WT ApoD-KO WT ApoD-KO ApoD-KO WT WT ApoD-KOcovalent cross-link with Cys6 of apolipoprotein A-II within
HDL particles [24]. Finally, ApoD was overexpressed in
different tissues. Do Carmo et al[15]expressed human ApoD
under the control of neuron specific promoters, whereas we overexpressed mouse ApoD under the control of
cytomegalo-virus (CMV) promoter in liver[14]. In summary, further work
using transgenic and knockout tissue-specific mouse models is warranted to decipher the tissue-specific contribution of ApoD on the regulation of TG metabolism.
Finally, the 2 ApoD homologues inDrosophila, NLaz and
GLaz, also regulate total TG content and neutral fat storage. Total TG content is decreased in the absence of NLaz and GLaz, whereas overexpression of NLaz increases total TG
content in young flies[11,12]. Curiously, whereas reduction of
neutral fats is maintained through aging in GLaz mutants,
aged flies lacking NLaz in fact accumulate fat[13].
Lipocalins are emerging also as significant players in the regulation of systemic insulin action and glucose metabolism. The lipocalin retinol-binding protein 4 (RBP4) and lipocalin-2 are elevated in obese humans, correlating with lower insulin
sensitivity [25,26]. Likewise, circulating concentrations of
RBP4 and lipocalin-2 are elevated in obese mice [26,27].
Transgenic overexpression of RBP4 in normal mice decreases insulin sensitivity, whereas genetic ablation of RBP4
im-proved insulin sensitivity[28]. Our findings suggest that the
lipocalin ApoD may play a role in the regulation of systemic insulin action and glucose metabolism. This hypothesis is strengthened by epidemiological studies that demonstrate a
linkage betweenTaqI polymorphism of the ApoD gene and
insulin resistance, hyperinsulinemia, obesity, and type 2
diabetes mellitus [18,19,29] and that circulating
concentra-tions of ApoD are reduced in obese mice[14]. InDrosophila, the
genetic ablation of NLaz decreased glycogen and glucose levels, whereas transgenic overexpression increased glucose levels. Furthermore, NLaz function antagonizes the insulin/ IGF signaling pathway and is critical for the regulation of
metabolic adaptations to stress [11]. In rodents, transgenic
overexpression of ApoD in mice is associated with normal nonfasting blood glucose levels, hyperinsulinemia, and
glucose intolerance[15]. In this study, we show that
nonfast-ing ApoD-KO mice exhibit elevated TG levels associated with hyperinsulinemia and normoglycemia. The higher insulin levels and insulin to glucose ratio in ApoD-KO mice suggest that they are insulin resistant. Noteworthy, ApoD-KO and WT mice exhibited similar glucose tolerance. Thus, in our model system, a more sophisticated and sensitive technique, such as the hyperinsulinemic-euglycemic glucose clamp, should be used to quantify insulin sensitivity. Interestingly, hyper-triglyceridemia under nonfasting conditions is usually a characteristic associated with the development of insulin
resistance[30].
The fact that hyperinsulinemia in ApoD-KO mice is not
accompanied by hypoglycemia may indicate a pancreaticβ
-cell compensatory mechanism to overcome insulin resis-tance. However, the observed hyperinsulinemia was not
accompanied by changes in islet morphology, total β-cell
mass, β-cell volume, or islet number, suggesting that ApoD
deficiency does not alterβ-cell growth. Taken together, these
results suggest a role of ApoD in the pathogenesis of insulin resistance; and further research is needed to decipher the potential role of ApoD deficiency in insulin resistance.
In conclusion, our results suggest that altered plasma ApoD levels link abnormalities in the regulation of plasma insulin levels and lipoprotein metabolism with the pathogen-esis of dyslipidemia.
Funding
This work was supported by grants from the Carlos III Health Institute (CP08/00106), the Spanish Ministry of Science and Innovation (SAF2009-11282), and the FP7-PEOPLE-2009-RG (PIRG06-GA-2009-256369) to GP; grant from the Spanish Ministry of Science and Innovation (BFU2008-01170) to MDG and DS; and grants from the Carlos III Health Institute (PS09/ 00671) and the FP7-PEOPLE-2009-RG (IRG247835) to IC. MJP was supported by the Carlos III Health Institute (Spain).
Acknowledgment
We thank E Martin for technical assistance in the collection and processing of samples. We thank Dr Henry Dong for critical reading of the manuscript. We also thank our colleagues in the laboratory, N García-Mateo and R Bajo-Grañeras, for help in the collection of samples and for their stimulating discussions.
Conflict of Interest
The authors reported no potential conflict of interest.
R E F E R E N C E S
[1] Dilley WG, Haagensen DE, Cox CE, Wells Jr SA. Immunologic and steroid binding properties of the GCDFP-24 protein isolated from human breast gross cystic disease fluid. Breast Cancer Res Treat 1990;16:253-60.
[2] Morais Cabral JH, Atkins GL, Sanchez LM, Lopez-Boado YS, Lopez-Otin C, Sawyer L. Arachidonic acid binds to apolipoprotein D: implications for the protein's function. FEBS Lett 1995;366:53-6.
[3] Vogt M, Skerra A. Bacterially produced apolipoprotein D binds progesterone and arachidonic acid, but not bilirubin or E-3M2H. J Mol Recognit 2001;14:79-86.
[4] Patel RC, Lange D, McConathy WJ, Patel YC, Patel SC. Probing the structure of the ligand binding cavity of lipocalins by fluorescence spectroscopy. Protein Eng 1997;10: 621-5.
[5] Ganfornina MD, Do Carmo S, Lora JM, Torres-Schumann S, Vogel M, Allhorn M, et al. Apolipoprotein D is involved in the mechanisms regulating protection from oxidative stress. Aging Cell 2008;7:506-15.
[6] Ganfornina MD, Do Carmo S, Martinez E, Tolivia J, Navarro A, Rassart E, et al. Apod, a glia-derived apolipoprotein, is required for peripheral nerve functional integrity and a timely response to injury. Glia 2010;58:1320-34.
[7] McConathy WJ, Alaupovic P. Isolation and partial charac-terization of apolipoprotein D: a new protein moiety of the
human plasma lipoprotein system. FEBS Lett 1973;37: 178-82.
[8] Pearlman WH, Gueriguian JL, Sawyer ME. A specific
progesterone-binding component of human breast cyst fluid. J Biol Chem 1973;248:5736-41.
[9] Ganfornina MD, Gutierrez G, Bastiani M, Sanchez D. A phylogenetic analysis of the lipocalin protein family. Mol Biol Evol 2000;17:114-26.
[10] Drayna D, Fielding C, McLean J, Baer B, Castro G, Chen E, Comstock L, Henzel W, Kohr W, Rhee L, et al. Cloning and expression of human apolipoprotein D cDNA. J Biol Chem 1986;261:16535-9.
[11] Hull-Thompson J, Muffat J, Sanchez D, Walker DW, Benzer S, Ganfornina MD, et al. Control of metabolic homeostasis by stress signaling is mediated by the
lipocalin NLaz. PLoS Genet 2009;5:e1000460, doi:10.1371/
journal.pgen.1000460.
[12] Sanchez D, Lopez-Arias B, Torroja L, Canal I, Wang X, Bastiani MJ, et al. Loss of glial Lazarillo, a homolog of apolipoprotein D, reduces lifespan and stress resistance in drosophila. Curr Biol 2006;16:680-6.
[13] Ruiz M, Sanchez D, Canal I, Acebes A, Ganfornina MD. Sex-dependent modulation of longevity by two drosophila homologues of human apolipoprotein D, GLaz and NLaz. Exp Gerontol, doi:S0531-5565(11)00064-7 [pii] 10.1016/j.
exger.2011.02.014
[14] Perdomo G, Kim DH, Zhang T, Qu S, Thomas EA, Toledo FG, et al. A role of apolipoprotein D in triglyceride metabolism. J Lipid Res 2010;51:1298-311.
[15] Do Carmo S, Fournier D, Mounier C, Rassart E. Human apolipoprotein D overexpression in transgenic mice induces insulin resistance and alters lipid metabolism. Am J Physiol Endocrinol Metab 2009;296:E802-11.
[16] Desai PP, Bunker CH, Ukoli FA, Kamboh MI. Genetic variation in the apolipoprotein D gene among African blacks and its significance in lipid metabolism. Atherosclerosis 2002;163: 329-38.
[17] Kamboh MI, Albers JJ, Majumder PP, Ferrell RE. Genetic studies of human apolipoproteins. IX. Apolipoprotein D polymorphism and its relation to serum lipoprotein lipid levels. Am J Hum Genet 1989;45:147-54.
[18] Baker WA, Hitman GA, Hawrami K, McCarthy MI, Riikonen A, Tuomilehto-Wolf E, Nissinen A, Tuomilehto J, Mohan V, Viswanathan M, et al. Apolipoprotein D gene
polymorphism: a new genetic marker for type 2 diabetic subjects in Nauru and South India. Diabet Med 1994;11: 947-52.
[19] Vijayaraghavan S, Hitman GA, Kopelman PG.
Apolipoprotein-D polymorphism: a genetic marker for obesity and hyperinsulinemia. J Clin Endocrinol Metab 1994;79:568-70.
[20] Karpe F, Fielding BA, Ilic V, Macdonald IA, Summers LK, Frayn KN. Impaired postprandial adipose tissue blood flow response is related to aspects of insulin sensitivity. Diabetes 2002;51:2467-73.
[21] Cozar-Castellano I, Weinstock M, Haught M,
Velazquez-Garcia S, Sipula D, Stewart AF. Evaluation of beta-cell replication in mice transgenic for hepatocyte growth factor and placental lactogen: comprehensive
characterization of the g1/s regulatory proteins reveals unique involvement of p21cip. Diabetes 2006;55:70-7. [22] Reaven GM. Insulin resistance, hyperinsulinemia,
hypertriglyceridemia, and hypertension. Parallels between human disease and rodent models. Diabetes Care 1991;14: 195-202.
[23] Curry MD, McConathy WJ, Alaupovic P. Quantitative determination of human apolipoprotein D by
[24] Perdomo G, Henry Dong H. Apolipoprotein D in lipid metabolism and its functional implication in atherosclerosis and aging. Aging (Albany NY) 2009;1:17-27.
[25] Graham TE, Yang Q, Bluher M, Hammarstedt A, Ciaraldi TP, Henry RR, et al. Retinol-binding protein 4 and insulin resistance in lean, obese, and diabetic subjects. N Engl J Med 2006;354:2552-63.
[26] Wang Y, Lam KS, Kraegen EW, Sweeney G, Zhang J, Tso AW, et al. Lipocalin-2 is an inflammatory marker closely associated with obesity, insulin resistance, and hyperglycemia in humans. Clin Chem 2007;53:34-41.
[27] Mody N, Graham TE, Tsuji Y, Yang Q, Kahn BB. Decreased clearance of serum retinol-binding protein and elevated
levels of transthyretin in insulin-resistantob/obmice. Am J
Physiol Endocrinol Metab 2008;294:E785-93.
[28] Wolf G. Serum retinol-binding protein: a link between obesity, insulin resistance, and type 2 diabetes. Nutr Rev 2007;65:251-6. [29] Hitman GA, McCarthy MI, Mohan V, Viswanathan M. The
genetics of non-insulin-dependent diabetes mellitus in South India: an overview. Ann Med 1992;24:491-7.