Optical properties and meteorological correlations of aerosol
parameters during 2007-08 over Mohal in the Kullu Valley of
northwestern Himalayan region, India
NAND LAL SHARMA
Department of Physics, Government Postgraduate College, Kullu, 175 101, Himachal Pradesh, India
Corresponding author; e-mail: [email protected]
JAGDISH CHANDRA KUNIYAL, RAJ PAUL GULERIA
Govind Ballabh Pant Institute of Himalayan Environment and Development, Mohal-Kullu 175 126, Himachal Pradesh, India
MAHAVIR SINGH
Department of Physics, Himachal Pradesh University, Shimla, 171 005, Himachal Pradesh, India
Received November 20, 2010; accepted November 29, 2011
RESUMEN
ABSTRACT
Observations from a ground based multi-wavelength radiometer (MWR) in the Kullu valley of the North Western Himalayan region from April 2007 to March 2008 show that the spectral aerosol optical depth (AOD) and the Ångstrӧm turbidity coefficient (β) are high during the monsoon season, slightly less in summer, low in winter and lowest during the autumn for clear, hazy and partially clear days while the Ångstrӧm wavelength exponent (α) has an opposite trend. Average annual values of the AOD at 500 nm are 0.25 ± 0.01, 0.46 ± 0.02 and 0.28 ± 0.02, for clear, hazy and partially clear sky days, respectively. The corresponding values of the β are 0.13 ± 0.01, 0.22 ± 0.01 and 0.15 ± 0.01 and those of α are 1.09 ± 0.04, 1.18 ± 0.03 and 0.89 ± 0.05. The α is slightly high, but the β is considerably higher on hazy days than on clear days, indicating that mountain haze is rich in coarse particles. There is a good agreement between MWR and satellite-based AOD values from MODIS, with annual correlation coefficients of 0.89, 0.70 and 0.81 for clear, hazy and partially clear days, respectively. The correlation of the AOD at 500 nm and the β coefficient with temperature, wind speed and humidity is significantly positive while that of the α
exponent is negative for most of days suggesting high AOD and turbidity but low concentration of fine particles on hot, humid and windy days and vice versa. Also, the correlation of AOD at 500 nm and β
coefficient with wind direction is mostly negative while that of the α exponent is positive, indicating that AOD and turbidity decrease but the concentration of fine particles increases as wind direction veers to become more southwardly at our site. Thus, winds heading toward our site from the Indo-Gangetic plains brought air rich in coarse particles while winds from more southward direction or from the Thar-Desert advected mostly fine particles during the period analyzed here.
Keywords: Aerosol optical depth, multi-wavelength radiometer, Ångstrӧm coefficients.
1. Introduction
It is well known that aerosols, through scattering and absorption, play a major role in Earth’s radiation budget and produce climate forcing (Charlson et al., 1992; Ramanathan et al., 2001) both at regional and global scale. The size, refractive index and total concentration of these aerosols in the atmosphere not only influence the formation of fog, mist and clouds (Ramanathan et al., 2003), but are also deciding factors to adversely impact human health (Oberdorster et al., 1990; Dockery and Rope, 1994) and ecosystems. The increased concentration of aerosol in the atmosphere is responsible for modifying regional as well as global radiation budgets and is thus disturbing climatic balance (Seinfeld and Pandis, 1998). All these optical characteristics of aerosols are under considerable investigation worldwide.
In India, the studies related to atmospheric aerosols are vigorously pursued under the Indian Space Research Organization’s Geosphere Biosphere Program (ISRO-GBP). It has been instrumental in the study of atmospheric aerosols in different regions of India (see Subbaraya et al., 2000 and references therein) and surrounding oceans, including the delicate Himalayan regions (Moorthy et al., 1998, 2007, 2008). The measurements of aerosol parameters such as
spectral aerosol optical depth (AOD) and Ångstrӧm coefficients (α and β) in the background
2. Experimental
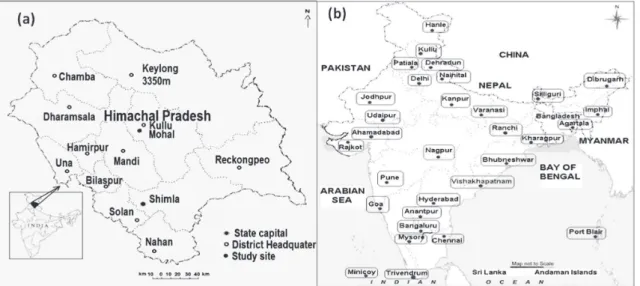
2.1 Location of site
The present study is carried out at the G. B. Pant Institute of Himalayan Environment and
Development, in Mohal (31º54’ N, 77º07’ E, 1154 mamsl) in the Kullu district of the Himachal
Pradesh (HP) state of India (Fig. 1a) with the help of ground based multi-wavelength radiometer (MWR). It is one of the stations of the ISRO-GBP and carries out the projects on Aerosol Radiative Forcing over India (ARFI) and Integrated Campaign for Aerosol Radiation Budget (ICARB) (Fig. 1b). It is a semi-rural location with a population of about 18 300, while the population of entire Kullu valley is 221 858 (Government of Himachal Pradesh, 2001).
The Kullu valley begins from Larji (957 m) in the lower Beas basin and stretches up to Rohtang Crest (4038 m) under upper Beas basin (Gajananda et al., 2005). It is an important tourist destination of the western Himalayas. It has witnessed tremendous growth in tourism (Kuniyal et al., 2004) as well as local vehicles over last decade. It is evident from the fact that from 2004 to 2008 the total tourist traffic to the entire state of HP increased from 6.55 million to 9.75 million, out of which the Kullu Manali alone hosted 2.12 million tourists in 2008 (Sharma et al., 2009). The valley which earlier was clean and serene has become a conglomeration of large anthropogenic activities, such as road constructions, mining, hydro-power generation and tourist activities.
2.2 Methods
The AOD are obtained using a MWR designed by Space Physics Laboratory (SPL), Thiruvanthapuram, Kerala, India. This MWR contains ten filters of wavelengths 380, 400, 450, 500, 600, 650,750, 850, 935, 1025 nm. The solar radiation from UV to NIR is passed through an automatic filter wheel. It works on the principle that aerosols reduce the intensity of solar radiation
due to scattering and absorption processes. Using the Lambert-Beer law (Shaw et al., 1973),the
flux of solar radiation at the surface of Earth can be given as Moorthy et al. (1998):
Fλ = F0λ
( )
rr0 e–m τλ (1)where Fλ and Foλ represents solar flux at the surface of the Earth and at the top of atmosphere
(TOA) respectively. ro and r denote mean and instantaneous Sun to Earth distance, while m denotes
relative air mass, representing relative increase in optical path with increase in zenith angle. τλ
is wavelength dependent optical depth. Neglecting refraction and curvature effects, ‘m’ can be approximately written as
m = sec χ (2)
MWR converts the incident flux into voltage through:
Vλ= V0λ
( )
rr0 2e–m τλ (3)Taking natural log on both side of Eq. (3)
ln Vλ = ln V0λ+ 2 ln rr0 –m τλ (4)
The optical depth τλ is determined from the graph of ln Vλ with m (called Langley plot), as
the slope of the best fit line. Menu driven software devised by SPL, yields one set of AOD at ten wavelengths for forenoon part and one set of AOD for evening part of the measurement day. Additional details of the instrument, data analysis and calibrations used in the present study have been published elsewhere (Moorthy et al., 2007; Aloysius et al., 2008). The data are collected on days when no clouds are near the solar disc and are grouped into clear days (when morning till evening the sky is clear), hazy days (when sky appears clear but is obscured due to haze) and partially clear days (when only forenoon (FN) or afternoon (AN) part of a day is clear).
During rainy days, the ground based MWR observations could not be carried out and so they alone are not sufficient in assessing the regional distribution of aerosols. To get a more homogeneous picture of the aerosol environment over this region, we compared our data with satellite derived observations. The Moderate Resolution Imaging Spectro-Radiometer (MODIS) is a key instrument present on board polar Earth Observing System (EOS) Terra and Aqua satellites, sensing FN and AN part of each day (Levy et al., 2007). It provides valuable information about the global distribution of aerosols and their properties. The MODIS derived AOD at 550 nm can be compared with ground
based AOD interpolated to 550 nm using Ångstrӧm formula (Ångstrӧm, 1961).
τ550 = τ500
–α
550 500
)
(
(5)The substitution of τ500 (optical depth at 500 nm) and α exponent, both measured by ground based
MWR will give τ550 (the calculated value of ground based AOD at 550 nm). Also, the correlation
automatic weather station at our site, was estimated using Student’s t distribution formula. The t thus calculated is used to find the probability Ps of correlation outside the region of significance under two
tailed column in T- Table. The Ångstrӧm coefficients α and β are calculated using Ångstrӧm relation as
τλ = ßλ–α (6)
The α exponent, is often used as a qualitative indicator of aerosol particle size or fine mode
fraction and coefficient β is indicator of coarse mode fraction of aerosols (Angstrom, 1964). Further,
by taking log of Eq. (6) we get
ln τλ = ln ß – α ln λ (7)
The best fit between observed τλ and λ determines β and α (Schuster et al., 2006). For the calculation
of α and β, one set of AODs at ten wavelengths for FN and AN part of a particular measurement day are used. The AOD value at 850 nm is not considered due to instability of this filter and AOD at 935 nm is discarded, due to its link to water vapor in the atmosphere (Moorthy et al., 1991).
3. Results and discussion
3.1 Meteorology during study period
The Kullu valley is a bowl shaped valley surrounded by mountain ranges from all sides. It receives most of its rains during the winter months while heavy snow fall is observed during winter along the adjoining hilltops. Figure 2 shows monthly meteorological conditions during all MWR operating days of the entire study period. It shows on average, temperature rising from 25.8º C in April to 29.7º C in
August, then decreasing gradually to 10.7º C in January and finally rising again to 21.1ºC in March.
Wind speed has almost same trend as temperature, showing an increase from 0.94 m/s in April to 1.33 m/s in September, then gradually decreasing to 0.71 m/s in December and then increasing
gradually to 0.92 m/s in March. The wind direction shows a fluctuating clockwise veer from 158ºN
(east of north) in April to 165ºN in June. It then backs slightly in July to 138ºN and thereafter again
a have a gradual veer to 191ºN in February. So, on average, the wind direction has a veering trend
from 138ºN to 191ºN during the entire period showing that the wind is gradually changing direction
from the south-east (the Gangetic plains) in summer, to south (Thar-Desert of India) in winter. The humidity increases from 35.5% in April to 52.9 % in August and then decreases gradually to 30.2% in March, with some exceptionally higher values during the rainy winter month of January. These meteorological conditions suggest that the climate of this region has four distinct seasons (Kuniyal et al., 2007): summer (April to June), monsoon (July to September), autumn (October and November) and relatively longer and harsh winter (December to March).
3.2 Aerosol optical depth 3.2.1 Temporal variations
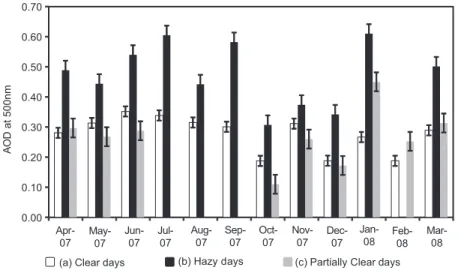
in summer from April to June, decreases in the monsoon months to become lowest in October. Thereafter, it starts increasing again in winter months for almost all types of days, with the exception of slightly more increase in January. It shows that AOD on hazy days are higher than on partially clear days, whereas AOD on clear days are lowest. Also, AOD are high in summer and monsoon, lowest in autumn and low in winter; a trend found at many locations (Holben et al., 2001; Wang et al., 2008). On average during full clear sky days, the AOD at 500 nm is 0.30 ± 0.02 in summer, 0.31 ± 0.02 in monsoon, 0.21 ± 0.01 in autumn and 0.23 ± 0.01 in winter season.
Fig. 2. Meteorological conditions during MWR measurement days at experimental site. 8.0
18.0 28.0
Apr-07 May-07 Jun-07 Jul-07 Aug-07 Sep-07 Oct-07 Nov-0
7
Dec-0
7
Jan-08 Feb-08 Mar-08
0.50 1.00 1.50 130 150 170 190
25.0 35.0 45.0 55.0
Humidit
y
(%
)
Wind direction
(ºN)
Wind speed
(m/s)
Temperatur
e
(ºC)
Fig. 3. Variations of monthly mean AOD at 500 nm for (a) clear days (b) hazy days (c ) partially clear days.
0.00 0.10 0.20 0.30 0.40 0.50 0.60 0.70
AO
D
a
t 5
00
nm
(a) Clear days (b) Hazy days (c) Partially Clear days
These values are large when compared to sloppy hill sites like Nainital and Hanle (Dumka et al., 2008; Verma et al., 2010) but are less than valley sites like Dibrugarh (Gogoi et al., 2008).
For hazy days, AOD at 500 nm on average is 0.49 ± 0.02 during summer, 0.55 ± 0.04 during monsoon, 0.35 ± 0.02 during autumn and 0.47 ± .04 during winter. And for partially clear days, which mostly occurred for FN part of a day, the FN-AOD at 500 nm is 0.28 ± 0.02 during summer, for monsoon months this value is not available due to overcast sky conditions. In autumn, the FN-AOD value is 0.20 ± 0.04 and during winter months, it is 0.29 ± 0.03. Annual mean FN-AOD at 500 nm for entire study period comes out to be 0.25 ± 0.01 for clear days, 0.46 ± 0.02 for hazy days and 0.28 ± 0.02 for partially clear days of present study period.
3.2.2 Spectral features of AODs
The spectral graphs for clear, hazy and partially clear days are shown in Figure 4, indicating a gradual decrease in the AOD with increasing wavelength, suggesting an abundance of fine over coarse particles in atmosphere (Kumar et al., 2009). The slight less slope at first filter indicates either non applicability of Mie scattering theory in the low wavelength region or a relatively low production of ultra fine particles in the hilly regions than in the plains. The increase in AOD at 1025 nm indicates relatively more concentration of coarse particles of large sizes. Also, the FN-AOD is almost the same as the AN-AOD during clear days showing that concentration of aerosols of all sizes is the same from morning till evening during those days. But during hazy days there is a large difference between the two, suggesting that the concentration of aerosol particles of all sizes increases from morning to evening due to windblown dust and other human activities.
Fig. 4. Annual spectral average FN, AN and mean AOD for (a) clear (b) hazy and (c) partially clear days.
0.00 0.10 0.20 0.30 0.40 0.50
380 400 450 500 600 650 750 935 1025
FN AN
0.00 0.20 0.40 0.60 0.80 1.00
AO
D
VA
LU
ES
0.00 0.20 0.40 0.60
(c) Partially Clear days
(b) Hazy days
(a) Clear days
Wavelength (nm)
3.2.3 Comparison with MODIS data
MODIS on Terra and Aqua satellites has proved efficiency in space based monitoring of aerosols over land. In the Indian context, validation of MODIS derived AOD has been attempted by
many studies (Tripathi et al., 2005; Gogoi et al., 2008; Sharma et al., 2010). We used latest
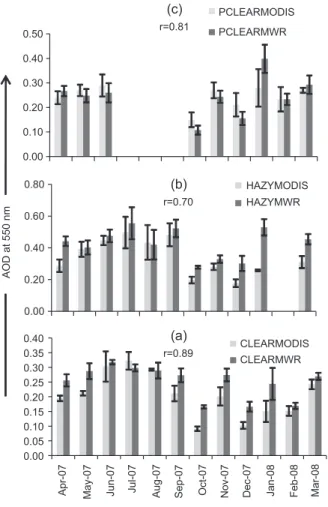
level 3 MODIS data to assess validity and efficacy of both MODIS as well as ground based instruments like MWR. Figure 5 shows a bar graph of the monthly mean AOD at 550 nm over Mohal, derived from MODIS and MWR for various types of days, showing good agreement in the trend as well as in the magnitude.
MODIS mostly underestimates values and except the noticeable difference in few cases, mostly there is a close agreement between MODIS and MWR values with mean absolute difference (MABD) of 0.08 and root mean square difference (RMSD) of 0.14. The two sets of daily mean AOD has been found to have a correlation of 0.75 for clear days, 0.65 for hazy days and 0.57 on partially clear days, whereas on a monthly mean basis, a better correlation between the two has been found: 0.89 (P < 0.01) on clear days, 0.70 (P < 0.05) on hazy days and 0.81 (P < 0.01) on partially
clear days.The time-averaged MODIS derived (on board Aqua platform) AODs at 550 nm over
Fig. 5. Monthly mean values of AODs at 550nm for (a) clear, (b) hazy and (c) partially clear days.
the Indian zone from 01 April-2007 to 31 March-2008 are shown in Figure 6a. Figure 6b shows scatter plot of all 165 diurnal AODs at 550 nm values derived from MODIS and interpolated from
ground based MWR present at our site.It shows a good correlation between MODIS and MWR
retrieved AOD at 550 nm with correlation coefficient of 0.76 and level of confidence P < 0.01. The slope of 0.79 toward MODIS derived AOD shows underestimation of AOD by MODIS. This indicates that the algorithm used in MODIS requires improvement to assess correctly the pollution in hilly and snowy areas.
Fig. 6. (a) Time averaged MODIS AODs at 550 nm over entire Indian zone and (b) scatter plot of MWR vs MODIS AODs.
(a)
(b)
R2 = 0.58, r=0.76
y = 0.7913x + 0.0983 0.80
0.70
0.60
0.50
0.40
0.30
0.20
0.10
0.00
0.00 0.20 0.40 0.60 0.80
MODIS AODs
MWR AOD
s
33N
30N
27N
24N
21N
18N
15N 12N
9N
70E 75E 80E 85E 90E 95E 100E
0.10 0.26 0.42 0.58 0.74 0.90 36N
3.2.4 Correlation between AODs and meteorological parameters
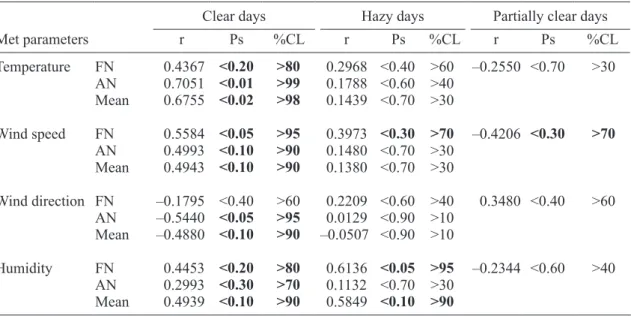
The confidence level of the correlation between monthly mean AODs at 500 nm and corresponding values of meteorological parameters during FN, AN and whole of day are shown in Table I. This correlation analysis shows a positive mean correlation coefficient of confidence level (CL) greater than 98 and 30% between temperature and AOD at 500 nm during clear and hazy days, respectively. The comparison suggests that this positive correlation is strong on clear days but not on hazy days. Also, the AN correlation is stronger than the FN correlation during clear days. Between wind speed and AOD, there is a strong positive correlation of CL > 90% during clear days and CL > 30% on hazy days. Thus, high wind speed increases AODs by transporting dust from the adjacent plains during clear days. Again, the comparison suggests that this positive correlation is stronger during FN of clear days compared to hazy days and for both types of days, the correlation is stronger during FN than during AN of measurement days.
Further, for entire study period, between wind direction and AOD at 500 nm, there is a strong negative mean correlation of CL > 90% during clear days, and very weak negative correlation of CL > 10% during hazy days. This correlation is stronger during FN than during AN of clear days. Finally, between humidity and AOD, there is a strong positive correlation of CL > 90% for clear and hazy days and this correlation is stronger during FN than during AN part of these days. This positive correlation suggests increase of AOD with humidity and vice versa due to deposition of moisture on fine aerosol particles increasing particle size and hence AOD.
3.3 Ångstrӧm parameters 3.3.1 Temporal variations
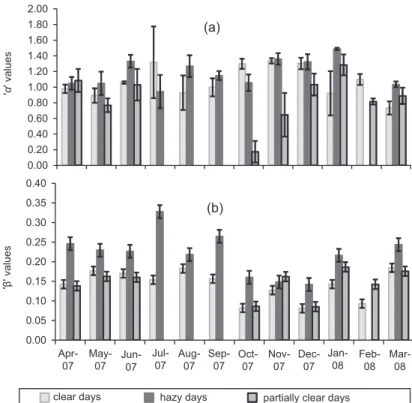
The monthly mean values of α and β calculated using Eq. (7) are shown in Figure 7. It confirms the universal fact that as α increases, β decreases and vice versa. Panel (a) of this figure depicts α
Table I. Confidence level of correlation between monthly mean AODs at 500nm and meteorological parameters (letters in bold represents significant correlation).
Clear days Hazy days Partially clear days
Met parameters r Ps %CL r Ps %CL r Ps %CL
Temperature FN 0.4367 <0.20 >80 0.2968 <0.40 >60 –0.2550 <0.70 >30 AN 0.7051 <0.01 >99 0.1788 <0.60 >40
Mean 0.6755 <0.02 >98 0.1439 <0.70 >30
Wind speed FN 0.5584 <0.05 >95 0.3973 <0.30 >70 –0.4206 <0.30 >70 AN 0.4993 <0.10 >90 0.1480 <0.70 >30
Mean 0.4943 <0.10 >90 0.1380 <0.70 >30
Wind direction FN –0.1795 <0.40 >60 0.2209 <0.60 >40 0.3480 <0.40 >60 AN –0.5440 <0.05 >95 0.0129 <0.90 >10
Mean –0.4880 <0.10 >90 –0.0507 <0.90 >10
Humidity FN 0.4453 <0.20 >80 0.6136 <0.05 >95 –0.2344 <0.60 >40 AN 0.2993 <0.30 >70 0.1132 <0.70 >30
small during the summer months, having smallest value in May. It then increases in the monsoon months and becomes largest in autumn and in early winter months. Finally, it again starts decreasing in later winter. The relatively higher value of α during June can be attributed to the peak vehicular flow due to tourists in this month increasing ultrafine/fine particles through their exhausts (Sharma et al., 2009). In July, the reason could be continental convective drift of fine dust by pre-monsoon winds. For clear days, the average seasonal value of α is 0.98 ± 0.05 in summer, 1.08 ± 0.12 in monsoon, 1.32 ± 0.02 in autumn and 1.01 ± 0.12 in winter season, while during hazy days these values are 1.14 ± 0.09 in summer, 1.12 ± 0.09 in monsoon, 1.21 ± 0.15 in autumn and 1.28 ± 0.13 in winter season. During partially clear days, the seasonal value of α are 0.96 ± 0.03 in summer, no data available in monsoon, 0.41 ± 0.19 in autumn and 1.01 ± 0.10 in winter. Such a trend is found at many sites in India and abroad (Devara et al., 2005; Wang et al., 2008). An important aspect of this bar graph is that α values are almost the same during hazy and clear days, showing that mountain haze does not contain large amount of fine particles.
Similarly, Figure 7b shows β increasing in summer months, becoming largest in May. It then decreases in the monsoon months due to washout/rainout effects and becomes small in autumn and early winter. Finally, it starts again increasing in the later winter months. For clear days, the average seasonal value of β is 0.15 ± 0.01 in summer, 0.16 ± 0.01 in monsoon, 0.10 ± 0.02 in autumn and 0.13 ± 0.02 in winter, while during hazy days the values are 0.23 ± 0.01 in summer, 0.27 ± 0.01 in monsoon, 0.15 ± 0.01 in autumn and 0.20 ± 0.03 in winter. During partially clear days, the seasonal value of β is 0.15 ± 0.01 in summer; no value is available in monsoon, in autumn it is 0.12 ± 0.03, while in winter it is 0.14 ± 0.02. Also, this figure shows considerably higher values of β during hazy days compared to clear days, indicating that haze contain coarse
Fig. 7. Monthly mean values of (a) α and (b) β for various types of days.
0.00 0.20 0.40 0.60 0.80 1.00 1.20 1.40 1.60 1.80 2.00
0.00 0.05 0.10 0.15 0.20 0.25 0.30 0.35 0.40
'
α
' v
al
ue
s
'β
' v
al
ue
s
(a)
(b)
Apr-07 May-07 Jun-07 Jul-07 Aug-07 Sep-07 Oct-07 Nov-07 Dec-07 Jan-08 Feb-08 Mar-08
particle in large amount. The annual whole day α is 1.09 ± 0.05, 1.18 ± 0.03 and 0.89 ± 0.04 for clear, hazy and partially clear days; while the annual whole day value of β for these types of days, are 0.13 ± 0.02, 0.22 ± 0.01 and 0.15 ± 0.02, respectively.
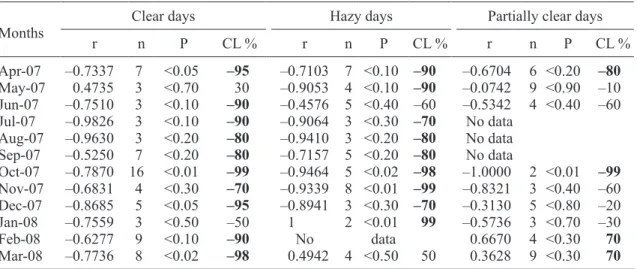
3.3.2 α vs β correlation
We analyzed the correlation between mean α and mean β of various days of different months during
the period studied and found it mostly negative, a result consistent with other studies (Gogoi et
al., 2008; Devara et al., 2005). Table II depicts these correlation coefficients on a monthly basis. It shows that during clear days, there is a negative correlation between α and β for almost all months except May, while during hazy days there is a negative correlation for all months, except January and March. During partially clear days, the correlation between α and β is negative, except in February and March. The positive anomalous correlation found mostly during the summer month in clear days and fall winter months in hazy and partially clear days, suggests that during these months both fine and coarse particle strength is of supplementary nature, i.e more fine particles as well as turbidity which in most of other months is of complementary nature, i.e. more fine particle, less turbidity and vice versa. The reason for this anomalous positive correlation between α and β could be convective airmass transport from far off places in these months raising coarse particles, which otherwise is less in these months due to less anthropogenic activities. On an annual basis, the correlation between monthly mean α and monthly mean β is slightly positive (0.07) during FN, –0.76 during AN and –0.69 during clear days. During hazy days, α vs. β correlation value is 0.68 during FN, –0.85 during AN and –0.54 during whole of the day, showing that the correlation coefficient is larger in the AN part than in FN part of clear days as well as hazy days. During partially clear days, for the entire period there is again a positive correlation of value 0.48 between α and β.
3.3.3 Correlation of α and β with meteorological parameters
The correlation of daily mean α as well as of daily mean β with daily mean meteorological
parameters is not consistently of the same sign as well as of sufficient confidence level for different
Table II. Confidence level of month wise correlation between α and β (letters in bold represent significant correlation).
Months Clear days Hazy days Partially clear days
r n P CL % r n P CL % r n P CL %
Apr-07 –0.7337 7 <0.05 –95 –0.7103 7 <0.10 –90 –0.6704 6 <0.20 –80 May-07 0.4735 3 <0.70 30 –0.9053 4 <0.10 –90 –0.0742 9 <0.90 –10 Jun-07 –0.7510 3 <0.10 –90 –0.4576 5 <0.40 –60 –0.5342 4 <0.40 –60 Jul-07 –0.9826 3 <0.10 –90 –0.9064 3 <0.30 –70 No data
Aug-07 –0.9630 3 <0.20 –80 –0.9410 3 <0.20 –80 No data Sep-07 –0.5250 7 <0.20 –80 –0.7157 5 <0.20 –80 No data
Oct-07 –0.7870 16 <0.01 –99 –0.9464 5 <0.02 –98 –1.0000 2 <0.01 –99 Nov-07 –0.6831 4 <0.30 –70 –0.9339 8 <0.01 –99 –0.8321 3 <0.40 –60 Dec-07 –0.8685 5 <0.05 –95 –0.8941 3 <0.30 –70 –0.3130 5 <0.80 –20 Jan-08 –0.7559 3 <0.50 –50 1 2 <0.01 99 –0.5736 3 <0.70 –30
Feb-08 –0.6277 9 <0.10 –90 No data 0.6670 4 <0.30 70
months. It is found that the correlation between daily mean α and daily mean meteorological
parameter for different months is different. The correlation between β and temperature is mostly
positive for all types of days indicating that coarse particle concentration increases on hot days. Between β and wind speed, there is a significant positive correlation, for most of the months, and almost all types of days. It shows more concentration of coarse particles brought or produced on windy days. Between β and wind direction, a significant negative correlation for most of months is found for all types of days indicating that, as wind direction veers or heads to our site from the south, the coarse particle concentration decreases and vice versa. In other words, the wind coming from the Indo-Gangetic plains brought more coarse particles to our valley than that coming from Thar-Desert of India. Finally, between β and humidity, there is a positive correlation for most of months indicating the expected trend that coarse particle strength increases with increase in humidity and vice versa, due to condensation of water vapors on fine particles growing their size and hence turbidity increases.
On a monthly basis, the correlation between α and temperature is significantly negative during most of the months, for all types of days. It indicates that the concentration of fine particles decreases with increase in temperature and vice versa. Similarly, the correlation between α and wind speed is significantly negative for most of months, for all types of days. It also indicates the decrease of fine particle concentration when wind speed increases and vice versa. The correlation between α and wind direction is significantly positive for most of months of all types of days. It shows that fine particle concentration increases as wind direction veers, coming from a more southwest direction (Thar Desert side of India) and vice versa. Finally, the correlation between α and humidity is significantly negative for most of months of all types of days. It suggests that fine particle concentration decreases with the rise in humidity and vice versa.
The monthly trend of correlation seen for most of months is confirmed by the annual trend. On
annual basis, the correlation coefficients of monthly mean α and monthly mean β with corresponding
monthly mean meteorological parameters is shown in the Table III. It shows that there is a good positive correlation of CL >95% between whole day β and temperature, and a negative correlation of CL >90% between whole day α and corresponding temperature, during clear and hazy days, respectively. This correlation is stronger during hazy days than during clear days. Again, whole day β vs wind speed correlation is strongly positive with CL >90% during clear and hazy days, while the whole day α vs wind speed correlation is negative although it is weak (CL >60%) during clear days and strong (CL >90%) during hazy days. This correlation is stronger in the AN part of day than in the FN part of a day. The Table also shows a moderate negative correlation of CL >80% between β
and wind direction for clear as well as hazy days. Between whole day α and wind direction, it shows
a weak negative correlation of CL >70% on clear days but a strong positive correlation of CL >90% on hazy days. Finally, the β vs humidity correlation coefficient are significantly positive (CL >70 to 90%) during clear and hazy days, while it shows a weak negative correlation during partially clear days, but α and humidity have a weak negative correlation for hazy and partially clear days, while on clear days it is weakly positive.
4. Conclusions
The AODs are high in monsoon, slightly less in summer, low in winter and lowest in autumn months for almost all types of days. Annual average AODs at 500 nm for the entire period are 0.25 ± 0.01 for clear days, 0.46 ± 0.02 for hazy days and 0.28 ± 0.02 for partially clear days.
The spectral analysis of AODs indicates that during clear days, FN-AODs are almost the same as AN-AODs at almost all wavelengths, but during hazy days at all wavelengths AN-AODs are higher than FN-AODs, indicating less production of pollutants during clear days but more production during hazy days from morning till evening.
There is a good agreement between ground based MWR and satellite based MODIS-AODs having correlation coefficient of 0.89, 0.70 and 0.81 during clear, hazy and partially clear days, respectively.
The AOD at 500 nm has significantly positive correlation with temperatures as well as with wind speed for most of months as well as on annual basis for clear days, while during hazy days it
Table III. Confidence level of correlation between β and α with meteorological parameters (letters in bold represent significant correlations).
‘β’ vs. Meteorological parameters
Clear days Hazy days Partially clear days
Met parameters r Ps %CL r Ps %CL r Ps %CL
Temperature FN 0.4290 <0.20 >80 0.5540 <0.10 >90 –0.0099 <0.95 >5 AN 0.5943 <0.05 >95 0.4913 <0.10 >90
MEAN 0.5835 <0.05 >95 0.5089 <0.10 >90
Wind speed FN 0.5527 <0.10 >90 0.5976 <0.05 >95 –0.4448 <0.20 >80 AN 0.5153 <0.10 >90 0.5193 <0.10 >90
MEAN 0.5287 <0.10 >90 0.4990 <0.10 >90
Wind direction FN –0.093 <0.80 >20 –0.0028 <0.95 >5 0.3704 <0.30 >70 AN –0.203 <0.60 >40 –0.2257 <0.50 >50
MEAN –0.234 <0.50 >50 –0.4437 <0.20 >80
Humidity FN 0.4815 <0.20 >80 0.7928 <0.01 >99 –0.0388 <0.95 >5 AN 0.1098 <0.80 >20 0.2510 <0.50 >50
MEAN 0.3980 <0.30 >70 0.7146 <0.02 >98 ‘α’ vs. Meteorological parameters
Clear days Hazy days Partially clear days
Met parameters r Ps %CL r Ps %CL r Ps %CL
Temperature FN –0.1562 <0.70 >30 –0.0103 <0.95 >5 –0.2370 <0.50 >50 AN –0.1687 <0.70 >30 –0.5553 <0.10 >90
MEAN –0.0781 <0.90 >10 –0.5271 <0.10 >90
Wind speed FN –0.0533 <0.90 >10 0.0968 <0.80 >20 –0.5286 <0.10 >90 AN –0.2416 <0.50 >50 –0.6440 <0.05 >95
MEAN –0.2792 <0.40 >60 –0.4955 <0.10 >90
Wind direction FN –0.0342 <0.90 >10 0.3886 <0.30 >70 0.1672 <0.70 >30 AN –0.3201 <0.40 >60 0.3601 <0.30 >70
MEAN –0.3809 <0.30 >70 0.5142 <0.10 >90
Humidity FN –0.0017 <0.90 >10 0.2491 <0.50 >50 –0.3582 <0.30 >70 AN 0.2402 <0.50 >50 –0.2832 <0.40 >60
is weakly positive. With wind direction, AOD has a strong negative correlation for clear days and with humidity, the correlation of AOD is strongly positive during clear as well as on hazy days. During partially clear days, the correlation coefficients of AOD with all meteorological parameters are too small and insignificant to draw any conclusion.
The monthly averaged α decreases from April to May, then increases during the monsoon months
becoming largest in autumn and early winter months and then again starts decreasing in the later winter months, while β has an opposite trend. The annual whole day α is 1.09 ± 0.05, 1.18 ± 0.03 and 0.89 ± 0.04 during clear, hazy and partially clear days, while annual value of β are 0.13 ± 0.02, 0.22 ± .01 and 0.15 ± 0.02, respectively.
The correlation between α and β is found mostly negative with few exceptions of positive
correlation. It is found to be positive during a few summer and winter months.
The correlation of α with temperature as well as with wind speed is found to be negative while that of β is found to be positive, on monthly as well as on annual basis. This correlation is weak during clear days, but strong during hazy days. With wind direction, a positive correlation of α and a negative correlation of β is found, during most of months. This correlation is also confirmed on an annual basis, except during clear days for α. With humidity, a negative correlation of α and a strong positive correlation of β is found for most of months. This correlation on an annual basis is strong only for β while for α it is mixed type.
Acknowledgements
Authors are thankful to the Director of the G. B. Pant Institute of Himalayan Environment and Development, Kosi-Katarmal, Uttarakhand, India for providing facilities at Himachal Unit of the Institute. Thanks are also due to ISRO, Bangalore, for providing MWR and financial support through Space Physics Laboratory, Thiruvanthapuram, for encouraging inter-institutional collaborative research program. This research is supported by NASA’s Giovanni, an online data visualization and analysis tool maintained by the Goddard Earth Sciences (GES) Data and Information Services Center (DISC), a part of the NASA Earth-Sun System Division.
References
Aloysius M., M. Mohan, K. Parameswaran, S. K. George and P. R. Nair, 2008. Aerosol transport
over the Gangetic basin during ISRO-GBP land campaign-II. Ann. Geophys. 26, 431-440.
Ångstrӧm A., 1961. Technique of determining turbidity of the atmosphere. Tellus 13, 214-223.
Ångstrӧm A., 1964. The parameters of atmospheric turbidity. Tellus 16, 64-75.
Charlson R. J., S. E. Schwartz, J. M. Hales, R. D. Cess, J. A. Coakley, J. E. Hansen and D. J.
Hoffman, 1992. Climate forcing by anthropogenic aerosols. Science 225, 423-430, DOI:
10.1126/science.255.5043.423.
Devara P. C. S., S. K. Saha, P. E. Raj, S. M. Sonbawne, K. K. Dani, Y. K. Tiwari and R. S. Maheskumar, 2005. A four-year climatology of total column tropical urban aerosol, ozone and
water vapor distribution over Pune, India. Aerosol Air Qual. Res. 5, 103-114.
Dockery D. W. and C. Rope, 1994. Acute respiratory effects of particulate air pollution. Annu. Rev.
Dumka U. C., K. K. Moorthy, P. Pant, P. Hegde, R. Sagar and K. Pandey, 2008.Physical and optical characteristics of atmospheric aerosols during ICARB at Manora Peak, Nainital: A sparsely
inhabited, high-altitude location in the Himalayas. J. Earth Syst. Sci. 117(S1), 399-405, DOI:
399-405. 10.1007/s12040-008-0041-y.
Gajananda K., J. C. Kuniyal, G. A. Momin, P. S. P. Rao, P. D. Safai and K. Ali, 2005. Trend of
atmospheric aerosols over north western Himalayan region, India. Atmos. Environ. 39,
4817-4825, DOI: 10. 1016/j. atmosenv. 2005.01.038.
Gogoi M. M., P. K. Bhuyan and K. K. Moorthy, 2008.Estimation of the effect of long-range
transport on seasonal variation of aerosols over north eastern India. Ann. Geophys. 26,
1365-1377.
Government of Himachal Pradesh, 2001. Population totals. Director of Census Operations part-2. India, pp. 1-79.
Holben B. N. , D. Tanré, A. Smirnov, T. F. Eck, I. Slutsker, N. Abuhassan, W. W. Newcomb, J. S. Schafer, B. Chatenet, F. Lavenu, Y. J. Kaufman, J. Vande Castle, A. Setzer, B. Markham, D. Clark, R. Frouin, R. Halthore, A. Karneli, N. T. O’Neill, C. Pietras, R. T. Pinker, K. Voss and G. Zibordi, 2001. An emerging ground-based aerosol climatology: aerosol optical depth from
AERONET. J. Geophys. Res. Atmos. 106, 12067-12097, DOI: 10.1029/2001JD900014.
Jayaraman A., 2001. Aerosol radiation cloud interaction over tropical Indian Ocean prior to on set
of the summer monsoon. Curr. Sci. India 81, 1437-1445.
Kumar K. R., K. Narasimhulu, R. R. Reddy, K. R. Gopal, L. S. S. Reddy, G. Balakrishnaiah, K. K. Moorthy and S. S. Babu, 2009. Temporal and spectral characteristics of aerosol optical depths
in a semi arid region of southern India. Sci. Total Environ. 407, 2673-2688, DOI:10.1016/j.
scitotenv.2008.10.028.
Kuniyal J. C., S. C. R. Vishvakarma, H. K. Badola and A. P. Jain, 2004. Tourism in Kullu valley: An environmental Assessment (B, Singh and M. Pal Singh, Eds.), Dehradun, India, 210 pp. Kuniyal J. C., P. S. P. Rao, G. A. Momin, P. D. Safai and K. Ali, 2007. Trace gases behavior in
sensitive area of north west Himalaya- A case of Kullu Manali tourist complex: India. Ind. J.
Radio Space Phys. 36, 197-203.
Levy R. C., L. A. Remer and O. Dubovik, 2007. Global aerosol optical properties and application to moderate resolution imaging spectroradiometer aerosol retrieval over land. J. Geophys. Res.
112, D13210, DOI:1029/2006JD007815.
Moorthy K. K., P. R. Nair and B. V. K. Murthy, 1991. Size distribution of coastal aerosols: effects
of local sources and sinks. J. Appl. Meteor. 30, 844-852.
Moorthy K. K., S. K. Satheesh and B. V. Krishna Murthy, 1998. Characteristics of spectral optical
depths and size distributions of aerosols over tropical oceanic regions.J. Atmos. Sol-Terr. Phys.
60, 981-992, DOI: 10.1016/S1364-6826(98)00044-3.
Moorthy K. K., S. S. Babu and S. K. Satheesh, 2007. Temporal heterogeneity in aerosol characteristics and the resulting radiative impact at a tropical coastal station - II: Direct short
wave radiative forcing. Ann. Geophys. 25, 2308-2320, DOI: 10.5194/angeo-25-2293-2007.
Moorthy K. K., S. K. Satheesh, S. S. Babu and C. B. S. Dutt, 2008. Integrated Campaign for
Aerosols, Gases and Radiation Budget (ICARB): An overview. J. Earth. Syst. Sci. 117,
243-262.
Oberdorster G., J. Ferin, G. Finkelstein, P. Wade and N. Corson, 1990. Increased pulmonary toxicity
of ultrafine particles? II Lung Lavage Studies. J. Aerosol Sci. 21, 384-387.
Ramanathan V., P. J. Crutzen, J. T. Kiehl and D. Rosenfeld, 2001. Aerosol, climate and the
hydrological cycle. Science 294, 2119-2124, DOI: 10.1126/science.1064034.
Ramanathan V., M. V. Ramana, I. A. Podgorny, B. B. Pradhan and A. B. Shrestha, 2003. The direct observation of large aerosol radiative forcing in Himalayan region. J. Geophys. Res. Lett.
31(L05111), DOI: 10.1029/2003GL018824.
Schuster G. L., O. Dubovik and B. N. Holben, 2006. Ångstrӧm exponent and bimodal aerosol size
distributions. J. Geophys. Res. 111, D07207, 14 pp. DOI: 10.1029/2005JD006328.
Seinfeld J. H. and S. N. Pandis, 1998. Atmospheric Chemistry and physics: from air pollution to climate change. John Wiley and Sons Inc. New York, 1326 pp.
Sharma N. L., J. C. Kuniyal, M. Singh, A. K. Negi, K. Singh and P. Sharma, 2009. Number concentration characteristics of ultrafine aerosols (atmospheric nanoparticles/aitken nuclei) during 2008 over western Himalayan region Kullu-Manali, India. Ind. J. Radio Space Phys.
38,326-337.
Sharma A. R., S. K. Kharol, K.V.S. Badarinath and D. Singh, 2010. Impact of agriculture crop
residue burning on atmospheric aerosol loading-a study over Punjab State, India. Ann. Geophys.
28, 367-379.
Shaw G. E., J. A. Regan and B. M. Herman, 1973. Investigation of atmospheric extinction using direct solar radiation measurements made with multiple wavelength radiometers. J. Appl. Meteor.
12, 374-380, DOI: 10.1175/1520-0450(1973).
Subbaraya B. H., A. Jayaraman, K. K. Moorthy and M. Mohan, 2000. Atmospheric aerosol studies
under ISRO-GBP. J. Ind. Geophys. Un. 4, 77-90.
Tripathi S. N., S. Dey, A. Chandel, S. Srivastava, R. P. Singh and B. N. Holben, 2005. Comparison of MODIS and AERONET derived aerosol optical depth over the Ganga Basin, India. Ann.
Geophys. 23, 1093-1101.
Verma N., S. P. Bagare, S. K. S. Ningombam and R. B. Singh, 2010. Aerosol optical properties
retrieved using skyradiometer at Hanle in western Himalayas. J. Atmos. Sol-Terr. Phys. 72,
115-124, DOI:101016/j.jastp. 2009.10.016.
Wang Y., J. Xin, Z. Li, S. Wang, P. Wang, W.M. Hao, B.L. Nordgren, H. Chen, L. Wang and Y. Sun, 2008. Seasonal variations in aerosol optical properties over China. Atmos. Chem. Phys.